 There has been a lot of chatter around the exceptionally low goals total during the first 4 weeks of the 2013/14 Premier League. Smart articles such as this one from Mark Taylor discuss, using statistical methods, just how much of an outlier the start to the season has been. I wanted to employ my methods to see if I could shed any light on where all the goals have disappeared to during the first 40 games of the 2013/14 Premier League season. TheExpG values quoted in this piece are the result of the work that that Constantinos Chappas and I have undertaken. Using all the available shot information, we assign a probability of each shot being scored; we term this ExpG. A little more detail can be found in this introductory article I will compare the start of this season with the opening 4 Game Weeks from last season.
 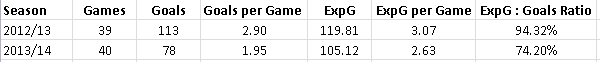 At this stage last season 39 games were played and this resulted in a very healthy goals total of 113, or an average of 2.90 goals per game. Fast forward 12 months, and after 40 games have been played and we are seeing less than 2 goals being scored per game – hence all the discussion around our lack of goals. The 2.90 goal average at the start of last season was slightly high, and this regressed to a more normal 2.80 as the 2012/13 season progressed. However, at this stage I’m not really interested in directly comparing the 113 goals last season with the 78 goals scored this season. In medical terms, this shortfall of 35 goals could be described as the symptom; I’m interested in seeing if I can uncover the cause. Last season is a good base to compare the current season as its goal total at this stage was just 2 or 3 goals ahead of what a typical Premier League season is likely to have experienced. The important figures in the table above are last three columns which are the expected goals that the shots taken should have generated, the average per game, and finally the actual goals viewed as a ratio of the ExpG value. ExpG Values What the ExpG values tell us is that, although the shots that are being taken this season are less threatening than we saw last season (and I would assume from before that as well), the shot selection doesn’t explain nearly all of this season’s impotence. Actual goals are only being scored at 74% of the clip that our model would expect them to be scored at based on the quality of the shots attempted. As seen in the introductory article referenced above, the Premier League finished last season with actual goals being scored at approximately 90% of the rate that our model had expected. The reason that this is not 100% is that the model was fitted with data from Europe’s Big Leagues and it is well documented that, presumably due to defensive pressure, it is much more difficult to score or get shots on target in the Premier League than it is in Germany. A Typical Start to the Season Let’s set out what a boringly average start to the season would look like. A normal, run of the mill, start to the season would have seen approximately an average of 2.80 goals per game. So after 40 games we would have expected (all other things remaining equal) to have seen 112 goals; and for those 112 goals to have been scored I would have expected our model to be showing an ExpG total of 124 (this allows for the 90% efficiency in the EPL). Our shortfall in actual goals scored so far is 34 (112 – 78) and this variance can be broken down into its constituent parts, ie the amounts being due to insufficient ExpG (Shot Selection) and the amounts arising as a result of the shots that were taken not being converted at the expected rate (Shot Conversion). Variance due to Shot Selection For the 2013/14 season to be on track at this stage we should have seen 124 ExpG being converted at 90%, but instead there have just been 105 ExpG. So the variance due to shot selection, or lack of, is: (124 – 105) * 0.90 = 17 goals Variance due to Shot Conversion Based on a normal ExpG conversion ratio of 0.90 for the Premier League, the shortfall in goals due to poor conversion of the shots that have actually been taken is: 105 * (0.90 – 0.742) = 17 goals Distribution of Goals Shortfall So, we have demonstrated that the 34 goal shortfall experienced at the start of this season in comparison to a “normal” Premier League season can be attributed equally, 17 goals each, to the shots that are (not) being taken and to how those shots are being converted. Or shot selection and shot conversion. The first component of the shortfall, the shot selection or lack of, may be due to playing styles. Possible explanations of this include the Liverpool shelling during the first 3 games, prudent Moyes taking over at Man United and Mourinho playing some pretty conservative football. Perhaps those tactics may well continue into the season, and thus we will continue to see lower ExpG values than we are used to in the Premier League. Alternatively, perhaps the lower ExpG values are primarily due to small sample sizes and / or chance with the result that the deficit being caused by shot selection will unwind itself as more games are played. Whatever about the shot selection component being due to chance or otherwise, I am certain that the conversion part, which is also responsible for 17 goals, of the shortfall is entirely due to chance and this will quickly correct itself as the number of games played increases. Why the low conversion rates this season? The table below excludes Own Goals (3 last season and 1 this season) and presents the data by ExpG bands which have been rounded to the nearest 0.05 of a goal.
 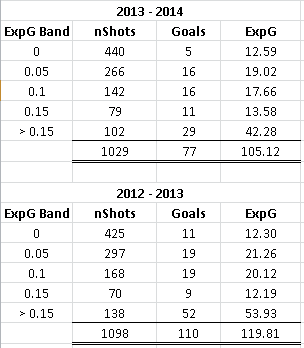 The two bands which are the biggest outliers this season in terms of Actual Goals versus Expected Goals are the shots that had a goal probability of more than 0.15, ie the best chances and the very speculative shots which each have a goal probability of less than 0.025. There probably isn’t much point in analysing why the 440 shots with the lowest scoring probability have scored 6 less goals that I would have expected, but the shortfall within the best chances band is interesting. Within this banding, the 42 ExpG translates to 38 actual goals if the 90% EPL efficiency is adhered to. So the 9 goal shortfall out of 102 very good chances is interesting. 23% of these shots were saved this season; this compares with a saving rate of just 14% last season. I’m all for giving goalkeeper’s credit when they pull off great saves, but this large increase in saving rates of very good chances gives further credence that the goals shortfall, that is at least attributable to the poor conversion rate of chances attempted, will be temporary. In my opinion, the part of the goals shortfall that is due to the number and type of shots being taken is also likely to regress to more normal levels. However, for this component there is always a chance that the change in playing styles observed this season within the league may ensure that the shots attempted continue to be less than we would expect.
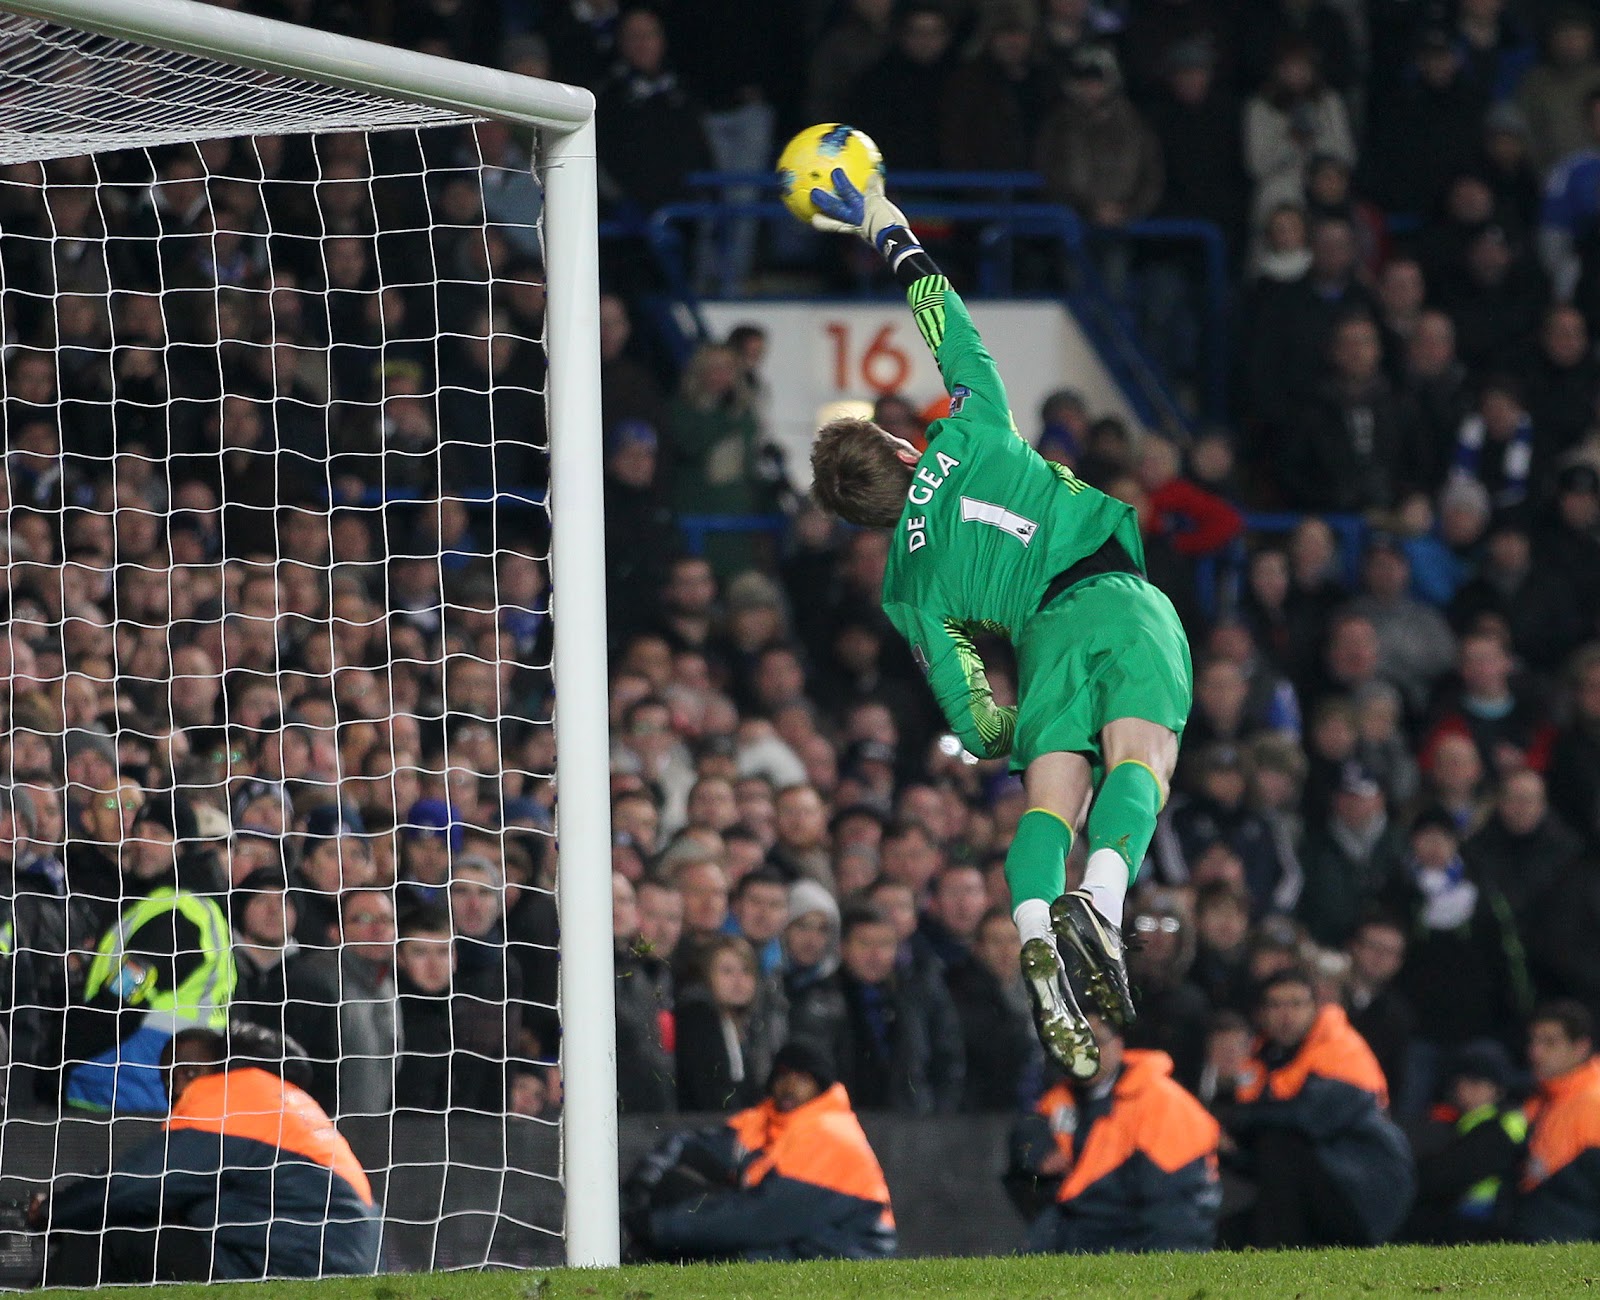
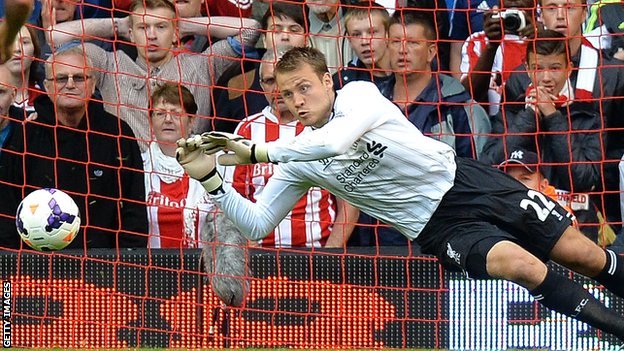
2013
Where Have All The Goals Gone?
By Antonio
|
September 17, 2013