In the article I published on Monday I introduced our (Constantinos Chappas and I) ExpG2 metric as an objective quantitative method to rate the shot saving performances of goalkeepers. Due to the way that ExpG2 values are calculated it makes an excellent objective measure of how effectively a goalkeeper dealt with the shots he faced.
To recap, the ExpG2 value is the goal expectation that each shot has after it has been struck by the player shooting and it is calculated with reference to all of the data that we know about the shot. One of the main drivers of the ExpG2 values is the placement of the shots. Any shot that is blocked or off target has an ExpG2 value of zero.
What information do we know about the shot? We have the information that is provided by Squawka and StatsZone (both of which are powered by Opta). Unfortunately, we have no defensive pressure data available to us so the ExpG2 values do not take into account defensive pressure. Still, even with that omission we’re left with what, in my opinion, is the most objective measurement of how a goalkeeper performed from a shot stopping point of view.
My article on Monday looked at EPL ratings for last season, and I promised that I would use the same methodology to rate the goalkeepers for the current season. I’m going to present the data from the first 8 games in the EPL this season, but due to the lack of games played I need to issue a warning as to the volatility of these results.
You will see that even just 1 more goal conceded or prevented may substantially change the ratings at this early stage of the season. That’s not the fault of ExpG2, it’s simply reporting mathematically, what has happened.
2013/14 EPL Season (thru 8 Games)
We’ll start off with looking at all shots for goalkeepers that have faced at least 32 shots (that’s 4 per game).
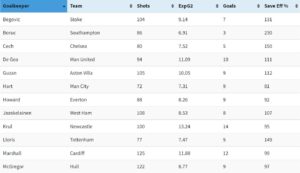
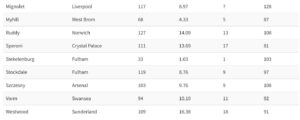
ExpG2 is the amount of goals that our model expected the goalkeepers to concede based on the type of shot and shot placement
Goals are the number of goals conceded by the respective GKs Save Efficiency is (ExpG2 / Goals), with a higher number signifying less goals than expected were conceded
This table has been sorted by default in descending order of Save Efficiency, but you can sort the table as you wish.
Southampton
We can immediately see part of the reason why Southampton has had such a great defensive record at the start of this season. The concession of just 3 goals means that their defence has conceded the least so far in the Premier League. As you would expect with such an excellent defensive performance, it has been achieved as a function of both great goalkeeping and a defence or team that protected him very well.
From the protection point of view, the fact that the shots faced by Boruc has lower ExpG2 values than all the other teams in the Premier League demonstrates that his teammates in front of him have excelled at ensuing Boruc had just the minimum amount of work to do.
The Save Efficiency % suggests that Boruc has massively outperformed as he has saved 4 more goals than his numbers would have suggested. His value of 230% is excellent, but unless he now gets changed in a phone box before matches and wears his underpants outside his shorts his Save Eff number will inevitably have to reduce. For reference, De Gea was the league leader in this measure last season at 138%.
Although I’m absolutely confident that Boruc’s Save Eff % will regress, it will be really interesting to see if his teammates can keep him as well protected for the remainder of this season.
Here is Boruc’s Shot Chart for shots faced this season. Saves are the white balls and goals conceded are the red ones. You can see why he has earned a rating of 230%.
Boruc's Shots Faced
Cech, Lloris, Begovic and Mignolet are all bunched up fairly tight behind Boruc as the best of the rest. Each of those 4 goalkeepers has saved their teams approximately 2 – 2.5 goals so far this season. Mignolet’s performance reaffirms the decision that Liverpool made to replace Reina with the Belgian.
Eagle eyed readers will see that this table doesn’t average at 100%. The reason for this is that our model wasn’t fitted using just this dataset. We used a number of leagues and a longer time period. The fact that the average sits well above 100% tells us that goals haven’t been scored at the rates that the raw shot data would dictate. Perhaps this may be due to the defensive pressure in the Premier League that we cannot measure, or it may also be due to short term variance. Most likely, it’ll be a combination of those two factors.
Fulham
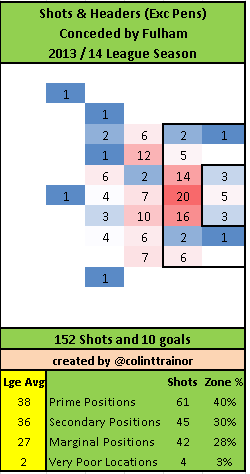
Anyone who follows me on Twitter will have seen the Fulham Shot Chart that I published yesterday morning. They have conceded a huge amount of shots from what appear to be great locations:
Yet they have only conceded 10 goals. So, for me, it’s interesting to see that the ability of Fulham to prevent those shots turning into goals on a more regular basis doesnn't seem to be down to the performance of Stockwell in goals as he is actually one of the poorer performing keepers so far on this metric.
Everton fans won’t like to see Tim Howard with just 92%. Mind you, the Man City fans might just wish that Tim Howard was their goalkeeper.
Joe Hart
In Monday’s article I concluded that Joe Hart was below average last season, and this under performance was solely attributable to the long range shots he faced. As I said at the top of this piece, it’s early in the season and much too early to be drawing too many conclusions from these numbers but the lack of saves made thus far by Joe Hart is alarming. He has conceded almost 2 goals more than the shots he has faced would suggest.
If I can brielfy have a licence to be melodramatic, we can compare the sublime (Boruc) with the ridiculous (Hart) with Joe Hart’s shot chart:
As England’s Number 1, or even just a Premier League standard goalkeeper, Hart will be disappointed with how poorly he has saved the shots aimed at him during City’s opening 8 games. In this regard it will be interesting to see how Hart performs over the remainder of the season and just how high he can lift his rating from the current 81%.
Shots from Inside the Penalty Area
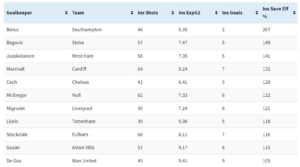
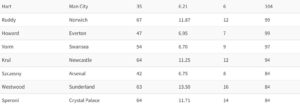
We have included goalkeepers that have faced at least 32 shots from inside the penalty area. Unsurprisingly, the general shape of this table is the same as the overall one with a few noticeable differences. Joe Hart has a more respectable 104% Save Efficiency rating for close range shots (this mirror’s last season’s pattern) and Arsenal’s Szczesny goes the other way down the table with what looks to be some poor shot stopping from shots taken inside the area.
Shots from outside the Penalty Area
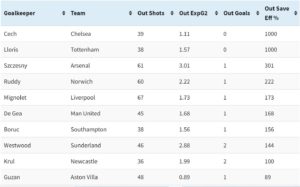
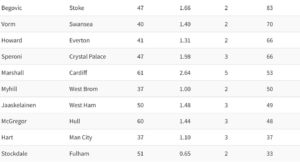
The final table shows the shots that each keeper faced from outside the area. Given the relatively few goals that the keepers have conceded from long range shots at this stage of the season these ratings are incredibly volatile and will change quite a lot as more goals are conceded.
So with that in mind, a large dollop of prudence is required when trying to undertake any analysis of these values. They are provided for information purposes as much as anything else.
Joe Hart’s unfortunate penchant for being beaten from long range has seemed to continue into this new season. He has conceded 3 goals from outside the penalty area, when our model suggests that he should have been beaten on only one occasion. It does appear that Hart has an issue with saving long range shots; this pattern has emerged from this data, the piece I looked at on Monday as well as this article by Paul Riley. Generally, I’m not a fan of long range shooting, but if I was advising any of Man City’s opposition I certainly wouldn’t be discouraging them from trying their luck from long range a little more often than would ordinarily be good for them.
At the top of the table, Szczesny has done really well in producing a mirror image of Hart’s numbers – he conceded just 1 goal when he “should have” conceded 3, whilst two other London based keepers, Cech and Lloris, are yet to be defeated from shots outside the area.
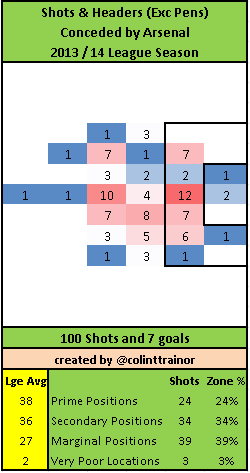
It’s worth noting that Szczesny’s ExpG2 value for shots from outside the area is significantly higher than any of the other keepers in the league. This is due to the fact that Arsenal have been excellent at forcing teams to shoot from long ranges. Here is the Shots Chart for shots conceded by Arsenal this season:
The Small Print
For those not familiar with my work, perhaps a brief introduction to me may help manage readers’ expectations.
I see myself primarily as a sports bettor and the articles that I write here on Statsbomb are only possible thanks to the huge amount of data that I have collated and analysed for betting purposes. If I didn’t bet then I’m quite sure that I wouldn’t have spent the time required to collect the necessary data.
So the plus side is that my articles exist as a by-product of my football betting. The downside is that I always need to be mindful of my betting edge. This inevitably means that I can’t get into specifics as to how our models work or what’s taken into account in their calculation. Sorry, but that's the deal I made with myself.
