In a previous piece I ran a fairly critical eye over the Key Pass metric. By way of a definition, the term “Key Pass” used in this article refers to both Opta denoted events of Assist and Key Pass, ie the final pass or pass-cum-shot leading to the recipient of the ball shooting (regardless of the outcome of the shot).
The beauty about the Key Pass metric is that it is simple (someone just needs to count the number of passes or pass-cum-shots that lead to a shot), but like all simple metrics it has some shortfalls that can dilute its usefulness. As we are only looking at a one dimensional metric it implicitly assumes that all Key Passes can be viewed equally, obviously this is not the case in real life football and it’s this element of the Key Pass stat that analytics naysayers will latch on to.
In this article, I’ll give my thoughts on some advanced Key Pass metrics that can be used in objectively assessing the creativity of players. This task is what the Key Pass metric tends to be used for, so I’ve spent some time thinking about how to improve on this benchmark measure.
Top 20 EPL Key Passers
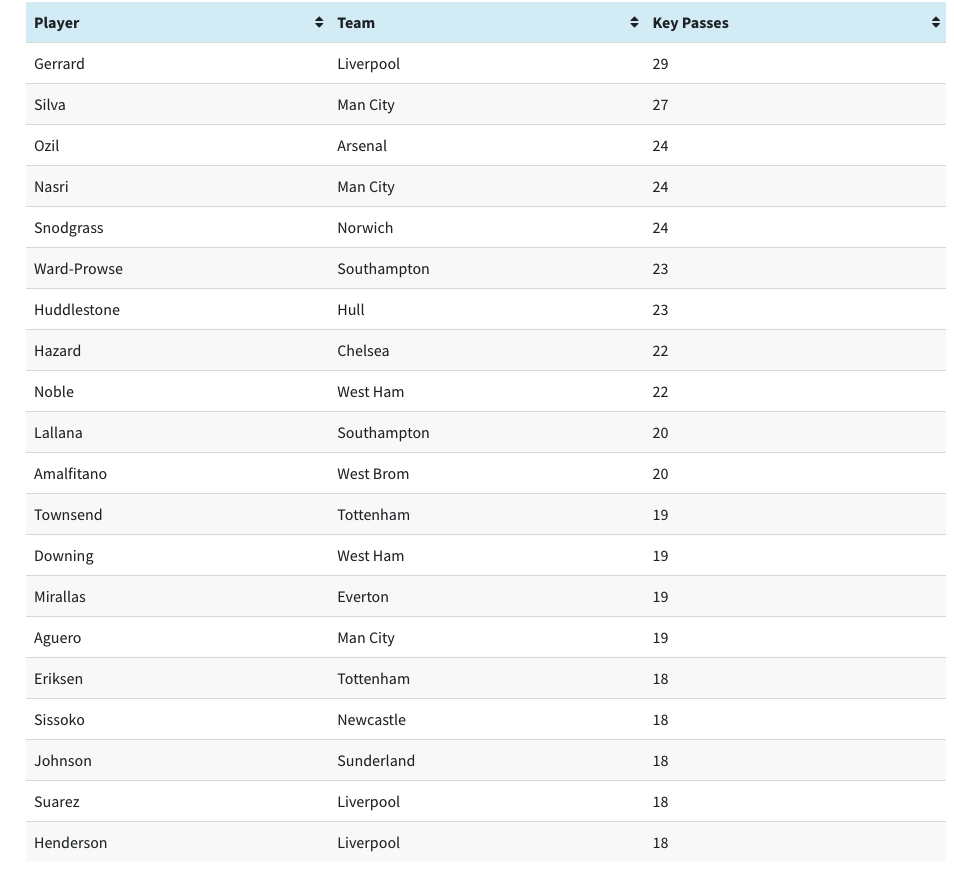
We’ll start by looking at the Top 20 players ranked by the number of Key Passes achieved in the first 11 games of the 2013/14 EPL season.
Goals per Key Pass
The purpose of analytics is to put raw statistics into context and to reveal patterns contained within the data. One qualifier that we could look at to provide additional context would be the number of goals that each of the players has directly created from their Key Passes.
The following table lists the numbers of goals created by each of our 20 players, and the table is ranked in descending order based on the number of goals created per Key Pass.
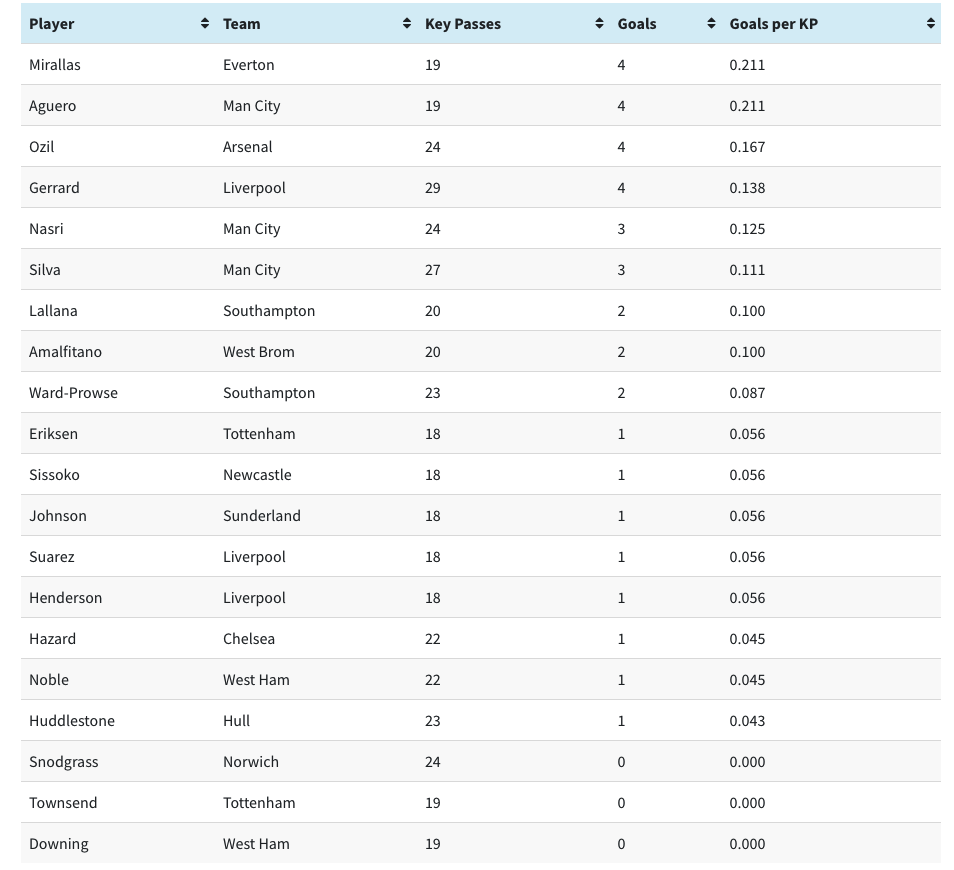
The order that the players appear in the list is quite different to the previous table. We have players in the shape of Andros Townsend, Stewart Downing and Robert Snodgrass who somehow haven’t managed to assist for a goal in the Premier League between them this season from the combine total of 62 shots that they have set up. Is it co-incidental that these three players could be categorised as wingers?
At the top of this particular table we can see that Kevin Mirallas and Sergio Aguero see a goal scored from more than 1 in every 5 shots they pass. Arsenal’s creative genius Mesut Ozil does nearly as well with every 6th Key pass of his resulting in a goal.
I don’t think that using goals scored is the best method to gain an increased understanding from the Key Pass metric. Goals are scored at such an infrequent rate that it leads to a large amount of volatility in a measure like this.
Key Passes per 90 Minutes
Another way of viewing the Key Pass data could be to compare players Key Passes in relation to their playing time. The most logical method of doing this is to compare Key Passes in each 90 minute period that players have been on the pitch.
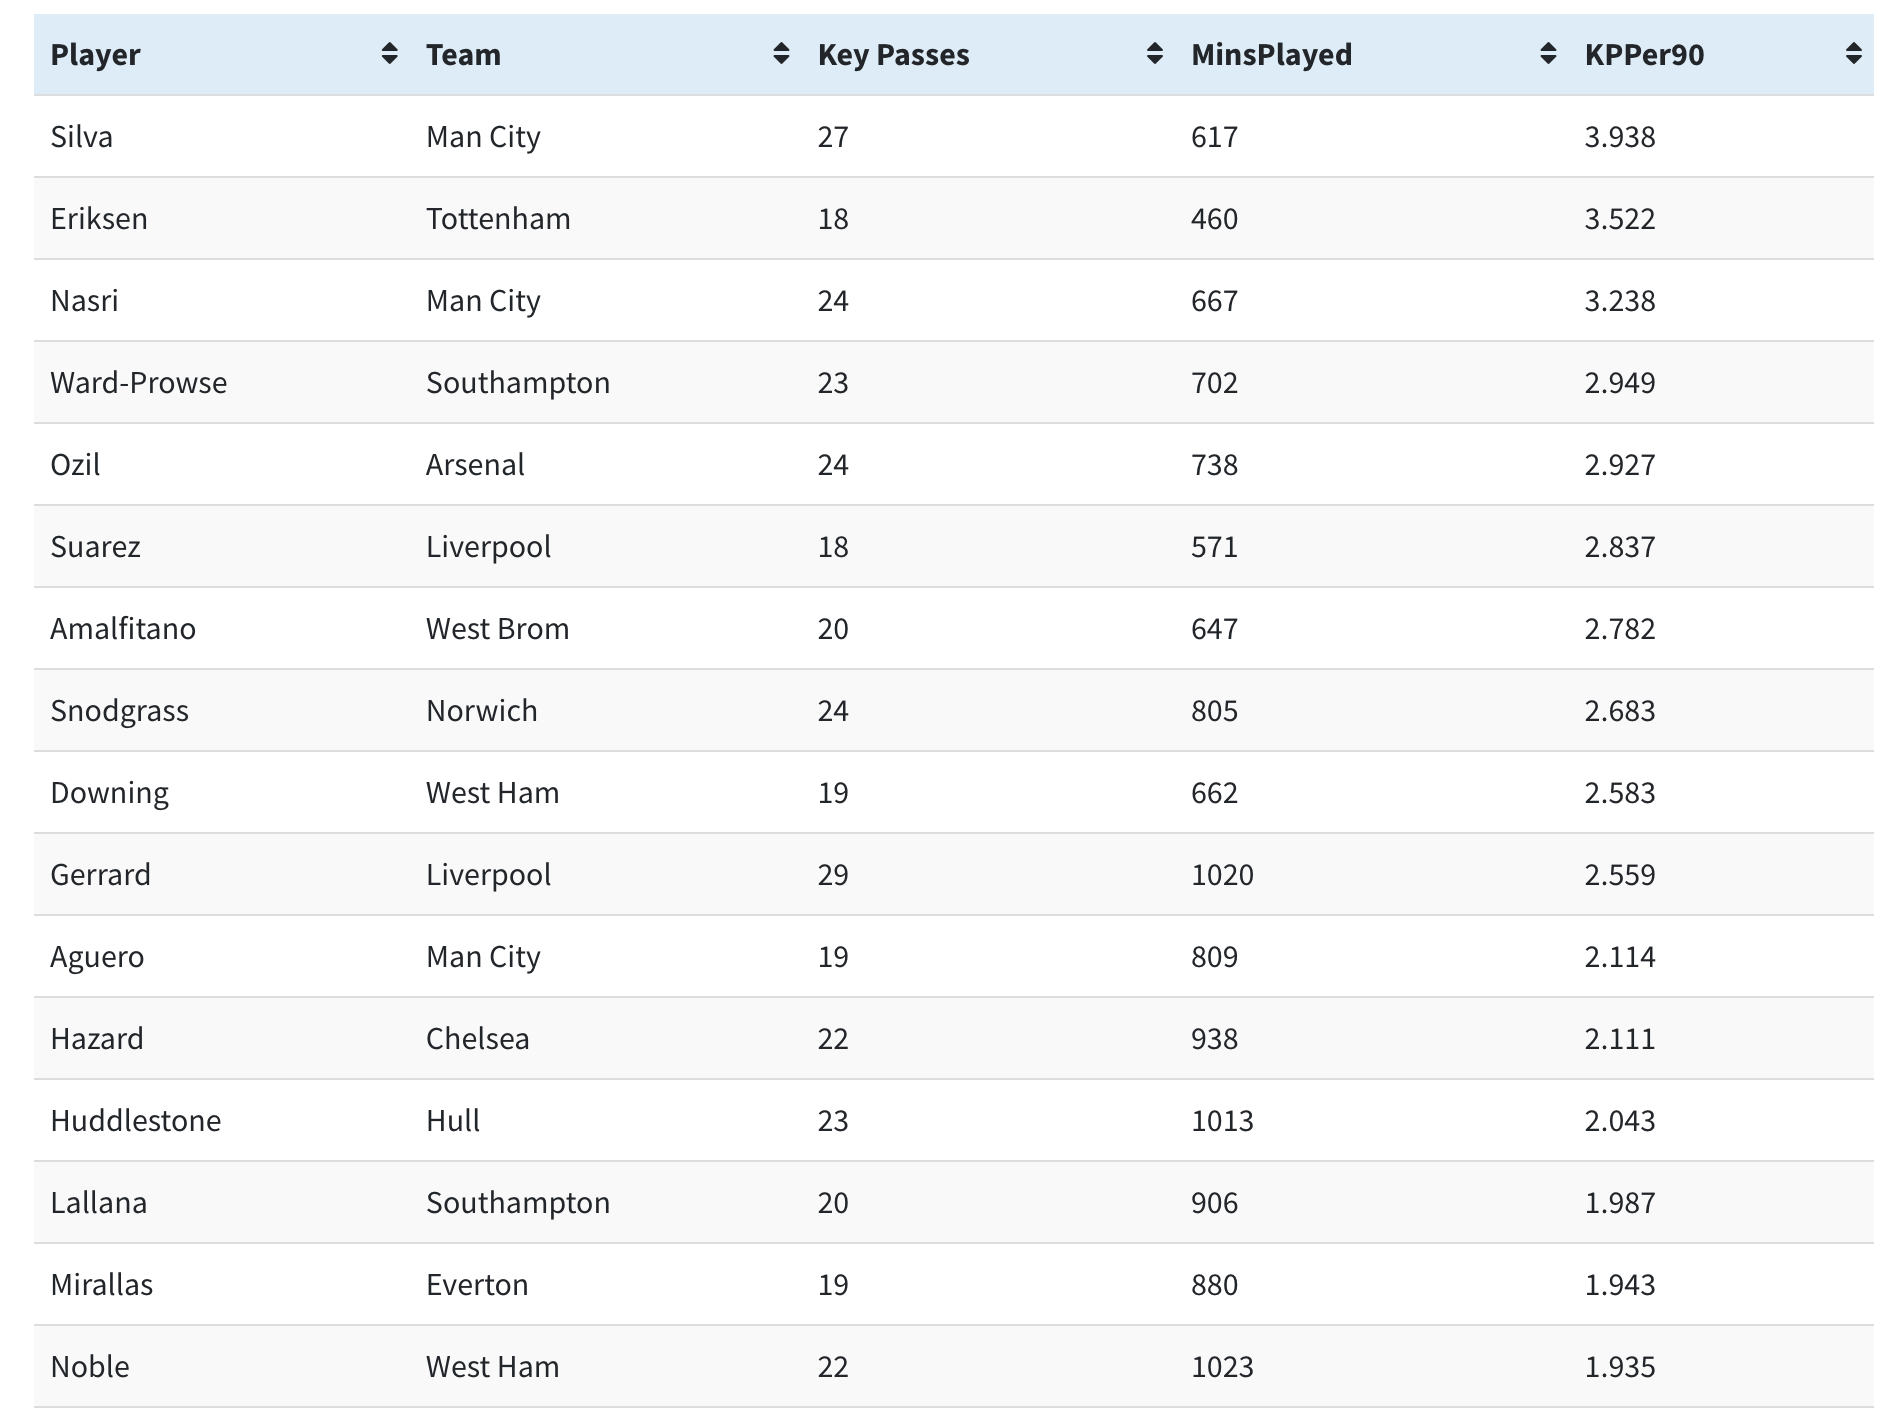
Minutes Played in this table is actual minutes on the clock (including Injury Time) as opposed to a standard 90 minute game. Arguments could be made either way for which method is correct, but I record actual minutes in my database so that’s what we’ll use.
This table has been sorted by Key Passes per 90 minutes played.
Christian Eriksen is the player that has benefitted most from viewing Key Passses in this manner due to the lack of time he has played for Tottenham in the Premier League this season. Only he and David Silva have more than 3.5 Key Passes per 90 minutes.
The Per90 measurement is a pretty useful way of viewing any game stats as it controls for time spent on the pitch, however it has same downside inherent with all Key Passes tables in that it can do nothing else but assume that all Key Passes are created equal.
Incorporation of ExpG values
Those familiar with my work will know that I, along with Constatinos Chappas, have created an Expected Goals (ExpG) model. You can find out a little bit more about this concept and some related pieces elsewhere on this site.
In summary, our ExpG model uses detailed inputs to assign a probability of any given shot being scored. Although the inputs are extremely detailed they stop short of including any defensive pressure due to the total lack of data on this element. However, even taking that limitation into account we feel that they are the most accurate objective assessment of shot quality.
So far, I have used the ExpG metric to look at a number of analytical topics. These include the type of chances that strikers take, the conversion rate of both players and teams compared to what their quality of chances made and defended against would suggest and as a method to assess the saves that goalkeepers have made.
Assessing the quality of Key Passes is another part of the game where our ExpG model can save a lot of subjective discussions and time in objectively quantifying the quality of the chances created. In common with all analytical work, I’m not suggesting that the ranking produced by this method should be taken without question in terms of determining the most creative players in the league, but it provides a great starting point for anyone who wanted to assess the quality of chances that each player has created.
For information; the ExpG value of each Key Pass has been calculated based on the ExpG value of the subsequent shot, not the point at where the Key Pass ended.
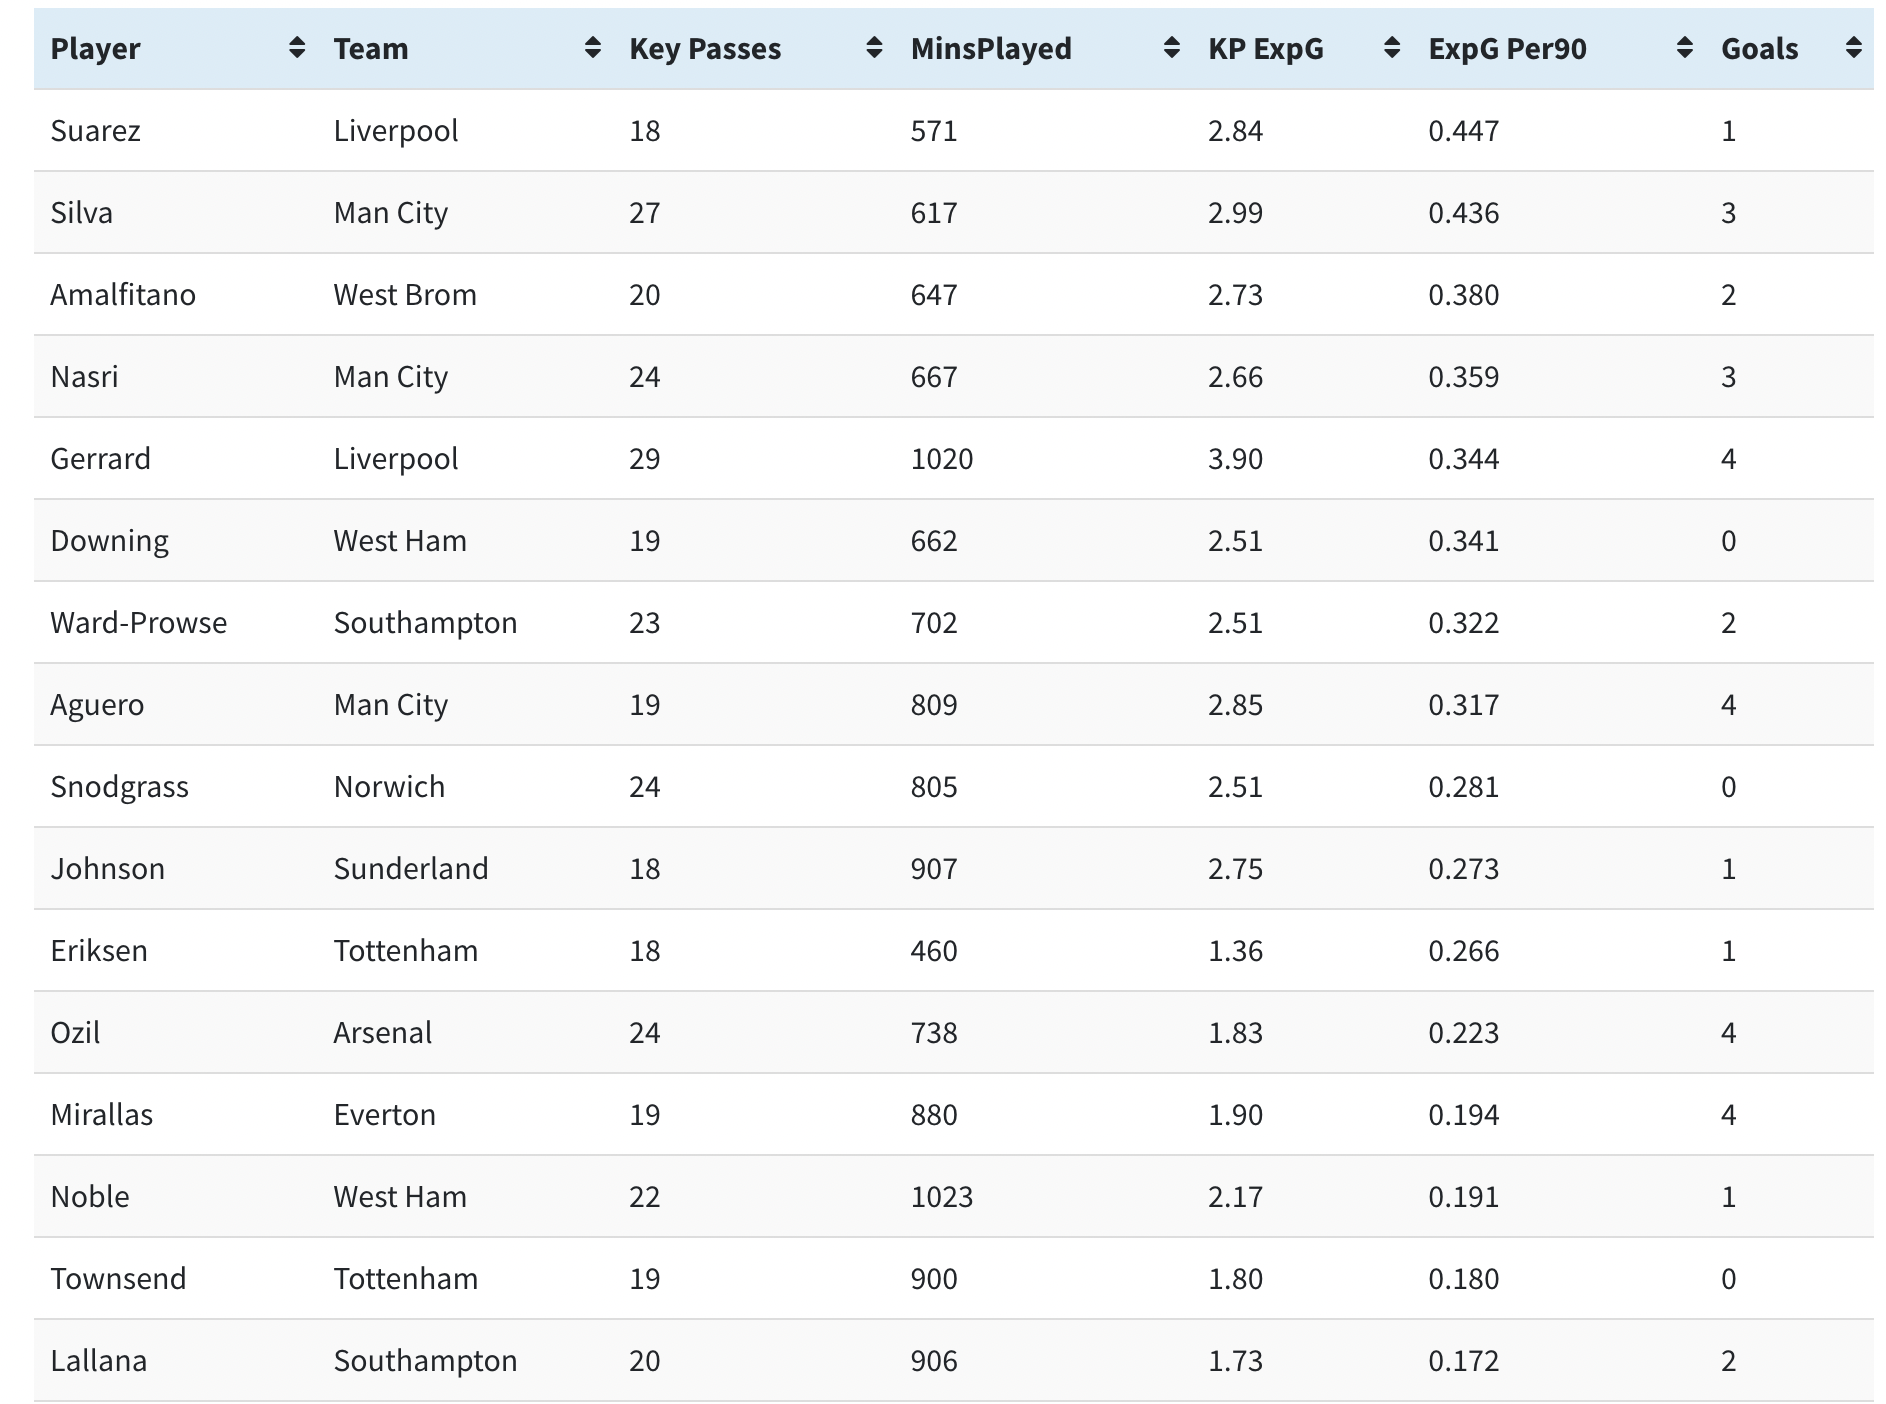
The above table contains quite a lot of information so it may help to provide a little explanation.
KP ExpG is the total Expected Goals that the Key Passes made by each player “should “ have resulted in
ExpG Per90 shows the total ExpG per 90 minutes that each of the players have created - this is the most important stat in this table
Goals are the actual goals scored from the players’ Key Passes
The table has been ranked in descending order of ExpG Per90.
Luis Suarez surprisingly tops the table with his passes expected to set up 0.45 goals per 90 minutes. Even though he has had less than 3 KPs per 90 minutes, the quality of the chances he has set up has been such that he has achieved top ranking in this table.
When you consider that, unlike most of the players in this table, Suarez’s role is about scoring as much, if not more, than assisting, his creative performance has been exceptional. He would seem unfortunate to only have set up one goal from the chances that he has created.
Here is a chart plotting the shots taken by Liverpool that has been set up by Suarez:
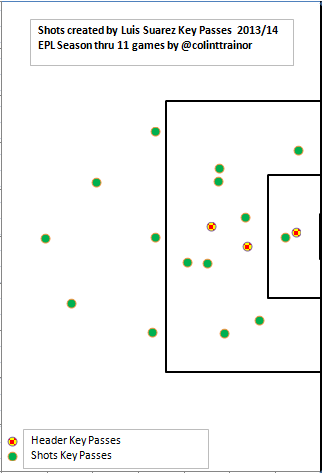
It will be really interesting to see if Suarez can maintain his position at the top of the creative table as the season progresses, personally I would have my doubts.
Fans of David Silva, of which I count myself one, will not be surprised to see the little Spanish wizard rank high up this table. He has created three goals this season, which is exactly in line with what our ExpG model would expect.
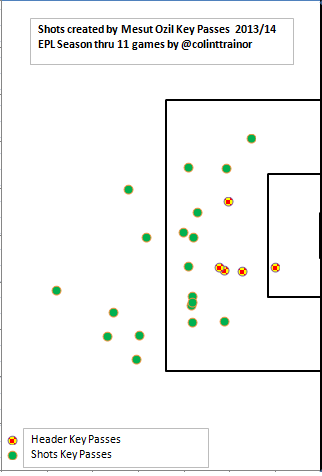
In comparison to Silva, I think that many people will be surprised at the relatively low position occupied by Mesut Ozil in this table. Like Arsenal as a whole this season, I would contend that the German has over performed in creating four Premier League goals when the quality of the chances he has created would have suggested that two goals would have been closer to what his assists deserved.
To try to illustrate why Silva and Ozil are ranked so far apart in this table it helps to see the Shot Charts for the chances they have created.
David Silva:
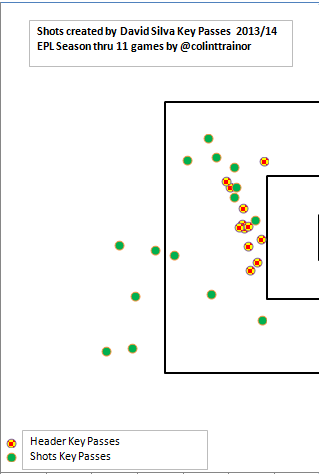
Silva has created much more of his chances closer to the 6 yard box than Ozil. It’s worth noting that our model will already have taken into account that Silva has created more headed chances, which in themselves will have a lower ExpG value than a shot from the same spot.
The name currently in third place, that of Frenchman Morgan Amalfitano is probably unexpected, but he too has excelled in producing an ExpG value of 0.38 per 90 minutes.
Our numbers would suggest that Stewart Downing has been particularly unfortunate in creating 19 chances resulting in no goals, yet our model would assign 2.50 goals to those assists. To give some context as to how volatile goals are, and why it is wrong to assess the quality of Key Passes by reference only to the number of goals scored, Downing had a probability of 6.5% of seeing none of his chances scored. This number was arrived at by running Monte Carlo simulations on the chances the West Ham man created.
Average Quality of Chances
The ExpG value can be used to get a measurement of the average quality of chance created by the players.
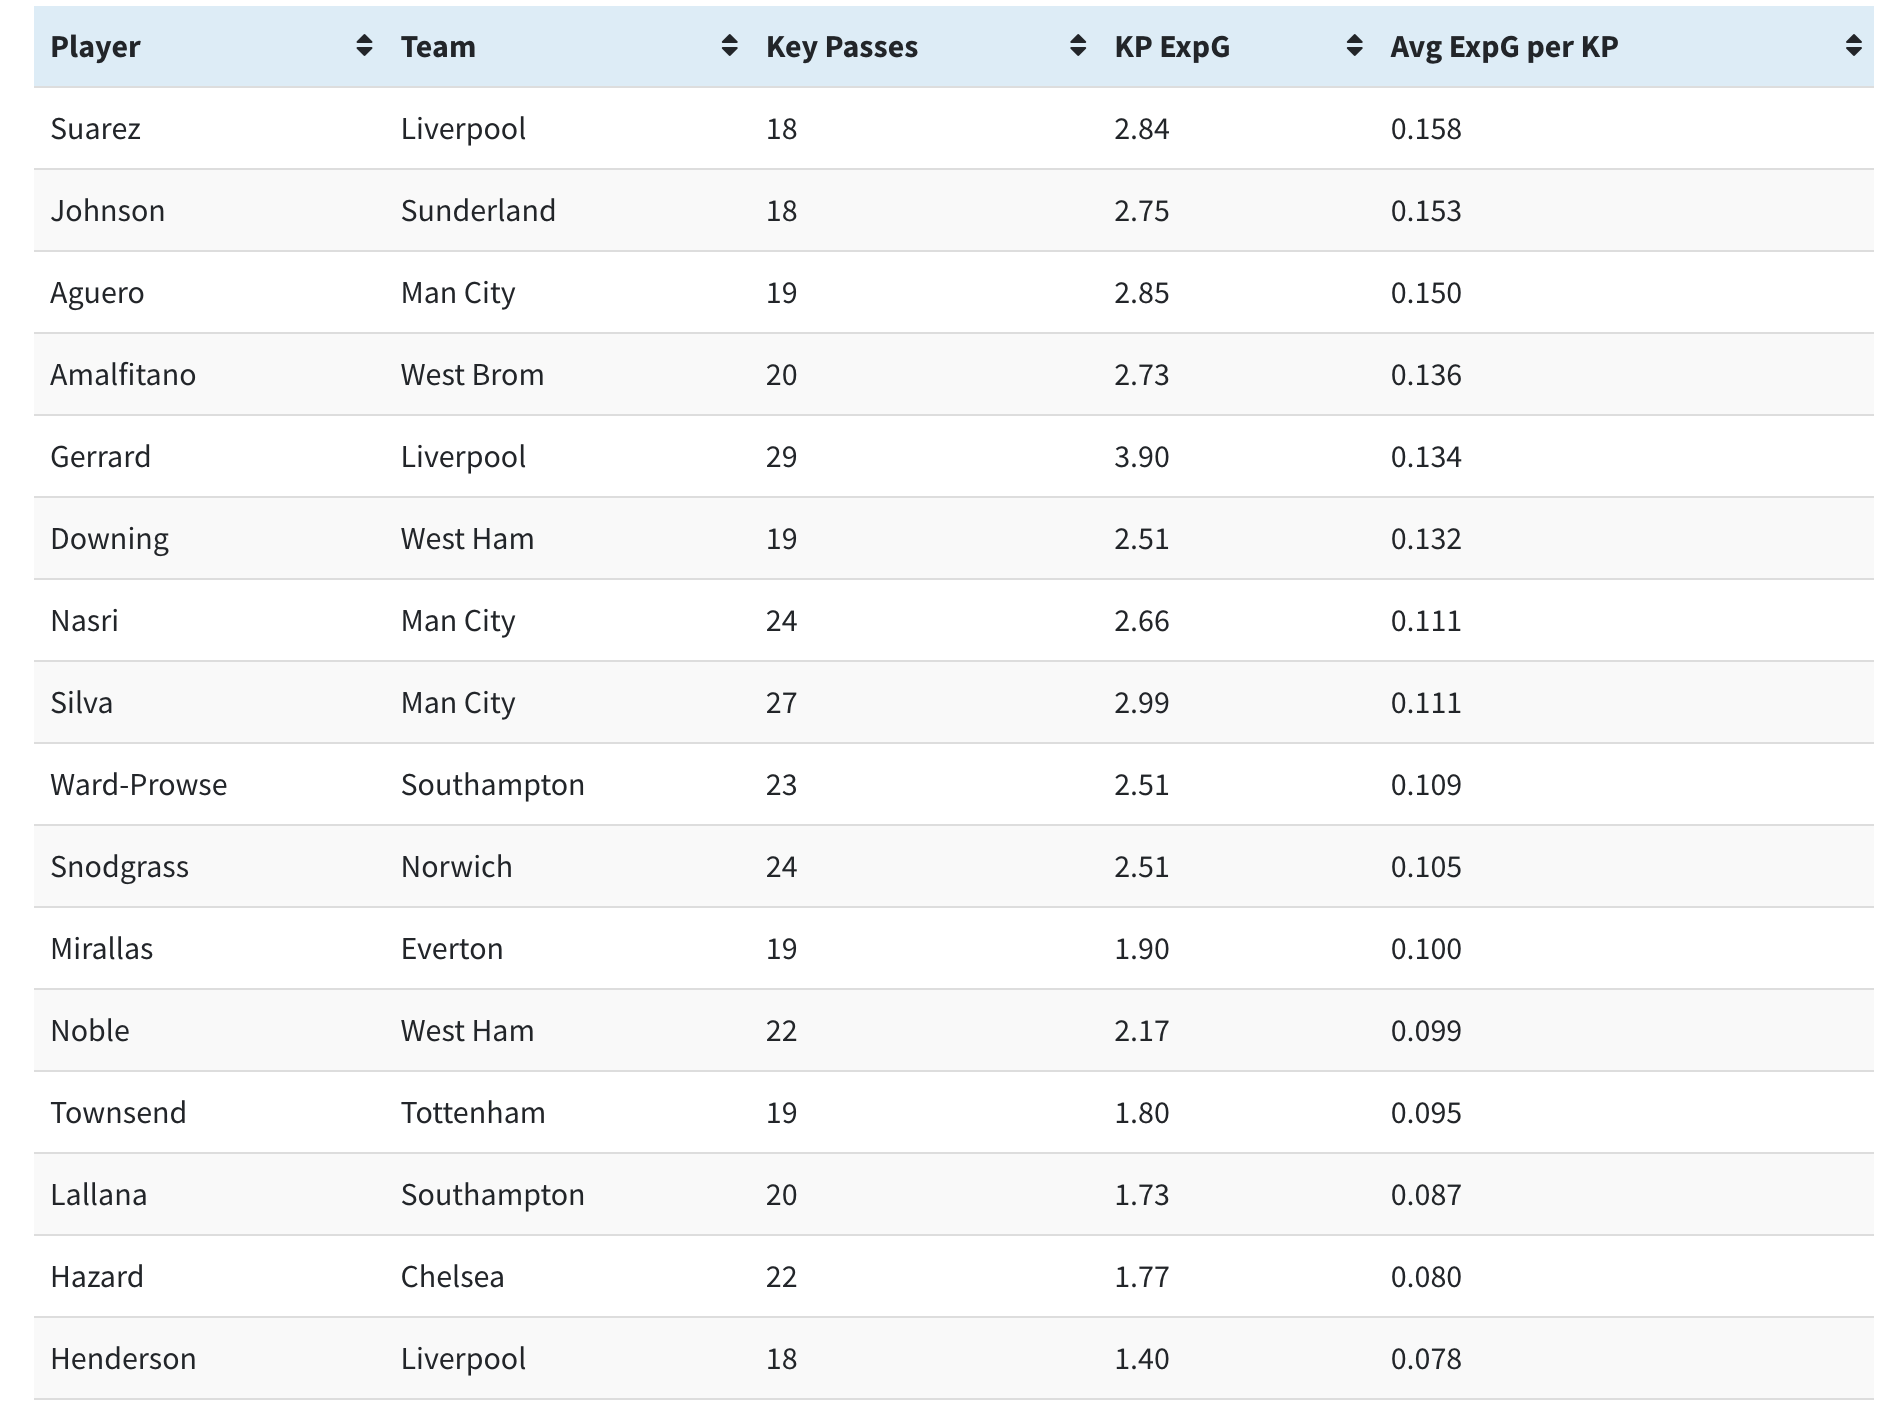
This table has been ranked in order of the average ExpG per Key Pass, or, in plain English, average chance quality. There is obviously some correlation with the previous table as Suarez sits proudly on top of this table and it may be expected that the likes of Tom Huddlestone and Moussa Sissoko are at the bottom of this table.
It may be worth noting some other patterns that emerge in this table. Generally it appears that the best chances are created by wingers or strikers, with the quality of the chances created by playmakers being inferior. Much more work would need to be undertaken to decide which method of chance creation is most efficient as one would assume that the percentage of crosses that result in a shot or header for a Key Pass to be registered is less than equivalent passes made by playmakers.
Summary
There are other ways that Key Passes can be analysed in an attempt to squeeze as much meaningful information as possible from them, indeed I have some other thoughts that I hope to get to in the next few days, but I think that the use of an ExpG metric is a great starting point.
Over a full season it will give a truer reflection as to the quality of the chances created by each player and it improves upon either looking at just total Key Passes or the number of goals that each player created. The measurement is objective and provided that the data is available it could be used for any league. No longer do we need to rely solely on gut instincts as to how creative individual players are.
