Since I started writing about players last summer, I have wanted to get better at doing data visualization. I’ve loved working with data for two decades now, but while comfortable with a database or a spreadsheet, I am D-U-M-B when it comes to anything art-y. Thankfully, there are these things called books, and people like Nathan Yau and Edward Tufte who write about the art and science of visualization.
I’m still a complete and utter novice, but time spent learning has made me just good enough to steal some pretty things and start adapting them to football.
Radar Charts
A couple of months ago, Orbinho linked a big list of data visualization award nominees. I saw it and immediately thought “Sweet! That should work for football as well.”
Ah, but how?
Most football stats are per game or per season, which makes it tougher to compare guys with different playing time…
*Does a couple of months work*
Aha!
What if we normalize most of the stats by percent or per 90? So that’s what I did.
Ballon D’or 2013
Regardless of my feelings about subjective awards (I generally loathe them, especially in football), the Ballon D’or made for an interesting set of players to talk about.
For once in my pieces though, instead of just talking about player production… we can look at them. The charts below are based off stats for the completed 2012-13 seasons. Obviously that doesn’t line up perfectly with the silly award voting, but comparing full seasons makes waaaay more sense than comparing performance over a calendar year.
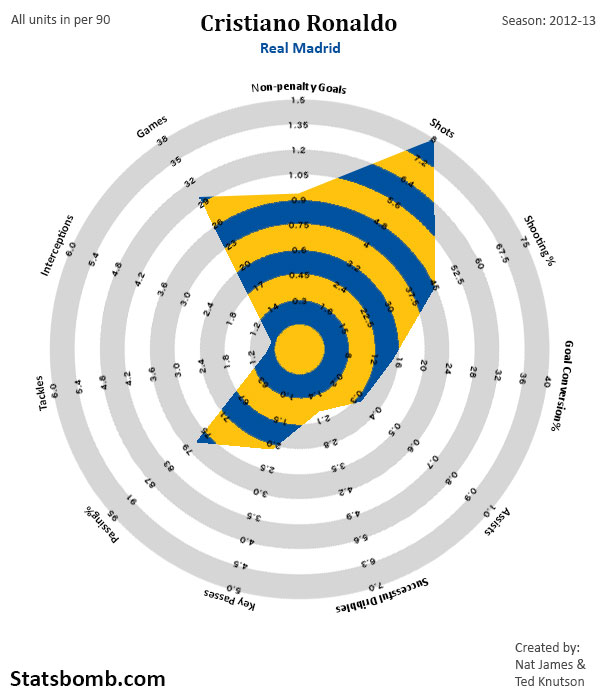
Ronaldo’s shot stats from this season are the boundary for the shots axis, meaning he has the most shots per 90 of any player in the database. In fact, of the 4.5 or so seasons of data I have access to, Ronaldo has all five of the top 5 sports in shots per 90.
I'm surprised he hasn't kicked his leg off.
Luis Suarez is capable of shooting a lot, but no one even approaches Cristiano Ronaldo. One of the things that surprised me is how low Ronaldo’s dribbling rate is, especially compared to his fellow nominees. My brain is burned with an image of Ronaldo that involves ridiculous stepovers and fast feet, but his dribbling at Madrid has never been nearly as high as what Messi and Ribery produced last season.
Additionally, that 1.88 number from last year is the lowest in the data I have, and down almost 1.5 dribbles per 90 from his 2009-10 campaign.
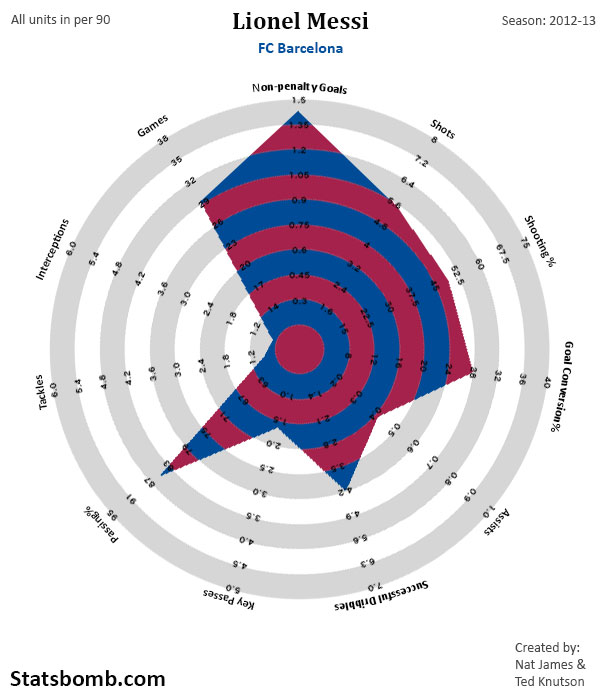
As you can see in this one, Messi’s season last year is the Non-Penalty Goals per 90 boundary. It’s the best in recent times, and possibly the highest in a European big league in the modern era. Messi creates a ton of shots, is good at putting them on target, his goal conversion is great, and he’s an outstanding dribbler.
The area covered in the scoring areas on his radar chart is massive.
From a statistical standpoint, this season was Messi's finest ever. Add the goal and assist rates together, and you see his scoring production was 1.85 per 90 minutes across an entire season, a number we may never see again. Not good enough to win the Ballon D'or though... Subjective awards are still stupid.
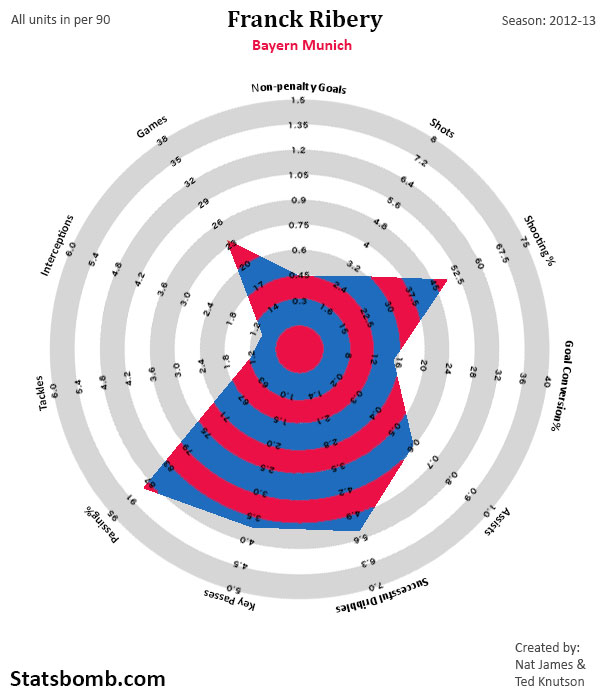
Ribery presents a fascinating contrast to the top two players. Messi and Ronaldo profile quite a bit alike, in that they are high-scoring shot monsters. Ribery is clearly something else. While his goal scoring rate is quite good for normal wide players, and his accuracy and conversion rate are also good, it’s in the passing and dribbling stats where Ribery shines.
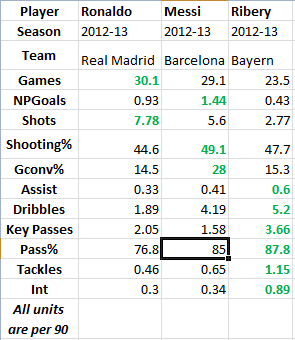
That assist rate is among the best in Europe, and both Successful Dribbles and Key Passes are as well. Ribery’s different role causes there to be completely different areas covered in the chart versus the other two. Meaningful? Maybe. Cool? Certainly. To compare and contrast, this is what the stats look like in basic table format.
Next Steps
Now that I have the template done (and huge thanks to Nat James for helping me create that), we can churn these out fairly regularly with updated data. Expect to see a snapshot or two of interesting players from each week on the basic template, either on the site or on our Twitter feed.
Another thing that I will start to explore soon are position-specific templates that help compare key stats for spots on the pitch. This basic one works reasonably well as is, especially for attackers, but there are plenty of other stats you will want to look at for defensive midfielders, fullbacks, defenders, etc, and I think we can find new templates to emphasize those.
Feel free to leave feedback on them in the comments or on Twitter. It’s taken a plenty of studying and hard work to get here, but I feel like maybe we’ve created (or more appropriately, “adapted”) a new way of looking at football stats that will be both approachable and useful for casual fans and analysts alike. If nothing else, you'll see more pretty pictures on the site. --TK