
Most everyone reading this will be aware of the Player Radars that Ted has been producing, both here and on his Twitter feed, over the last 6 months. The radars are a great way to get a feel for a player simply by using a dozen high level stats and it also allows you to get a grasp for the likely attributes of a player even if you have never seen them playing before.
How to distinguish different types of strikers?
Data can be, and I’m quite sure is being, used to help filter the number of potential forwards that a club may be interested in. The data that is easiest to gain access to is the widely published totals like number of shots and conversion rates; or other outcome orientated metrics. Of course, I am a big fan of these “counting metrics”, but I believe it is also possible to understand certain stylistic traits of players from the detail event data that Opta collects. As well as helping inform the football fan, this information could also form part of a club’s recruitment and initial selection process, thus narrowing down the potential number of acquisition targets before a scout has even personally laid eyes on the player in question.
What stylistic metrics could we use? 1 - Expected Goal values
Expected Goal values for individual players can certainly be used to tell us what type of shots players tend to take on. However, enough has been written and tweeted recently about this concept for people to have already gained an understanding of this measurement. In fact, only last night, Sander Ijstma published a neat article which showed how individual player ExpG values can be used in assessing shooting styles.
This article is not about Expected Goals, and I merely mention it here to put on record that we can certainly learn about player’s preferences from this measure.
2 - How much do the strikers create themselves?
Some of you will know that I was critical of Tottenham’s purchase of Roberto Soldado, and I said as much in a piece I wrote last August. In summary, it seemed to me that many who claimed that Soldado was worth the price Spurs paid for him was basing this assertion on his super conversion rate at Valencia. In the three seasons from 2010/11 to 12/13 the Spaniard converted at a rate in excess of 20%.
My reluctance to go along with the general consensus was that the quality of Soldado’s chances was simply off the chart - the quality of his average chance in 2012/13 was the second highest of any player in the five main European leagues. To me, this went a very long way to explaining why he was able to boast such a good conversion rate.
The first comment posted by a reader in relation to my article included the observation:
If you fully wanted to investigate the value-for-money on this deal, I think you also need to look at how often does he actually work himself into positions that are good scoring positions
That was a very valid point, and ever since then I have been thinking about how we could capture the work that a striker does himself in fashioning his chances. This concept could lend itself to a number of different types of analyses.
As well as shedding some light on how much of the chances could be attributable to the striker himself, it would also allow us to be able to objectively assign a “style” to forwards. It could even serve as proxy for how mobile and pacy, or alternatively static, a forward is. Regardless of how this information will be digested it became clear to me that this is data we should be analysing, and with the use of Opta’s most detailed event feeds we’re now in a position to look at this.
I’m going to look at this area through the lens of a new metric, Pre-Shot Dribble Distance (PSDD).
Data Rules
I included all kicked shots, but excluded headers as we wouldn’t expect a player to carry the ball prior to them having a headed effort at goal. I only included shots that followed a completed pass. So shots that came directly from turnovers, penalties or direct free kicks were excluded from this analysis. The reason for this is that these types of shots do not have an associated Pre-Shot Dribble Distance attached to them and I am interested in analysing what players do with the ball after they receive it but before they shoot.
Using Opta’s x,y co-ordinates I was able to record the distance, in metres, from where a player picked up the ball to the location where they shot from. I analysed each player for each season we have data for, and I used their median dribble distance prior to each of their shots during any given season. In this case, I felt that using the median distance would be more appropriate than the average as the latter measure could be artificially skewed by the player having one very long run with the ball. By using the median measure one or two “abnormal” values would not change the substance of the underlying Pre-Shot Dribble Distance value for each player, thus we are left we a more representative value for the "typical" Pre-Shot Dribble Distance.
Analysing Attackers
For the purposes of this analysis I am looking only at strikers, or to be more correct, shots that players took while they played as an attacker (as defined by Opta). It is intuitive that, on average, midfielders would carry the ball further than attackers prior to shooting; this will be simply a function of where they play on the pitch and where they tend to collect a pass. In the 2013/14 EPL season, Wayne Rooney had a total of 58 kicked shots at goal that were assisted with a completed pass. Of these 58 shots, he had 37 of them when listed as a midfielder by Opta, with the balance of 21 coming from his role as a striker. In this analysis, I have only used his 21 shots generated from his forward’s role.
The tendencies of players that shoot from midfield can be analysed another day.
Premier League 2013/14
To get a feel for the data let’s have a look at the players in the Premier League that had more than 20 kicked shots (with an assisting pass) as an attacker last season, sorted by median Pre-Shot Dribble Distance:
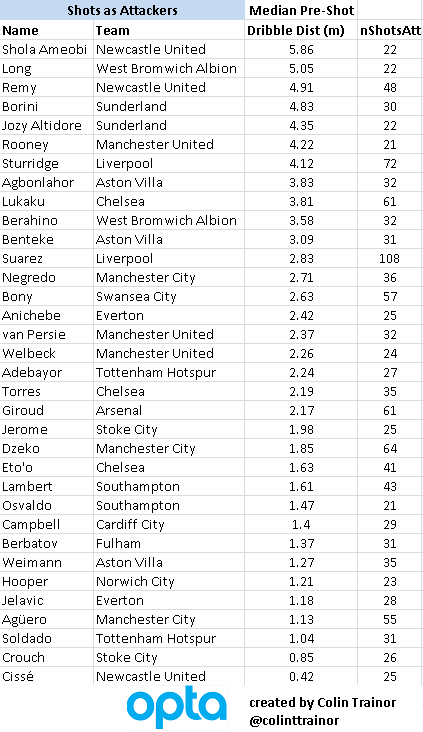
At a first glance, the general shape of the table seems to make a lot of sense to me. At the top of the pile we have the strikers that could be termed as being “mobile” or pacy, ie Shola Ameobi, Remy, Altidore, Rooney and Sturridge and at the bottom we have Crouch, Soldado, Jelavic, Hooper and Aguero. If, like me, you think that Sergio Aguero looks out of place in that very static looking company then please read on as I explain why this might be the case.
I’ve no doubt that team effects come into play here, sides that play a counter attacking style or allow their strikers to be surrounded by plenty of grass will tend to see their strikers post larger median PSDD values.
I’m not necessarily saying that Remy is a better striker than Soldado (hell maybe I am, but that’s not for this article), but these values clearly show how the two players tend to play and the work that they do themselves in fashioning their chances before they finally pull the trigger. In fact, the ability to hit a ball first time is a tremendous skill; and it is for that reason that I want to stress again that the names at the bottom of the list are not bad strikers. They just take a shot much earlier when gaining possession than the players that appear higher up the table.
OK, so anyone that has seen Remy and Soldado play wouldn’t need these PSDD values to know that they aren't a similar type of player. But by measuring the work that they do in creating their shots we have an objective way of measuring this one particular facet of their playing style. The real advantage comes when we are able to analyse players that we are not as familiar with. As well as seeing their outputs via summary stats, we are able to get a feel for tactically how the striker might fit in to a potential new team and / or role.
I think it’s worth repeating that this table, and indeed entire article, is not concerned with how good the striker is at finishing or what his conversion rate was; it’s purely a numerical way of describing how they shoot. We have many other metrics that can help us answer the qualitative output question.
Liverpool
The above table certainly reinforces the image of Liverpool playing, and striving to own, very mobile strikers that don’t need chances served up on silver platters for them to thrive. With Borini (who was on loan at Sunderland last season), Sturridge and Suarez all appearing in the top dozen places it is clear that the Anfield club value pace, power and mobility highly on their list of priorities when looking for attacking talent. It therefore shouldn’t surprise many to see than they are reportedly very close to signing Loic Remy from Newcastle as they look to replace the irreplaceable Luis Suarez. We can see that there is barely another striker in the Premier League that is as mobile or does as much of his own work after receiving the ball as does the Frenchman. It is easy to see how Remy could slot right in at Liverpool.
Sergio Aguero
Of the Premier League strikers from last year, the one that surprised me the most was Man City’s Sergio Aguero . In the table for 2013/14, only 3 strikers recorded a lower median PSDD than the Argentinian’s mark of 1.13metres. When I think of Aguero, I recall his terrific speed, low centre of gravity, his agility and ability to run with the ball. How can we reconcile that with his lowly position in this table?
I am hypothesising here, but I think that even when Aguero played last season he was seriously hampered by injuries. He started just over 50% of all Man City’s league games last season (20 starts), but this data is telling us that even we he did play he was unable to play his natural game. I’m not medically trained and have no access to Man City’s fitness data, so how can I make that assertion?
Very simply, his numbers for 2013 are totally different to any of his other seasons that I have data for (from 2010/11 onwards), as can be clearly seen in this chart below:
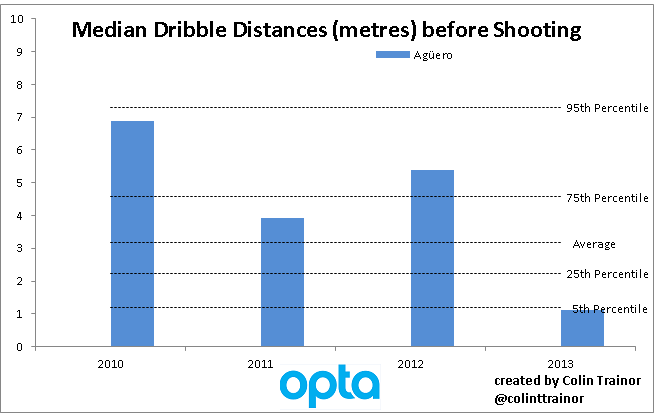
To give get some context around the median Pre-Shot Dribble Distance values for strikers I have plotted lines at various percentiles. These percentiles are based on all of the data in my dataset, ie Big 5 leagues for the last 4 seasons; which is why the percentile values does not tally with the data for just the 2013/14 Premier League table that we had seen earlier in this piece.
In two of the three previous seasons Aguero was well in excess of the 75th percentile, and appeared just below this mark in the other one. However, his median PSDD achieved last season, of just over one 1 metre actually places him in the bottom 5% of all median distances for strikers that had more than 20 shots in a season. We can see that was quite a significant and fundamental change in playing style for him, and one that I am convinced can be put down to the injuries he was carrying; specifically his hamstring injuries that seemed to hamper him for most of last season. Upon receiving the ball, Aguero was much less likely to attempt to advance it prior to shooting than he was in previous seasons and it looks like Aguero was broken in 2013/14.
A Messi Change
Another player that has had a change in playing style highlighted by this metric, albeit much more subtle than Aguero’s, over the last couple of years has been his international colleague - Lionel Messi.
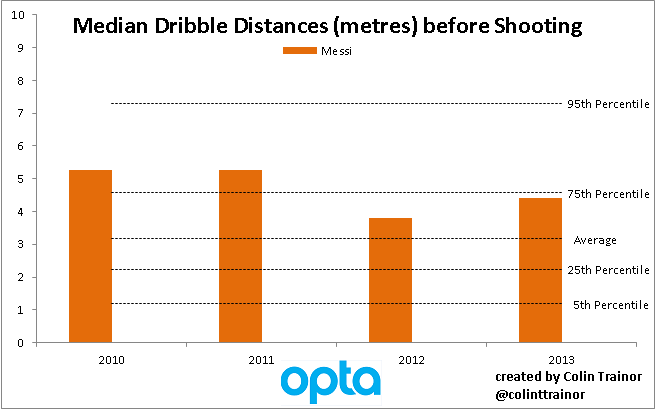
Over the last two seasons Messi is carrying the ball less distance than he did previously before shooting. As stated above, his decrease in PSDD values isn’t as marked as Aguero’s has been, but I can’t help but wonder if the slightly smaller numbers are also to do with the injuries Messi has suffered over the last 24 months. It may also be the case that ever since Pep Guardiola left Barca at the end of the 2011/12 season that Messi’s role in the team has been slightly different to the one he played previously. In either case, we now have a metric that can help us understand / visualise the type of game that a striker tends to play, including the ability to notice when a player varies or departs from a previously favoured style; either due to tactics or because the player in question is not fully fit.
Wrap up
This was only meant to be an introductory post to the concept of Pre-Shot Dribble Distances, and I’m sure I’ll be returning to this topic many times in the future. However, I’ll leave you with one more chart that I think is worth including in this first article on Pre-Shot Dribble Distances.
The highest individual PSDD in any season over the last four Premier League years was posted by Gervinho at Arsenal in 2011/12. However, it becomes apparent that that season was not a one off:
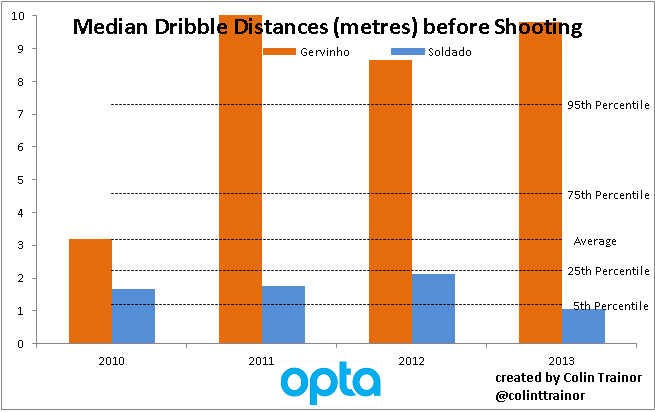
In order to keep the chart a reasonable scale I have capped the median PSDD at 10 metres per shot, but you can see that Gervinho topped that figure in 11/12. In fact, over each of the last three seasons, so covering his spells both at Arsenal and Roma, Gervinho was well above the 95th percentile for this metric. In terms of a player that is powerful and pacy, can carry the ball effectively and make a shot for himself I feel you’d need to travel a long way to find someone better than Gervinho. It seems a shame that Wenger couldn’t find a way to get the most out of the Ivorian as he certainly has a very talented skillset.
And the answer that all Spurs fans have undoubtedly been waiting for is that Soldado was not quite as static or immobile in his time at Valencia as he was last season in North London. Although, as he never made it higher than the 25th percentile in terms of Pre-Shot Dribble Distance in any of his last four seasons, I don’t think I would expect the Spaniard to operate any differently this coming season than he did last year. However, whilst his playing style is very unlikely to change, and good service is essential for him to flourish, he will almost certainly score more goals in the next campaign due to the chances he gets and the areas he operates in.