The First Annual Twelve Game Premier League Stat Review
Last year I took a dig around some stats at the twelve game point to try and quantify what Southampton were doing. They had extremely good underlying numbers at that point, to such an extent that I felt they had a good chance of a run at the top four. It didn't come to pass but by doing that piece of work, it meant I had built a database of numbers at this point in the season. It is useful as a reckoner for identifying teams that have been performing at levels that may be at historical extremes, either good or bad and also whether they have been exceeding or undershooting both metrics that indicate quality or those that are likely to regress over time.
Twelve games also takes us over the 1000 minutes point which at least allows some degree of smoothing for variable fixture strength and we have a sample that is large enough to have some confidence in conclusions drawn. Plus: it's interesting. In particular outliers are informative and taken together, the relationships between shot metrics and various conversions and save rates paint a picture of team strengths that you don't get by focusing on single metrics. The public data available for such analysis exists from season 2009-10 onwards (The Enlightened Era) which means we now have a sample of 140 12 game starts to compare and contrast with.
The Good Let's begin with a team that has shown extremely strong form at both ends of the pitch.
Man City It's kind of ironic that I'm writing this on a day in which Man City have failed to beat or even score against the league's bottom team, Aston Villa, but through twelve games, Man City have created shot numbers that peg them as an extremely dominant side.
Total Shot Ratio (TSR): 71%, 1st/140
Shot on Target Ratio (SoTR): 75%, 2nd/140
Shots For: 18.3 per game, 11th/140
Shots Against: 7.7 per game, 1st/140
Shots on Target For: 6.9 per game, 5th/140
Shots on Target Against: 2.3 per game, 2nd/140
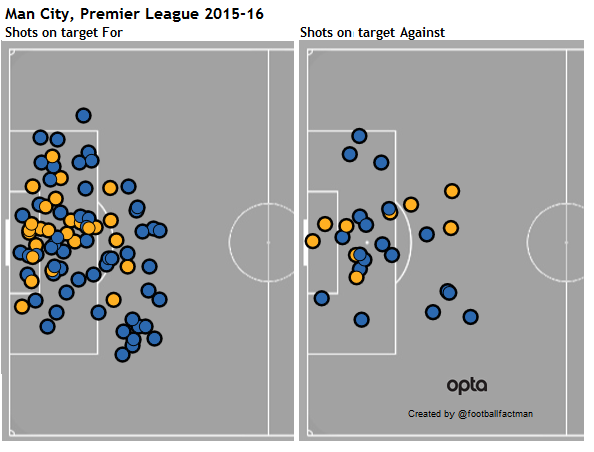 (Chart Credit: Paul Riley, yellow=goals, blue = shot on target, go check out the entire league)
Rightly favourites for the title, this looks a team with few real weaknesses; only Aguero and now Bony's fitness casting a shadow over their current form. In particular, and despite first class attacking numbers, their defense has resisted shots with remarkable effect. In only one game have they conceded over ten shots-the defeat at Tottenham- and are currently on a run of conceding only 25 shots in five games.
None of their quality here is potentially inhibited by more fluid metrics which are running happily within "normal" parameters, so it is entirely reasonable to predict that their dominance should continue. But what of Arsenal?
Arsenal
The only team that has consistently shown form anywhere near that of Man City is Arsenal. Aspects of their play, specifically on the front end have been very impressive, indeed they have currently taken one more shot than Man City.
Shots For: 18.4 per game, 10th/140
Shots +/- : 7.5 per game, 13th/140
That shots plus/minus figure is only Arsenal's 4th best on the list, which shows how often Arsenal have created solid shot numbers over these years. Indeed the strangely moderate numbers of 2013-14 that didn't eventually hinder their run to the top four, have been left far behind in the Ozil/Sanchez era. The red flag in Arsenal's numbers is in their save percentage. Arsenal recorded an extremely high save percentage throughout the second half of 2014-15 (80%) and have continued this season, in fact, they've actually increased to 83%. This is enough to rank 2nd/140 in the list and as such is likely to be unsustainable.
Arsenal's against shot numbers are nowhere near as strong as City's yet Cech has managed to fend them off at an extremely high rate. Whilst he is usually regarded as one of the better keepers in the league, it is not possible to be confident that Arsenal will continue to resist their opponents shots at this level going forward. As a bare minimum, one would expect three percent to come off that total as the season draws on, and likely more. This potential cooling off is likely to impact their results at some point in the not too distant future.
The amount of their opponents shots are hitting the target as a percentage of total shots is also high (40%, 5th/140) and the pure rate in which their opponents are getting shots on target is far more in the realm of average too: 4.3/game compared to City's 2.3/game. As we can see in the chart the dominance isn't as stark:
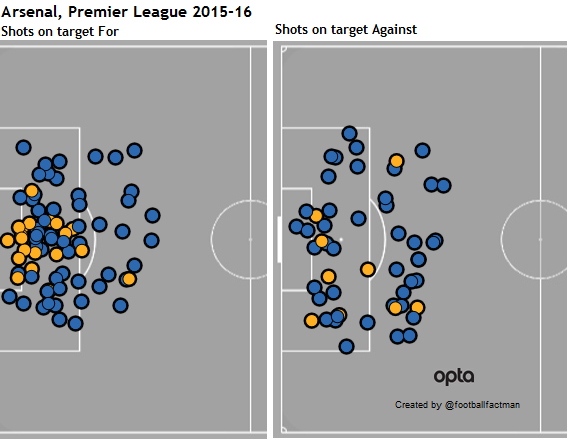
As an aside, there is a fascinating gap between a line through the penalty spot and outside the area in which they are conceding very few accurate shots. I would presume that this means they hold a line on the edge of the box quite effectively but a visit to the video booth would be required to ascertain if this is borne out.
Also Good
Tottenham and Southampton are both running strong shooting numbers so far. Both have a shot on target ratio of 65% which ranks them joint 10th/140. Where they differ is at each end: Southampton's repression of opposition shots on target is very similar to the good total they recorded last year (2.8 to 2.9) whereas Tottenham have taken off on the front end here and are only just behind Arsenal with 6.3 on target shots per game (enough for 11th/140).
Southampton's problem is that they are struggling with a low save percentage and this is undermining these very solid shooting numbers. They look well set to maintain a top seven challenge once more and with a slightly deeper squad and a smidgen of reversion in this metric, could go well under the radar in attempting to improve on last season's final position.
Interesting for Tottenham is their +10 goal difference. Until Southampton broke the run last season, the last 25 teams with a plus ten goal difference after twelve games had all made the top four, stretching back to Portsmouth in 2007-08. One note of caution is in their shot ratios. Objective Footy noted that maintaining a season to season leap of above ten percentage points as they currently are is extremely rare:
Almost unheard of to post double digit increase/decrease. See if Spurs can hold their 15.7% point SoTR increase (50% in 14/15 > 65.7% 15/16)
— ObjectiveFootball (@ObjectiveFooty) November 5, 2015
Man Utd have a defense almost as limiting as City's- 8.8 shots conceded per game (4th/140)- and given their truly sub-par attacking figures, must be hoping that this will be enough to power their charge. The only praise I can give Liverpool is also defensive, they are repressing their opponents shots on target at a solid level (3.3/game, 13th/140).
Running hot
There is little I can add here to Joel Salamon's video deconstructing West Ham. He was right: they were liable to revert to a lower level of scoring and have already fallen from scoring 50% of their shots on target to *just* 44%, a mark which is still high enough to register as 2nd/140 in our chart. There is plenty of room for them to fall further here but none of their underlying shooting numbers imply anything but an average side being powered by a temporary positive fluctuation in conversion.
The Bad
There are likely more than three "bad" teams in the league this year but it's hard to not be drawn by the three teams that have provided distinctly unimpressive shooting numbers thus far: Sunderland, Newcastle and Aston Villa. Each of these teams is running a big shot or on target deficit, to a level that pegs them as distinctly bad. Here we see Sunderland's on target inadequacy (7th/140 worst SoTR; ~tied with Villa):
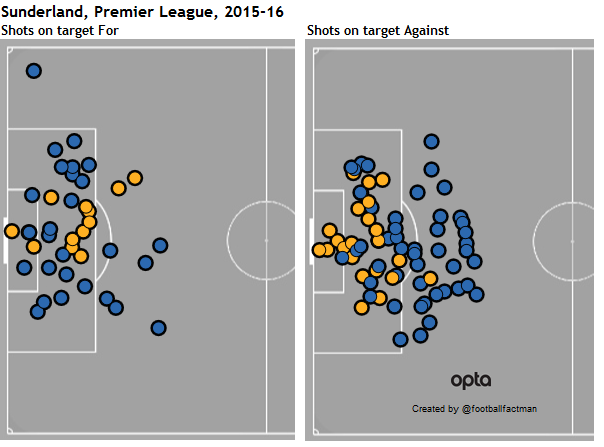
However, in terms of just raw shots six teams are milling around the historically bad ten per game mark, the aforementioned three, Man Utd, West Brom and Stoke. I think it's possible to find a degree of understanding towards the ghosts of Pulis past and present creating little, although Stoke are a potentially interesting case of underperformance here, but for a team that has spent as widely and freely as Man Utd to be running an attack that challenges league minimums for shot creation is verging on the criminal.
On the other end, three teams are currently exceeding the fabled "Knutson line" of 16 shots conceded per game, often a big hint towards a battle against relegation: our pals in the North East and Crystal Palace. But Palace are doing well aren't they? Well, the opposition conversion rate of ~6% is 2nd/140, so extremely low and is currently helping them resist.
Newcastle have the distinction of having created the two least proficient shot games in the league this year; their ten man, one shot salvo against a then rampant Arsenal and this weekend the miracle two shot 1-0 victory at Bournemouth. Only Remi Garde's Villa debut (three shots) prevents them from rounding out a dismal top three here.
Running cold
Over the early years of advanced public data, Wigan, managed by Roberto Martinez repeatedly underachieved against their numbers, struggled yet somehow survived. Dismal save percentages and rates of scoring were commonplace and as a method of creating success, they seemed to exist as a yin to Tony Pulis' yang. This season, we have a new contender.
Bournemouth
It's easy to feel sorry for Bournemouth. Not only have they been plagued by injuries dreamed up by the devil, but despite Heurelho Gomes' recent efforts to get noticed at Watford, they have been suffering severely from "clown keeper syndrome". The knock on effect from this is despite very impressive shots against numbers of 10.1 per game (12th/140!), where the Lord giveth, he also taketh away: a save percentage of 47%- the lowest on record- has thoroughly skewered them:
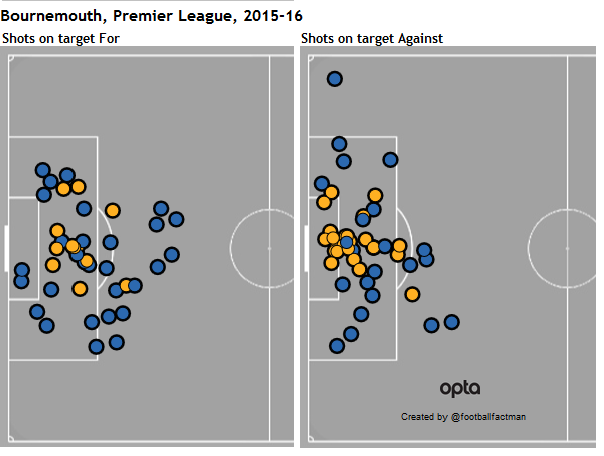
We can see just how many of their goals conceded have come from ideal shooting positions and they are currently conceding 21% of all shots they face, around double league average and for the technically minded among you, nearly four standard deviations away. Blackburn 2011-12 bottom out the full season numbers with save percentage of 59%, so on the positive side there is a huge room for reversion and it hasn't relegated them yet.
Final Quick Notes
- Chelsea's main problem is in the rate in which their opponents are getting shots on target: 43%, 1st/140, and the resulting concession of goals. This implies they are conceding good quality chances but is prime for reverting to a lower level. Beyond that their underlying numbers are merely very bad by their own standards.
- Man Utd, West Ham and Everton are all running high PDOs, Liverpool, Bournemouth and Norwich are notably low.
- Sunderland and Villa's current points totals are very low. In this 6 season sample only QPR 2012-13 (4 pts) are lower.
- The difference in which the rate Southampton create shots on target per shot and prevent the opposition from doing so has them ranked 2nd/140. The only team more effective in the sample? Southampton 2014-15. Maybe Koeman's system has hit on something here?
- Leicester's 20 goals conceded is huge for a top 4 residing team, the last club to do the same at this point was Man Utd 2001-02, and they promptly lost their next three games. Otherwise, their goals per shot on target rate is at 40%, very high- but not West Ham high. Their platform seems shaky, although 25 points after 12 games usually indicates a top seven finish and 20 points or more pretty much guarantees top half.
Thanks for reading! Find me on twitter @jair1970