
In a sport where one goal being scored is the most common result, luck is undeniably going to be a huge factor in influencing results. There are a few different ways of looking into how much look is involved in football. PDO is widely used in the football analytics community to determine whether an individual team is over or under performing by looking at how frequently shots on target are being scored/saved. I'm going to look into a method that was suggested by Tom Tango that has been adapted to work out how much variance you would expect in a completely random league, and how much variance actually occurs. I'm going to follow on from analysis by Julian Ryan who wrote this piece on Harvard Sports Analysis.
This technique has been used before by James Grayson and Martin Eastwood in order to find the amount of luck involved in win% for Premier League and La Liga seasons. Both Martin and James found that the % of skill in points for a given season is about 60-65%. Instead of looking into the variance of win%, I'm going to venture into the variance in scoring and conceding goals and see if there's much or a difference between win% and goalscoring in the Premier League.
Calculating skill%
slightly maths-y/technical bit coming up so if you want to skip to the conclusions be my guest.
To figure out how much the variation in teams' results is due to skill we can do the following calculation:
Observed variance = Variance due to skill + Variance due to luck
Where variance due to luck is the amount of variance we would expect if all teams were equal and games were played out at random.
We know due to various studies that goals follow a poisson distribution and we can therefore model the number of goals scored this way.
Let's see how we can model our luck distribution.
The variance of a poisson distribution is equal to the mean of the distribution. The mean/average number of goals for an EPL team in a season is 50.2. Let's assume that for each game our "luck team" will expect to score (50.2/38) = 1.32 goals.
if xG1 is the expected number of goals for a team in game 1, and xG2 expected number of goals in game 2 etc. and we assume the expected number of goals in each game is independent, the following formula holds:
Var(xG1 + xG2 + xG3 + ...) = Var(xG1) + Var(xG2) + Var(xG3) + ...
Since the expected number of goals in our "luck distribution" is the same for each game, and we are assuming each game is independent, we can simply sum up the expected number of goals for each game to find our total variance. So:
(50.2 / 38) * 38 = 50.2
which would be the variance of our luck distribution. For Goal Difference we can use the variance formula again to see that
Var(GF + GA) = Var(GF) + Var(GA)
Therefore to get our GD variance for our luck distribution we can just double the variance we get for GF or GA.
We can calculate total observed variance from the premier league table using using the usual formula for variance, depending on whether we're using a sample or the population. We're going to be calculating skill% where: Skill% = 1 - (Variance of our luck distribution/Total observed Variance)
Results
Below is the distribution of skill% for goals for, goals against and goal difference. Data is from the past 15 Premier League seasons.
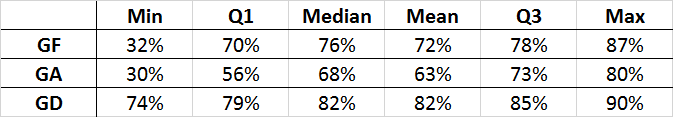
From season to season the amount of variation explained due to skill can vary significantly. On average though, a teams goal difference is the measure that contains the most "skill" and goals conceded has the largest amount of "luck".
If you look at the minimum values of skill% you can see that spread of GF can be pretty random over a season and the same with GA. However, it's very unlikely that there'll be no "noticeable skill" in both measures, as GD skill% is at least 74% for all seasons.
In 11 of the 15 years GF had a higher skill% than goals conceded and only once did it have a skill% <50%, 2003/04 Arsenal's Invincibles season.
Overall we can take all 300 teams together and then figure out a better estimate of the "true skill%". For each measure we get the following:
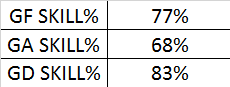
So the amount of variance in goals scored due to luck in a season is slightly under 25%, for goals against it's just under a third, and for goal difference luck makes up about one sixth of the total observed variation.
This means you would expect defence to be a less repeatable skill than offence, since more of the "variance from the mean" of a teams goals conceded is due to luck. Knowing this could be useful in prediction, as since goalscoring contains more skill it implies it should be weighted higher when forecasting results.
One thing I noticed is that GF has a noticeably higher skill% than points does over a season, I think there are three possible conclusions from this:
- Scoring goals does actually contain less "luck" than accumulating points.
- The poisson model doesn't fit particularly well for number of goals scored, and the variance of goals expected due to luck is much higher. There is a noticeable covariance between the rate at which two teams score so this could potentially be affecting our results slightly. Although I'd like to think that the poisson model is going to be pretty close.
- The skill% Martin and James got were slightly too low. They suggested themselves that these figures were probably lower bounds, since considering home advantage and other effects could cause the percentage to rise. I did a quick check myself, using my data and home win% as 60% and got a skill% of 68%.
In conclusion having a good goal difference contains less luck that having a good goalscoring record, which in turn contains less luck that having a good defensive record. Pretty much as expected but it's nice to confirm and quantify intuition.
Eventually I hope to run this analysis on leagues of differing quality, to figure out whether goalscoring consistently contains more skill than winning, even in the lower leagues.