What is a radar?
It’s a way of visualizing a large number of stats at one time. In our case, the radars specifically deal with player stats. Some people also call them spider charts or graphs because they can look like they make a spider web.
Why bother creating them? What’s wrong with tables? Or bar charts?
Hrm, let’s deal with the last questions first. There is nothing is wrong with tables of numbers. My brain loves them, and so do many others.
However, you have to admit that tables of numbers are a little boring. Bar charts are better, but they kind of fall apart when trying to compare many attributes at the same time. Radars allow exactly that.
Why bother creating them? That one is complicated. Why bother making infographics or doing data visualization at all? The answer is probably at least a book long, but the quick response is because people like to look at stats presented in this way far more than they like to look at a set of numbers. Radars invite you to engage with them. They create shapes that brains want to process. People have real reactions, and once you get used to what they display and how they display it, you can interpret them much faster than if you had to do the exact same analysis with a table of numbers.
Many of the shapes created correspond to “types” of players, at least when it comes to statistical output. Pacey, dribbling winger. Deeplying playmaker. Shot monster center forward. Starfish of futility.
There’s a lot more methodology chat in the various articles I have written about on StatsBomb, but I need to explain one very quick thing before I move on to player type shapes and examples.
Radar boundaries represent the top 5% and bottom 5% of all statistical production by players in that position across 5 leagues (EPL, Bundesliga, La Liga, Serie A, and Ligue 1) and 5 seasons of data. In stat-y terms, the cut-offs are at two standard deviations of statistical production.
In non-stat-y terms, Lionel Messi made EVERYONE look terrible. I know, that doesn’t sound that bad because it’s true, but trust me, the newer way the templates are constructed is better.
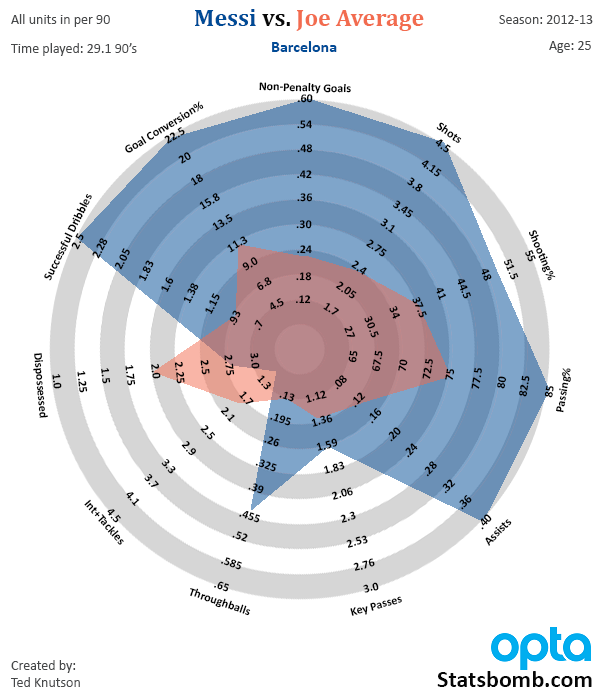
The design for these was taken from Ramimo's 2013 NBA All-Star poster. I thought it would be really interesting to apply this to football, and then through testing, became irritated by what Messi made everyone else look like if I just used pure stats output. That's when I added the standard deviations idea, and started playing with different positional templates.
QUICK NOTES:
- The only thing these represent is statistical output.
- If you put players in different systems, it may change their output.
- If you put them in different positions, it almost certainly WILL change their output.
- Age will also change statistical output.
- In short, these are a tool to help evaluate players. Like any tool, they have strengths and weaknesses. In general, I have found it much easier to evaluate players WITH this information than without it.
Explaining Bits and Bobs
![]()
This means that all the non-percentage stats in this are normalized for 90 minutes played. The reason you do this is to correct for the fact that some players don’t always play 90 minutes. Players that frequently get subbed on or off will inherently look worse if you look at per game stats than per 90 minutes played.
![]()
This is the age the player would be at the end of the season. We will change this soon to season age + birthday.
![]()
Why use non-penalty goals? Because penalties are converted at a 75-78% rate almost regardless of who takes them. They are a different skill to scoring goals that are not penalties (some teams have even had goalkeepers as their lead penalty takers), and so we strip them out of the scoring numbers.
DRAWING penalties is a great skill (and will be added to assist stats over time). Converting penalties is a very common one.
Shooting%
How many shots were on target out of ALL shots that a player has taken. This includes those that were blocked.
Key Passes
Passes that set up a teammate to take a shot. These are highly correlated with assists, which are passes to teammates who score a goal quickly after. (Note: This is the same stat as Chances Created. Somewhere along the way Opta made Key Passes only mean passes that lead to shots that are NOT goals and CC is all. Which is weird.)
Through Balls
Opta definition: a pass splitting the defence for a team-mate to run on to. Why do we care? These types of passes are generally considered the single type of passes most likely to score a goal.
Scoring Contribution
Combined non-penalty goals and assists per 90 minutes.
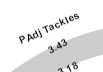
PAdj stands for “possession adjusted” stats. The reason why we do this is because it normalizes defensive stats for opportunity. Think about it this way: If your teammates always have the ball, then you can’t make any defensive actions, and you would look worse in this statistic compared to a Tony Pulis-style team that sits deep and constantly defends.
When adjusted for possession, tackles and interception output becomes moderately correlated with shots conceded and goals against, as opposed to having no correlation without the adjustment. In short, it’s an imperfect adjustment, but much better than not having the adjustment at all.
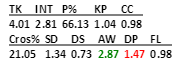
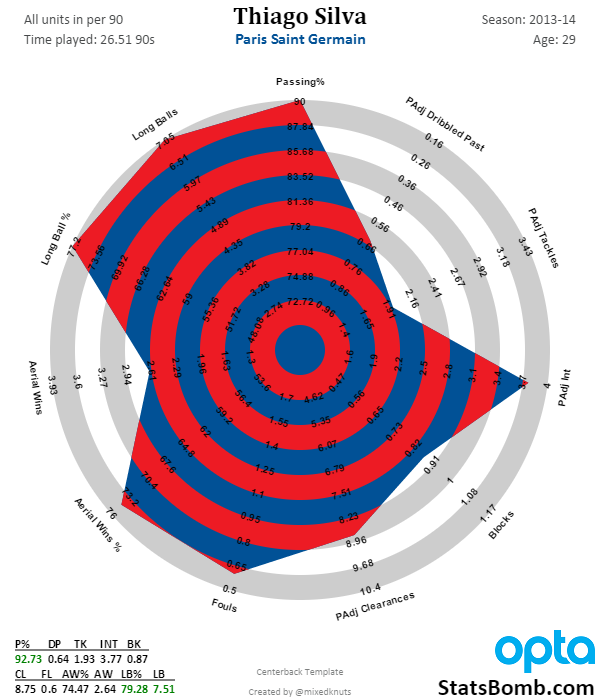
In the bottom left of every radar is the actual statistical output in numbers for each spoke of the radar. Numbers in green are in the Top 5% of output in that stat for the player population and numbers in red are the Bottom 5%.
Forwards + Attacking Midfielder Shapes
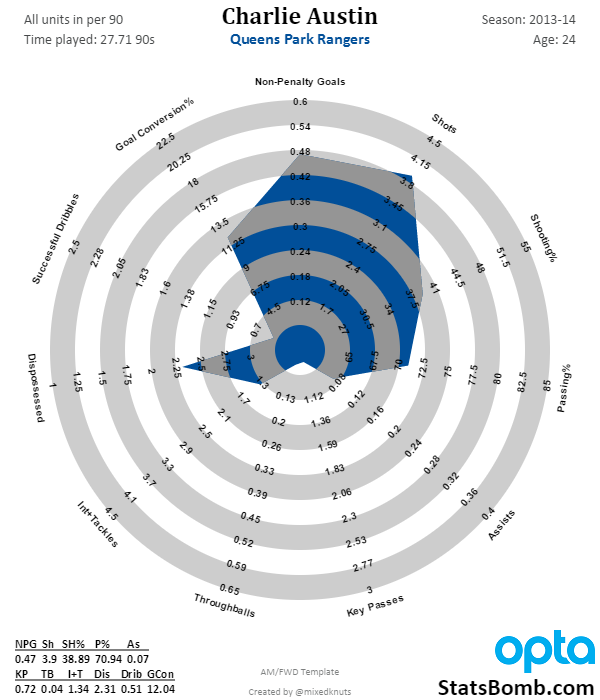
Pure Goalscorer
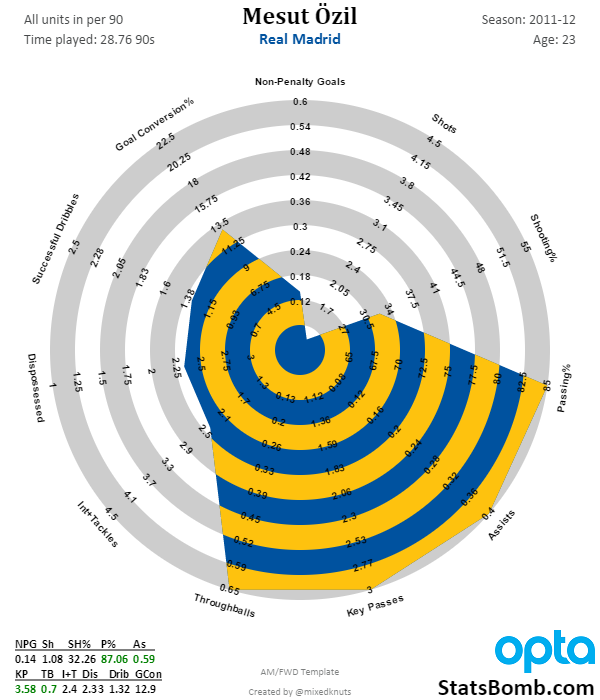
Elite Creative passer
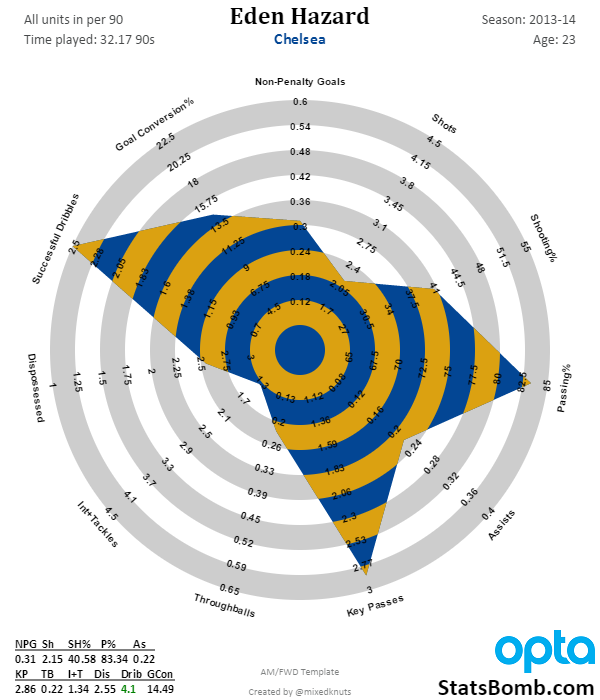
Wide, Dribbling Playmaker
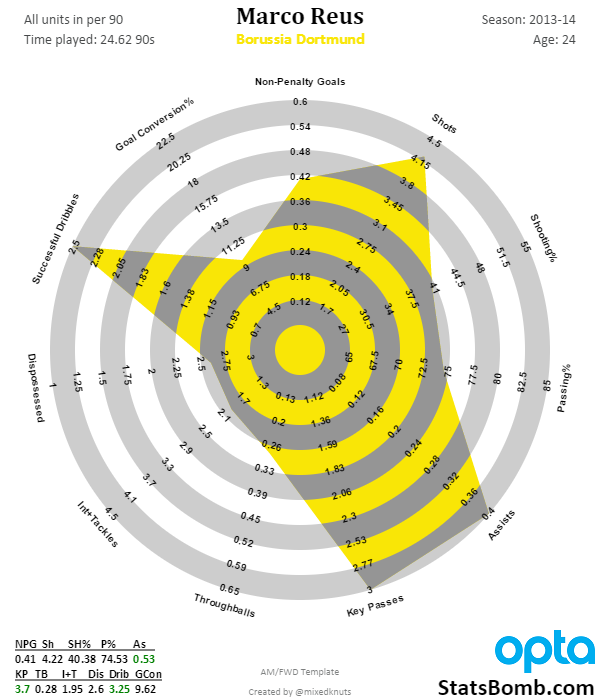
All Around Super Forward
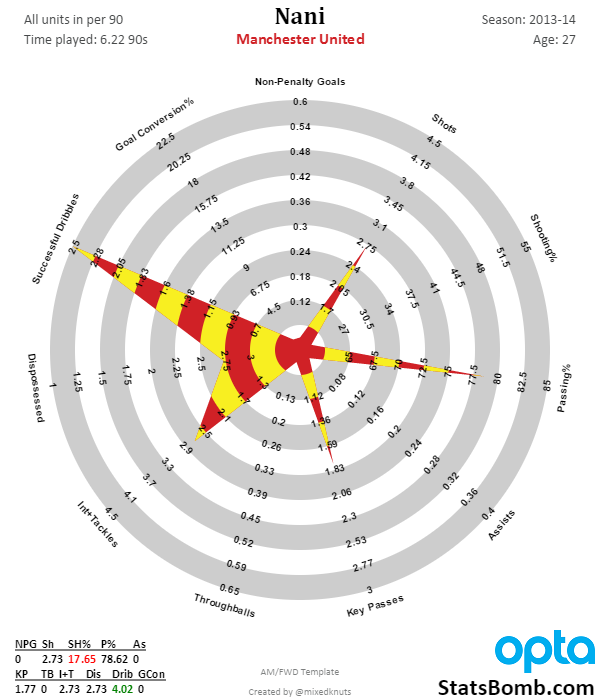
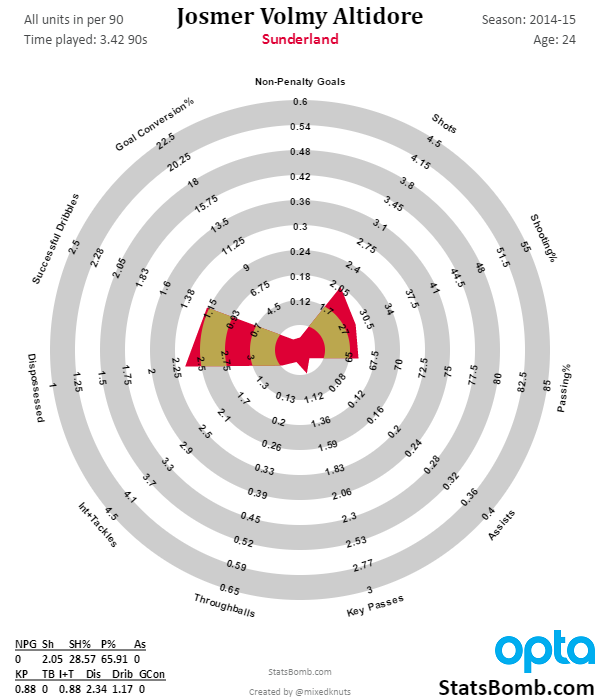
Starfish of Futility
Bowtie of Sadness
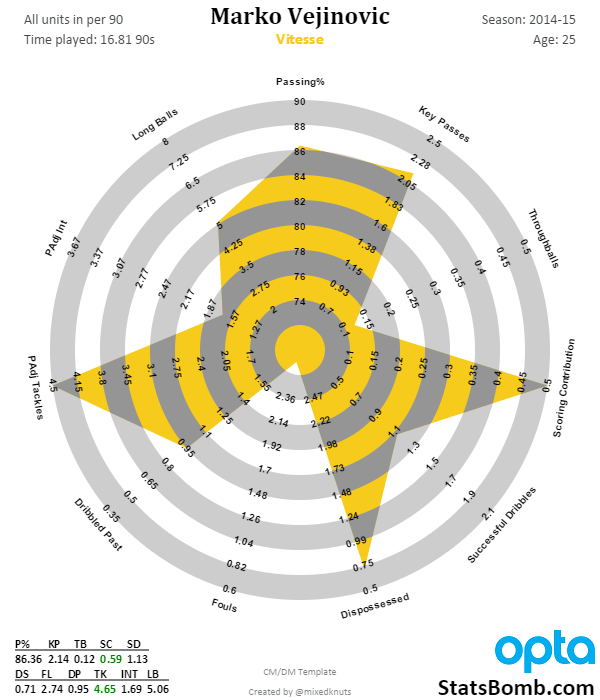
Central and Defensive Midfielders
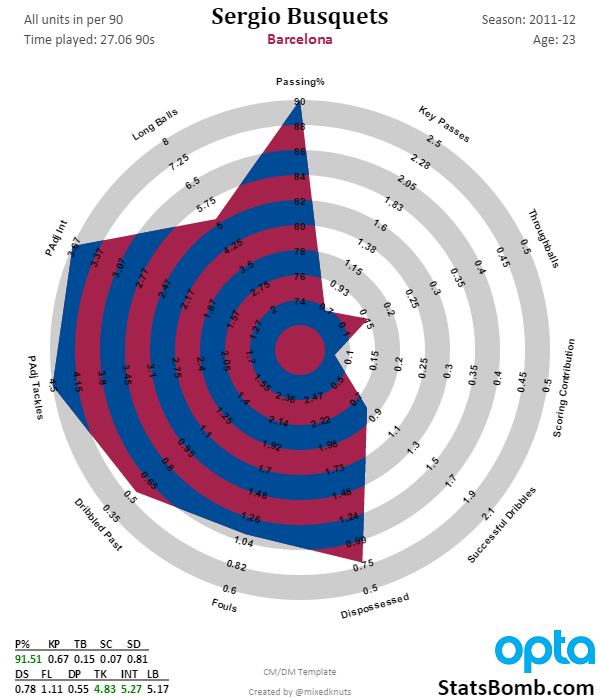
Pure DM
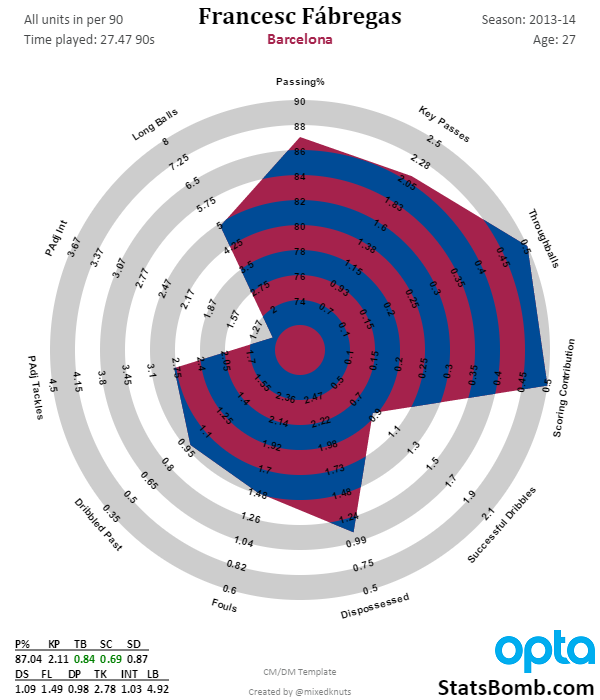
Heavy Attacking CM
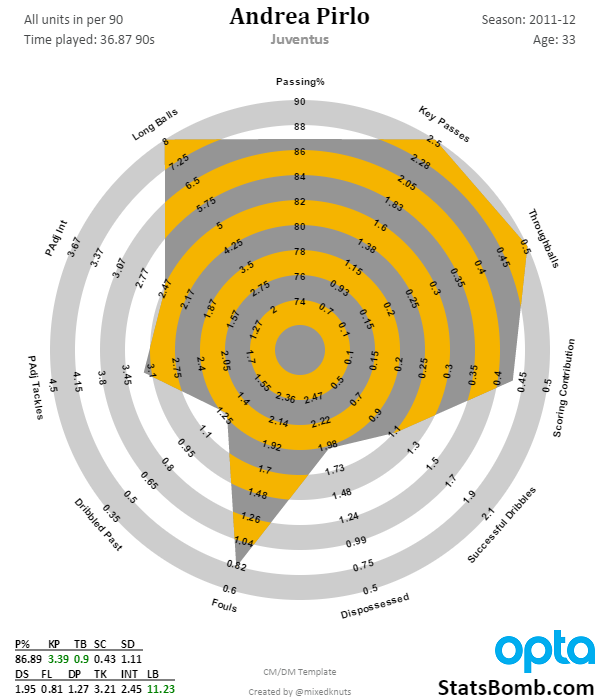
Deep-lying Playmaker
General All Around CM
Fullbacks
Defensive
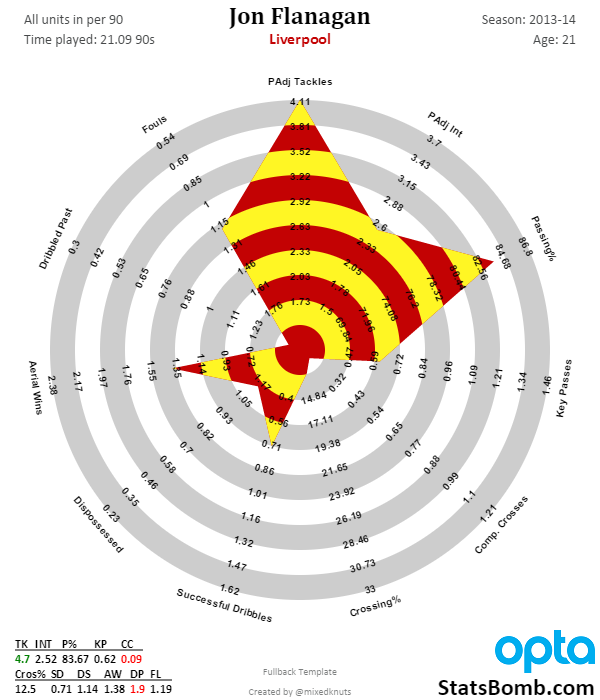
Attacking
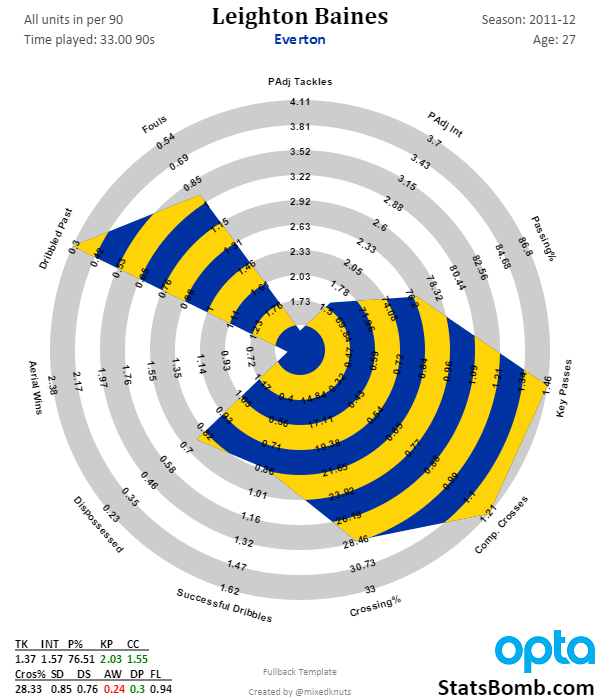
All Around
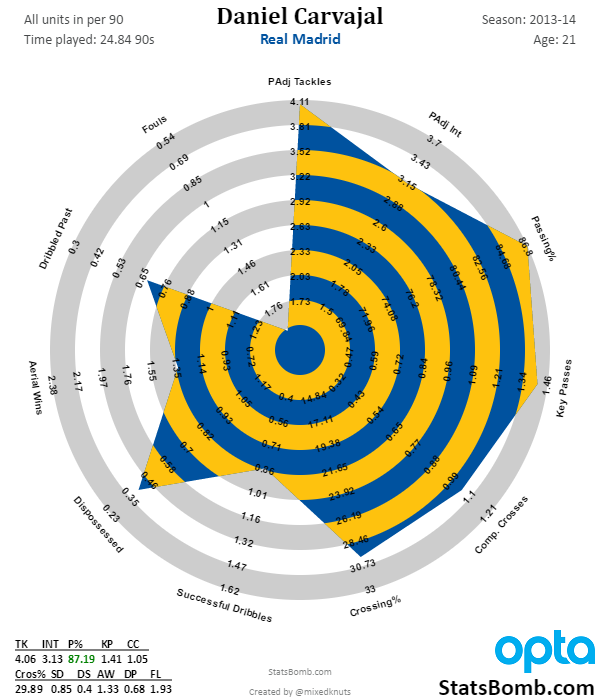
I broke down fullbacks in detail here.
Center Backs
These were developed later, and to be perfectly honest, they are less valid overall than the other positional templates. I knew this ahead of time, but legendary Scotland, Everton, and Rangers player David Weir - who is also a centerback - asked me to take a swipe at creating these and I couldn't say no. They give you a sense of how a centerback plays, but become tricky beyond that.
I do know that Thiago Silva is pretty fantastic, though.
--Ted Knutson
mixedknuts@gmail.com