The Passing Motifs methodology is something I’ve been working for a couple of months now, and it has left pretty satisfying results convincingly representing team and player passing style. I got the original idea from an article pre-print on the arXiv titled “Searching for a Unique Style in Soccer” by Laszlo Gyarmati, Haewoon Kwak and Pablo Rodriguez. These guys do research for Spanish telecommunications giant Telefonica and took a slight detour into football analytics by applying a mathematical concept from graph theory which they apply to communications networks, basically to prove the popular point that Barcelona have a pretty unique passing network. Since then, I have substantially modified their original idea and have obtained a pretty cool methodology of my own.
Here’s how it works:
The basic idea is to break up passing sequences into 3-pass long subsequences (usually overlapping) where the identity of the node is relaxed. If you’re not used to mathematical jargon this might sound confusing, but it’s pretty simple to get your mind around:
There are 5 possible 3-pass long motifs; identified by their acronyms:
- ABAB
- ABAC
- ABCA
- ABCB
- ABCD
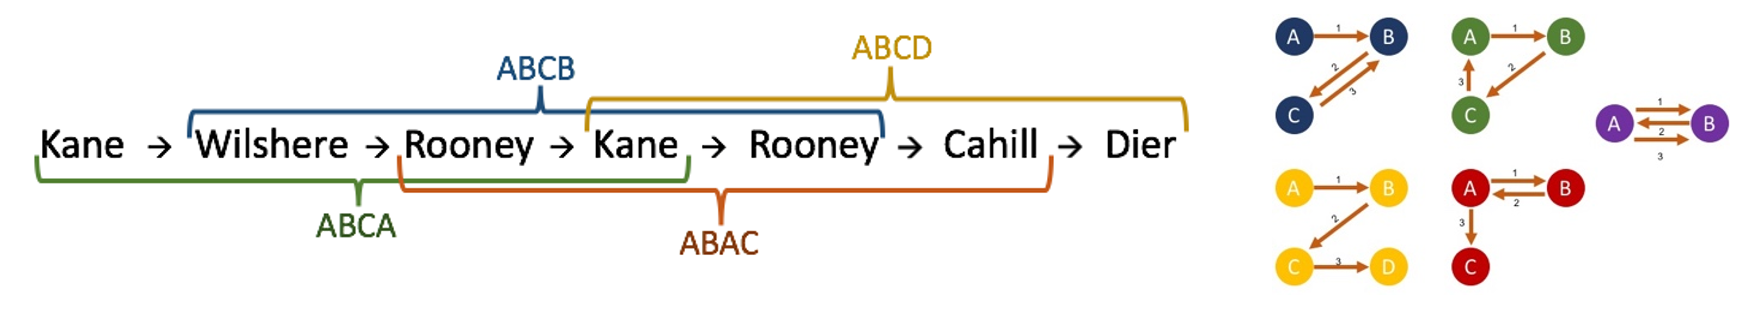
The process of identifying the passing motifs is simply taking a passing sequence, breaking it up into 3-pass subsequences and looking which motif they fit into. The key concept is that at first we are not interested in the particular player performing the passes, simply the flow of passes amongst them. A sequence Kroos – Modric – Bale – Kroos and a sequence Ronaldo – Kroos – Benzema – Ronaldo are simply two separate instances of ABCA.
At the end, we are left with a counter for each of the 5 motifs for each team in each match we have the necessary data for. Simple enough. So how do we use this to identify passing style?
Team Passing Style:
The original authors’ reasoning is that by understanding the motifs’ distribution for different teams, inherent information about a team’s playing style will become apparent. It seems like a reasonable intuition, if we consider for example that ABCD is a direct build-up passing sequence involving 4 different players, while ABAB most likely reveals a patient build up where 2 players give the ball back and forth in the style we usually attribute to Barcelona or Bayern Munich.
However, rather than looking at the raw numbers of how many times each team performed a certain motif, I found it more interesting to look at the relative frequencies. That is to say, for a certain match I would break down each team’s distribution of motifs into something like 13% ABAB, 22% ABAC, 30% ABCA, etc., rather than looking at the actual number of times the motif was performed. This is interesting because it should represent something like ‘intent’. When you have the ball, what do you intend to do with it. If we focus on absolute numbers rather than relative frequencies, then high possession teams like Barcelona or Arsenal would always come up as being unique, something that we all already know and don’t need this methodology to tell us.
By taking each team’s relative frequencies for each motif and averaging over an entire season, I obtained a 5-dimensional vector representing each team over the course of a season. Below is the hierarchical clustering dendrogram for this methodology using data from the 2014-2015 and 2015-16 Premier League seasons respectively.
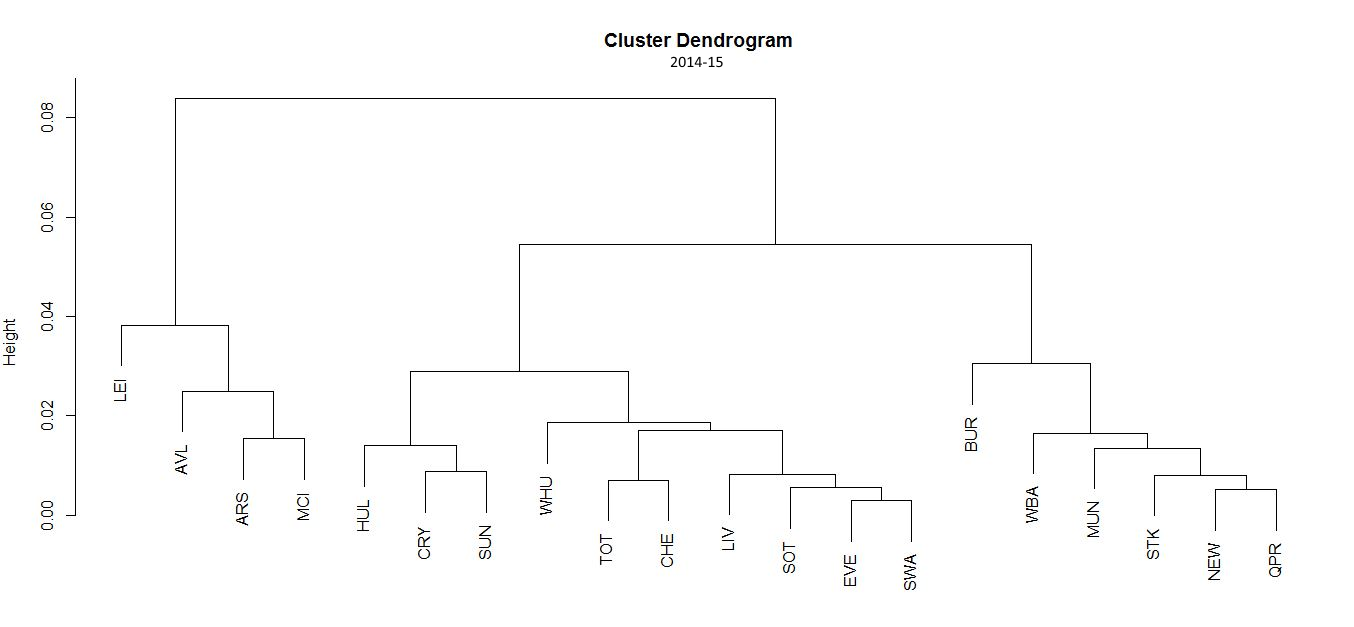
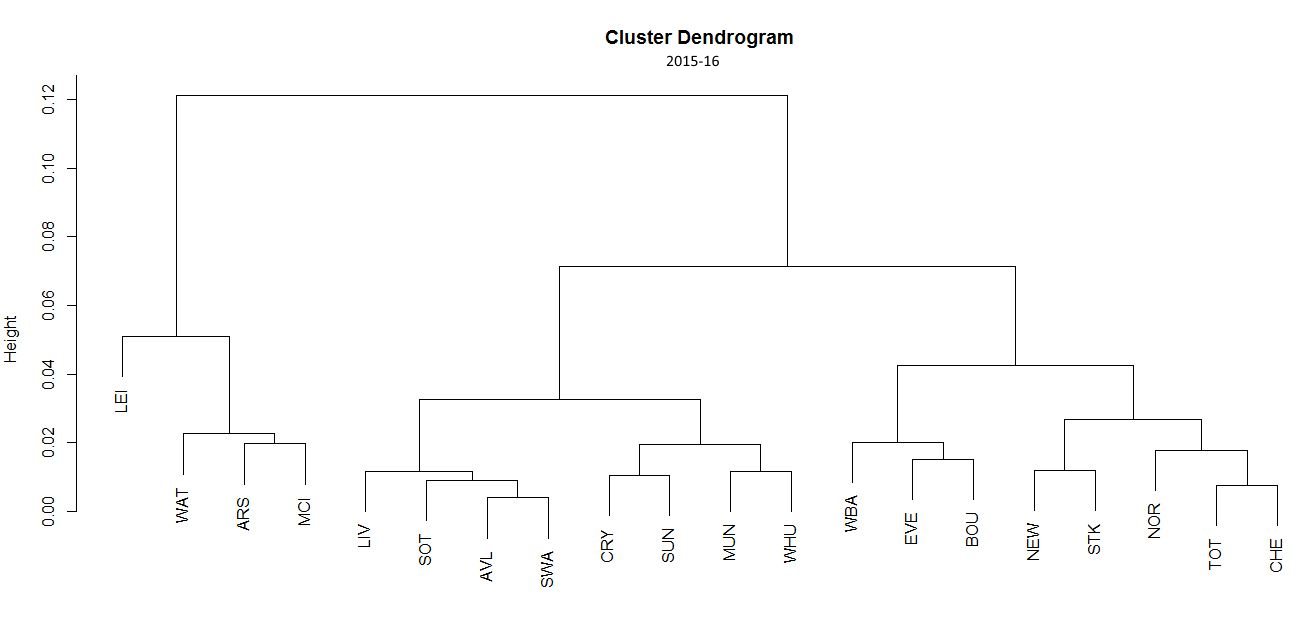
There are several interesting things to point out. First of all, 2015-16 title-winning Leicester has the most distinctive motif frequencies distribution; and forms a subgroup with the Premier League’s passing powerhouses Arsenal and Manchester City. Not only this, but this unique identity of Leicester’s motif distribution was also present for the 2014-15 season in which they went on an impressive run at the end to avoid relegation. However, nobody could have foreseen their exploits of the following season. Was this a sign we should have seen that there was something special about this team?
The consistency of Leicester’s motif vector for both seasons is a good sign that this method is capturing an underlying quality which we can call “passing style” rather than simply randomly assigning values through statistical noise. The consistency of the method is also present in other teams to which the method attributes similar styles such as Arsenal-Manchester City, Tottenham-Chelsea and Crystal Palace-Sunderland. If the method wasn’t picking up on stable underlying qualities of the team’s passing style, the probability of the method assigning these pairings by chance for two consecutive seasons is very low.
It seems we’re on the right track to quantify team passing style…
Player Passing Style:
Extrapolating this methodology convincingly to a player level is an exciting prospect for recruitment. Passing play is obviously a major factor of a team’s potential. Let’s say we could find economically efficient alternatives to Bayern Munich’s players and set up a low-cost team with the potential to execute a similar style of play to that which has made Bayern so dominant. Seems a bit naïve, but there’s definitely a competitive advantage there for clubs.
The question then is how to manipulate the info and translate it into a player context; and once we have done this, how to validate that we are in fact picking up on stable underlying qualities of the players. The problem for teams already introduced a key “validating element”: consistency across consecutive seasons. I won’t get into much detail here, but you can have a look in this entry from my blog on how I measure this consistency.
Long story short, I settled on a 45-dimensional (yes, 45) vector representing each player. Once again, for more details on how and why this was done in this way, you can have a look at this other entry from my blog. This is the summary at how I constructed this 45-dimensional vector:
- One first objective is to neutralise the effect of the team passing style on a player. If a team proportionately uses ABAB a lot, then inevitably so will the players. Therefore, if you put Fernandinho in Barcelona, his motif frequencies will start to resemble those of the whole team without it having been something inherent to him all along. The first idea I had was to view how a player’s relative motif frequencies diverged from his team’s frequencies in each match. That is to say, if in a match Arsenal performed 40% of its frequencies as an ABAC and 43% of the motifs Coquelin was involved in were ABAC, then Coquelin had a +3% for that motif for that match. Averaging for the whole season, Coquelin could be seen as 5-dimensional vector where each entry corresponds to his average divergence for each of the 5 motifs. This logic corresponds to 5 entries of the 45-dimensional vector.
- Instead of considering the raw values of motifs a player performed, we can consider each performance in a match by a player as a 5-dimensional vector in which each entry is the percentage of the player’s total motifs that that motif corresponds to. So we can represent a match played by Romelu Lukaku as 5% ABAB, 13% ABAC, 25% ABCA, etc. Averaging over a whole season, each player is represented by a 5-dimensional vector (5 more entries down).
- Another way of seeing that data which I felt might be useful is seeing each player’s match as the proportion of each motif his team performed that he participated in. That is to say, if Southampton completed 50 instances of ABAB in a match, and Jordy Clasie participated in 25 of those, he would have a 50% score for ABAB in that match. If in that same match Southampton completed 80 instances of ABAC and Clasie participated in 20, he would have a 25% score for that motif. Applying this logic to the 5 different motifs and averaging over the whole season, each player is once again represented by a 5-dimensional vector (another 5 entries down).
- Another take on the problem is this: for an ABAC sequence a player could participate as the A player, the B player or the C player. It’s straightforward to count that looking at all 5 motifs there are 15 “participation” possibilities for each player. If we count how many times each player was each letter in each of the 5 motifs, we are left with a 15-dimensional vector representing each player. Another 15 entries down.
- Finally, we can take this 15-dimensional idea and slightly alter it to not count the total of each pseudo-motif but rather what their relative frequencies are, so once again do something like if Dimitri Payet performed the B in an ABAC 15 times out of 100 total motifs he participated in, that pseudo-motif has a score of 15%. Once again, each player is represented by a 15-dimensional vector.
Since 5+5+5+15+15=45, we are left with our 45-dimensional vector representing each player. This entry explains how we know that this vectorisation is performing well; that is to say, the vector representations for players are in a sense “stable” across consecutive seasons, indicating that the methodology is picking up on some underlying qualities of a player’s passing style rather than randomly assigning statistical noise.
I’m quite happy with the results and there is good evidence that the vectorisation contains valuable information. Presenting this information in a visual way to the reader isn’t exactly straightforward. One way to do it is by displaying hierarchical clustering dendrograms of the results.
Below is a link for the pdf for the hierarchical clustering dendrogram applied to the data set for the 2015-16 season of the Premier League (only players who played in over 18 matches). Since there are 279 players, the tree labels are really tiny so the image couldn't be uploaded onto the site directly, but on the pdf you can use your explorer's zoom to explore the results.
https://drive.google.com/file/d/0Bzvjb5fnv1HtZjFtRDJjUVBua0E/view
If you’d rather not, here’s a selection of the method’s results:
- Mesut Ozil has one of the most distinctive passing styles in the league. Cesc Fabregas is the player closest to him and together they form a subgroup with Juan Mata, Ross Barkley, Yaya Toure and Aaron Ramsey.
- Alexis Sanchez is in a league of his own but the players with the most similar passing style are Payet, Moussa Sissoko, Jesus Navas, Sterling and Martial.
- Troy Deeney is in the esteemed company of Aguero, De Bruyne, Oscar and Sigurdsson.
- David Silva, Willian, Eden Hazard and Christian Eriksen are all pretty similar.
- Nemanja Matic, Eric Dier and Gareth Barry have a similar passing style.
- M’Vila, Lanzini, Capoue, Puncheon, Ander Herrera and Drinkwater are all similar, pretty good and perhaps underrated.
- Walcott, Ihenacho, Scott Sinclair, Jefferson Montero, Wilfired Zaha, Bakary Sako, Albrighton, Bolasie and Michail Antonio form a subgroup of similar wingers.
- Giroud is more similar to some rather underwhelming strikers such as Gomis, Cameron Jerome and Pappiss Cisse rather than to world class strikers. The same can be said of Harry Kane being similar to Aroune Kone, Son and Marc Pugh. Maybe the methodology is not as convincing for strikers?
- Shane Long and Odion Ighalo are good alternatives to Jamie Vardy.
- Diego Costa and Lukaku are similar to Rooney.
- Victor Moses, Aaron Lennon and Jordon Ibe are similar.
- Mahrez is similar to Sessegnon, Nathan Redmond and Jesse Lingard. Did Southampton know this?
- Matt Ritchie (ex-Bournemouth now at Newcastle) is in a group with Lallana, Alli, Pedro and Lamela. An opportunity for the taking?
- Angel Rangel has (and has always had) unusual stats for a full-back.
- The methodology recognises who the goalkeepers are and set them apart with this information being explicitly available. The same applies for many other players from similar positions which are grouped together like the CBs and full-backs.
This is a poor man’s substitute to actually exploring the dendrogram yourselves. Not to mention that a clustering dendrogram is not even the most faithful representation of the information being collected by this vectorisation, but I’m more than happy with the results and feel there is some real promise to the methodology. If I can come up with some better visualisations for the results I’ll post those later on.
Please have a look through the results from the dendrogram and comment on whether you feel we’re getting close to convincingly capturing player passing style through passing motifs.
Find me on twitter @dperdomomeza1
For prior work on this subject see my blog here