In one of my first articles on StatsBomb I looked at the top 10 goals per 90 performances by a forward using data from 2008-13. That list featured some surprising results: Berbatov came in at #2, Suarez's 2012/13 season was #5 and Drogba took the #1 spot. I had a very specific set of criteria for players who were eligible for that Top 10 list, the harshest was Time On Pitch% which is the percentage of minutes a player actually played. I set the line at 60%, naturally this meant that quite a few players who posted excellent numbers were ruled ineligible. Let's now roll back from that 10 list and look at all of the Premier League forwards in my data set who scored a goal during the years of 2008-13. The focus here will Shots on Target per 90 and Goals per 90.
SoT Per 90 And Goals Per 90
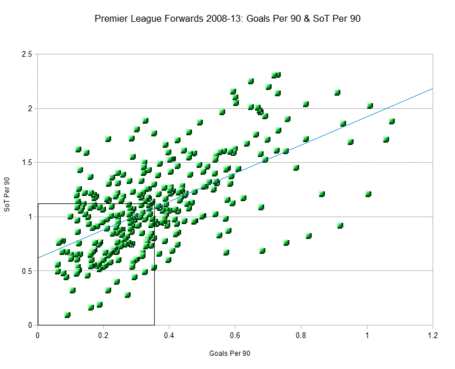
This is the full list of players, some 360 or so.  The black box on the bottom left of the graph is the the league average line in Goals per 90 and SoT per 90. Inside the box indicates the player is below league average. There is a pretty large spread here once we first move out of the sub-par performance in the black box. That large spread becomes a scatter once we move beyond 0.5 goals per 90 and 1.25 SoT per 90. The dots that reside toward the upper right hand side of this chart are the super elite. I want to seperate some of the bigger minutes players from the part time players. To do this I am going to use only players who had an above league average ToP% which is 44.29%.
Players Above League Average Minutes Played
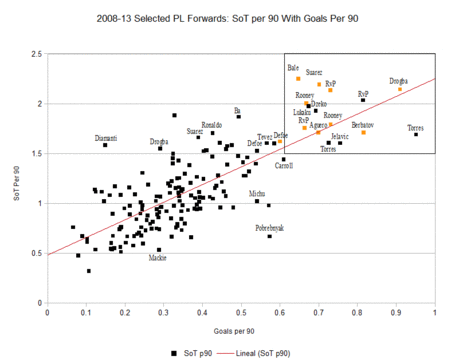
Again we use Goals per 90 and SoT per 90.  *Jelavic only played a half season after his move to Everton. These are the Premier League strikers who played over the average amount of time (44.29%). These are the full time players, there are no small samples here to pollute the results. There are 3 types of players on this list:
- A bunching of players who posted middling goals and SoT per 90. This is the main bunch toward the lower left hand side of the chart. Most of the 'full-tme' players fall into this category.
- A wild, secondary spread of players who posted quite different spreads in Goals and SoT per 90 but didn't belong in categories 1 or 3. This second type of player ranges from high goals/low shots (Pobrebnyak and Michu) to the high volume SoT/middling goals per 90 (Ba, Suarez and Ronaldo).
- The elite. The amazing seasons that seperate themselves from the rest of the seasons on this chart. There are only 15 players on this elite list of high volume SoT per 90 and Goals per 90 players. Of these 15 seasons 9 of them featured on the Top 10 Forward list. Lukaku, Dzeko, Kelavic and Torres x2 are the players who posted amazing seasons but fell short of the 60% ToP% threshold I put in place.
