In terms of shot volume there are currently four distinct tiers in the 2013/14 version of the Premier League. Tier 1 consists of Man City, Tottenham, Liverpool and Chelsea with all of these teams having between 320 and 350 non-penalty shots in their opening 20 games (16 – 17.5 per game). Tier 2 contains Everton, Arsenal and Newcastle. This group is shooting at the rate of approximately 15 shots per game. Tier 3 contains Southampton, Swansea, West Brom, Aston Villa, Norwich, Sunderland, West Ham and Man United. So far these teams have achieved a shooting rate of 12 – 13 per game. Tier 4 contains the shot shy teams of Hull, Palace, Stoke, Fulham and Cardiff; all of whom shoot 11 – 12.5 times per match. The boundaries between these groups can be clearly seen on the image below. In this chart the vertical axis represents the number of non-penalty shots taken by each team and the horizontal axis shows the number of shots conceded by each Premier League team so far in the 2013/14 season. Total Shots 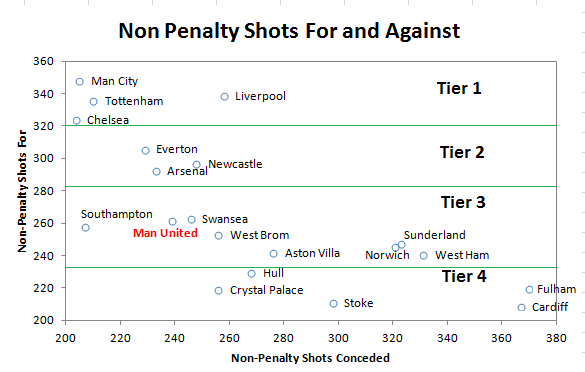 For me, the team that stands out in that chart (apart from the fact that I have highlighted them in red) is Man United. They went into the season as reigning champions and were one of the fancied teams at the start of the season but they currently reside in 7th place in the league. Arguably, wins over the Christmas period against Hull and Norwich masked the fact that they were out shot by what should be inferior teams on both occasions. From my viewpoint, the Old Trafford team are playing like a team that are barely better than mid table. It’s not just that United are struggling in terms of total shots, but they are also struggling to ensure that they shoot often enough from good places. I feel like the world’s greatest proponent of shot locations. It doesn’t matter if a team has had 20 shots in a game, I feel that I need to go to StatsZone or Squawka to see where those shots were actually hit from. If the bulk of them were from outside the penalty area then I mentally discount the volume of shots that the team has taken. A team could get out shot, but so long as their shots were from good places and the opposition’s weren’t then I can accept that. Arsenal this season are almost an example of a team in this category. Prime Zone Shots For any new readers please scroll down to the end of this article where I give an explanation of the zones used in these images. Let’s look at a chart, similar to the one above but one that plots just the shots taken from Prime locations taken and conceded by each team. The obvious advantage of Prime zone shots is that they are scored much more frequently than other shots and so have a higher goal expectation.
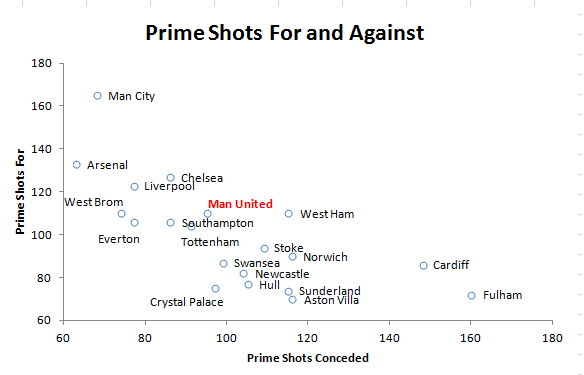
So what do we notice here?
We see how far ahead of the rest of the league Man City are in terms of attacking ability, how far down the vertical axis Spurs have slid compared to the original chart and just how awful Fulham have been this season. From United’s point of view they are higher up the vertical axis than they were in the first plot, but they are still substantially below the four teams at the top. In summary, when looking solely at Prime Shots taken United aren’t as poor as when looking through the lens of all shots, but crucially they aren’t able to point to a large number of Prime zone shots to make up for their lack of overall shots. It’s against this backdrop that we’ll now look at United’s shot charts. Man United's Shot Charts 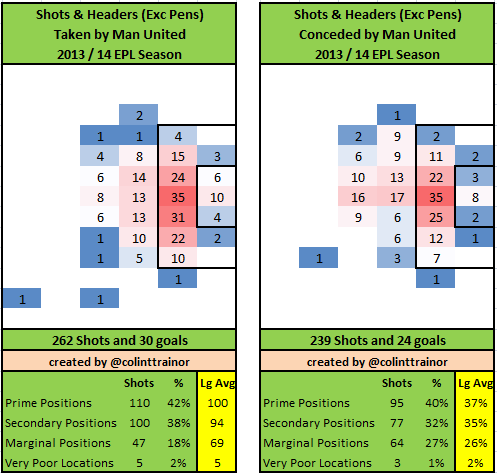 Attack Other than the low number of shots they have attempted nothing much jumps out at us from an attacking point of view. The split in percentages between each zone is broadly in line with what the top teams would hope to achieve, albeit like all the other teams in the league they trail behind Arsenal and Man City in terms of proportion of shots from the Prime zone. Following their defeat of Man United in the FA Cup, Swansea manager Michael Laudrup was quoted as saying:
I don’t think we needed that much luck today, because I don’t think Man United created the chances I expected them to.
I assume that Laudrup was being tactful with that reply as United haven't been creating the chances that most would have expected all season. I'm quite sure that this won't have escaped his notice. Defence The 239 shots conceded is the 7th lowest total in the league, but the location breakdown of the shots allowed should worry David Moyes. The rate of 40% of shots that they allow to come from Prime areas is above the league average and sees them substantially trailing behind the likes of Arsenal (27%) and Liverpool (30%). With United’s attack clearly not firing on all cylinders it is imperative that Moyes can at least rely on defensive solidity. When he joined United all the questions related to whether he would be able to continue with Fergie’s attacking prowess, it was taken for granted that he’s have his team defensively organised. However, Moyes has a considerable amount of work to do at both ends of the pitch if United are to finish in the Top 4 this season. During the summer it would have been unthinkable that United would miss out on qualifying for the Champions League, but I firmly believe that will be United’s fate this season. A lack of any meaningful attacking strategy and a defence with too many holes will see to that in my opinion. It appears however, that not everyone shares the same view as me. On Betfair as of this morning "the market" gives Man United a 35% chance of finishing in the Top 4 (they are quoting decimal odds of 2.82). Those odds look way too short for me and give United far more respect than their play this season has deserved. At the risk of setting myself up for a fall, I can only give United a 6% chance of qualifying for the Champions League this season. Obviously their chances might increase depending on their shopping activities in the January transfer window but my belief is that they are currently just the 6th or 7th best team in the league. Previous Mid Term Shot reports: Arsenal Man City Liverpool My Zones A reminder for any new readers of the zones that the summary box below the plots refer to: 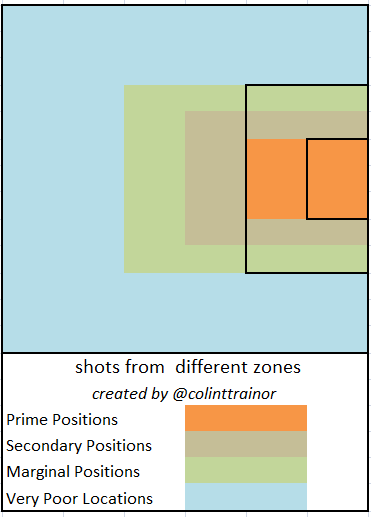 Each team plot has two images. The image on the left reflects the shots (excluding penalties) that the team has taken this season, while the image on the right sets out the shots they have allowed. The table underneath the image summarizes the shots by zone, and in order to aid comparison the numbers highlighted in yellow are the league averages.