What follows is a synopsis of my presentation at the OptaPro Forum which was held in London on Thursday 6th February. This article was first published on the OptaPro blog.
This analysis was only possible due to the data provided to me by Opta.
![]()
Expected Goals
The use of Expected Goals (ExpG or xG) as a metric in football is becoming more widespread. Even though all current versions if this metric are proprietary and use varying calculation methods, the aim of any Expected Goal measure is simply to assign numerical values to the chances of any given shot being scored.
The ExpG model that I and Constantinos Chappas developed produces a goal probability of approximately 3% for any shot that is struck from a central position outside the penalty area. Over the past year there has been recognition that shooting from long range is sub-optimal and by doing so a team is merely giving up other, more lucrative attacking options – think Tottenham Hotspur and Andros Townsend.
However, although I will admit that I had jumped to this conclusion in my own mind I was conscious that the alternative options open to the player in possession had never been evaluated before (at least not publically). This desire to establish baseline conversion rates for the different attacking options available to a player who was 25 – 35 yards from goal formed the basis for my Abstract submission.
Opta very kindly granted me access to the detailed match events for the English Premier League 2011/12 and 2012/13 seasons so that I could undertake this study and present my findings.
Those who are interested in the methodology I used can scroll to the bottom of this article, but for the sanity of any casual readers I will go straight to the findings of this study.
How many times was each option chosen?
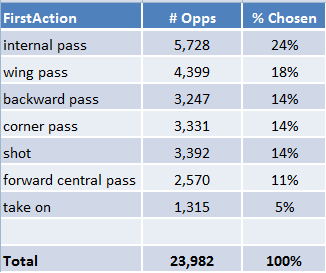
Figure 1: Number of Opportunities for each FirstAction
Take ons were attempted much fewer than any of the other possible attacking options. With the exception of internal passes, all the other FirstActions were attempted between 11% - 18% of the time. At least part of the reason why there were so many internal passes is that some of the passes that were destined for forward central, wings or the corners would have been intercepted within the rectangle. As I’m using the end co-ordinates of the pass, and intentions can’t be measured, these passes fall into the internal pass category.
But how often was a goal scored from each option?
As each possible attacking option has not only a chance of the team in possession scoring, but also the move breaking down and the opposition quickly countering I wanted to look at the net goals scored. It seemed reasonable to assume that the choice of attacking option would have a bearing on how likely the opposition were to score.
To calculate the net goals scored figure for each option I deducted the number of goals scored by the opposition from the number of goals scored by the original attacking team (both within 30 seconds from FirstAction taking place).
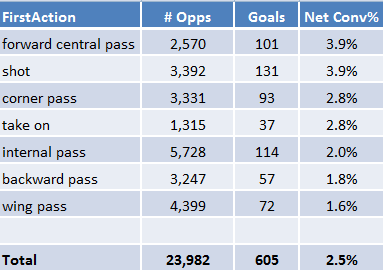
Figure 2: Net Conversion Rates for each FirstAction
Shooting is good?
Much to my amazement, the choice of shooting was actually the joint most efficient attacking option for the player in possession to take.
I had certainly expected that a forward central pass would be one of the more efficient attacking options, but due to the lowly 3% success rate of shooting from this area I had expect shots to appear much further down the table.
Eagle eyed readers will have noticed that the net conversion rate for shots of 3.9% is much higher than the 3% I quoted at the start of my piece. Was I wrong in my initial understanding?
In my dataset a goal was scored directly from the initial shot in 2.9% of cases, however this was further supplemented by goals being scored from another 1.2% of initial shots due to secondary situations, ie rebounds or players following up. From this figure of 4.1%, a value of 0.2% was deducted to reflect the amount of times that the opposition scored within 30 seconds of the initial shot. And so we arrive at a net conversion rate of 3.9%.
Another surprising aspect is that, on average, a team only scored 1 in every 40 times that they had possession of the ball in the area under analysis. Without having any real knowledge, I had expected the number to be higher, but I guess it shows that our perception and memories can be misleading – hence why we should use data to aid us in our decision making processes.
What is the significance of these findings?
If these results can be taken at face value then no longer can we criticise a player for “having a go” from outside the area. He’s actually attempting one of the most efficient methods to score from his current location.
The findings are even more important to weaker teams. It appears that the option where the stronger teams have less of an advantage over the weaker teams is actually the option with the highest expected value (along with the forward central pass). I say that shooting is the option that should favour weaker teams because those teams are less likely to possess a number of players that can thread a well weighted through ball or play an intricate pass. They are also likely to struggle to attack in sufficient numbers to create an overlap down one of the wings or to have as many players in support of the ball carrier as the stronger teams will have.
As well as it being logical that weaker teams could benefit more from this knowledge than stronger teams, I was able to demonstrate this by ranking the teams based on average league points per game and splitting the sample into two halves – Top Half and Bottom Half teams.
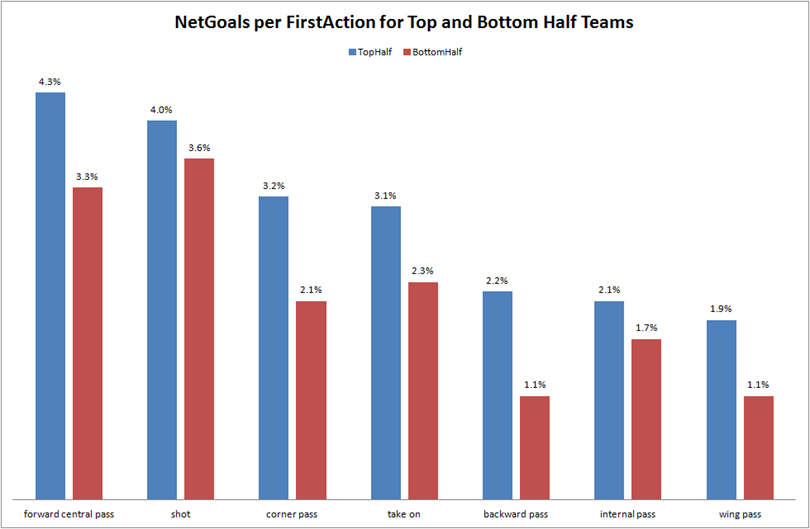
Figure 3: Net Conversion Rates for Top and Bottom Half Teams
As expected, Top Half teams had a higher conversion rate than their Bottom Half equivalents across all FirstActions. However, we can see that the drop off between the Top and Bottom Half teams is at its lowest for the Shot option and also that a Shot was actually the most efficient option for Bottom Half teams; whereas Forward Central Passes were the most efficient options for the Top Half teams.
Statistical Rigour
I wanted to satisfy myself that the differences in the conversion rates for shots over the other options (excluding forward central passes) were statistically significant. I also excluded backward passes from these tests as I don’t think players choose a backwards pass with the expectation that their team will score a goal from it.
The Null Hypothesis used was that there were no differences in net conversion rates between the proportions.
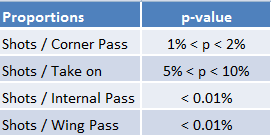
Figure 4: p-values for significance in Net Conversion Rates
It can be seen that the Net Conversion Rates for shots are significantly different than corner passes, internal passes and wing passes. The only option that didn’t reach the statistically significant threshold was shots compared to take ons, and it is my opinion that with a larger data sample these proportions would also emerge as significantly different.
At this stage we have demonstrated that shots from outside the penalty area are just as efficient as forward central passes, and more efficient than the other possible options. However, I need to address the fact that there could be bias within the net conversion rates of shots.
Possible Sources of Bias
I am aware of four possible sources of bias that could be at play here which could artificially inflate the conversion rates of shots over other options.
- Team Quality
- Score Effects / Game State
- Lack of Defensive Data
- Natural Selection
I will briefly discuss each of these in turn and address them where possible.
1 - Team Quality Bias
We have already seen that Bottom Half teams convert shots at a higher rate than other options and that Top Half teams also convert shots at a relatively high rate. There are statistically no significant differences in how Top and Bottom Half Teams convert shots.
2 - Score Effect Bias
It is accepted that the styles and tactics teams use vary depending on the scoreboard. A team that is trailing are more likely to attack in numbers and a team that is leading may remain more compact. It could be possible that shots are being attempted, or converted, at different rates depending on the current score line.
To investigate if this was the case I temporarily removed the Opportunities that occurred when there were two goals or more between the teams. I then analysed the remaining Opportunities by looking separately at Opportunities which arose when the game was tied and when the game was close (ie tied or just one goal between the two teams):

Figure 5: Net Conversion Rate at Close and Tied Game States
Shots in the entire sample were converted at 3.9%, this is the same conversion rate for Opportunities arising when the game is tied and almost the same for Opportunities occurring when a team is leading by just a single goal.
It appears that shots are converted at broadly similar rates regardless of the current match score, and so there is no bias attributable this source.
3 - Lack of Defensive Data
The Opta dataset is very comprehensive in relation to on the ball events, but unfortunately I was not given any data that could help me ascertain the amount of defensive pressure on each Opportunity.
It could be possible that players shoot from Opportunities which have the greatest chance of their team scoring a goal and they only take other options such as passes to the wings or the corners when a shot is not possible. Conversely, there will also be occasions when a player could take a shot but opts instead to play a ball for an overlapping runner or attempts to thread a through ball inside the penalty area.
I do not have the data to be able to form an opinion on this either way, but am making the reader aware that this could be a potential source of bias.
4 - Natural Selection
In analysing this dataset I do not have knowledge of the tactics that each team attempted to use on match day or the instructions that were handed down by coaches and managers to the players. The final potential source of bias identified is the possibility that the only players that attempted to shoot from as a FirstAction were elite shooters (think Gareth Bale last season).
A player that is poor at long range shooting could be instructed not to shoot from an Opportunity or to always seek out the elite shooter. If this was the case, then the 3.9% Net Conversion Rate for shots that was observed in my dataset wouldn’t be representative of the entire sample of Premier League players.
I would counter that by saying that we know that it’s not just elite players that shoot. There will have been long range shots taken during the last two Premier League seasons by players who are not skilled in shooting. So this figure of 3.9% will already be diluted (to some unknown extent) by the conversion rate of non-elite long range shooters.
Even if non-elite shooters are expected to have a conversion rate below the average of 3.9%, the magnitude of the buffer in conversion rates enjoyed by shots over the alternative plays of wing, corner and internal passes and take ons are sufficiently large to suggest that taking a shot may even be the optimum FirstAction for non-elite shooters.
Conclusion
The purpose of this study was to establish benchmark conversion rates for each possible attacking Opportunity given a defined area of the pitch. I knew that I couldn’t capture all the information that was existent for each individual Opportunity but given the extent of the dataset used in this analysis I assume that I have obtained a representative sample on a macro level.
Given the visibly low conversion rates from long range shots I was surprised at just how efficient (relatively speaking) this option was. This reinforces the fact that it is not enough to simply know the success rate for any option; we must also be able to reference that against the opportunity cost or success rates of the other possible options.
I am not suggesting that players should shoot on every attack; however I have demonstrated that we should be wary of criticising players for attempting to shoot, especially those in less technically gifted teams. This study has shown that where players have opted to shoot it was, generally, the most efficient option open to them.
Armed with the information in this study it is no surprise that Tottenham had the highest conversion rate of their Opportunities over the last two seasons. Gareth Bale would certainly have contributed to the success rate last season, but the North London side converted their Opportunities in both seasons at 3.8% and Bale did not have an exceptional shooting performance during the 2011/12 season.
The logic and methodology used in this study could be carried out on other areas of the pitch and thus benchmark conversion rates could be established as required.
Methodology
I followed the flow of individual match events and created possession chains. For this analysis I was only interested in possession chains which had an attacking event (ie pass, shot or take on) take place within the boundaries of the red rectangle as displayed in Figure 6. Where an attacking event did take place within the rectangle I labelled this an “Opportunity” and it forms part of this analysis.
The boundaries of the rectangle in Figure 6 can be described (in Opta parlance) as:
80 ≥ x ≥ 67
65 ≥ y ≥ 35
In plain English, I was concentrating on Opportunities which occurred 23 – 37 yards from goal and in the central third of the pitch.
Over the two Premier League seasons there were almost 24,000 such Opportunities to analyse.
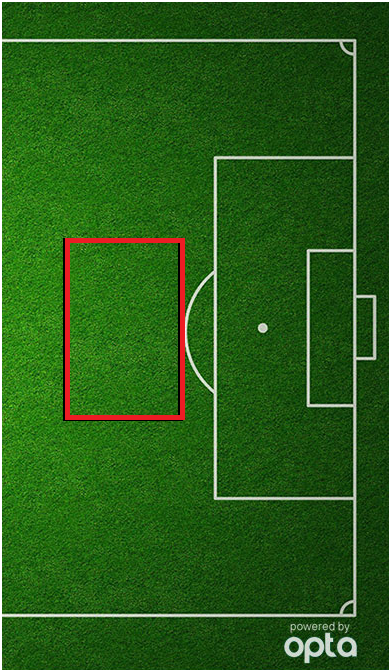
Figure 6: Rectangle showing boundaries for Opportunities
For my analysis I decided to have seven categories of attacking options based on the FirstAction carried out by the player within the rectangle. These were:
- Internal Pass (red)
- Corners Pass (yellow)
- Wing Pass (black)
- Forward Central Pass (blue)
- Backwards Pass (orange)
- Shot
- Take on
To aid identification the colours noted above relate to the colours of the zone boundaries shown in Figure 7.
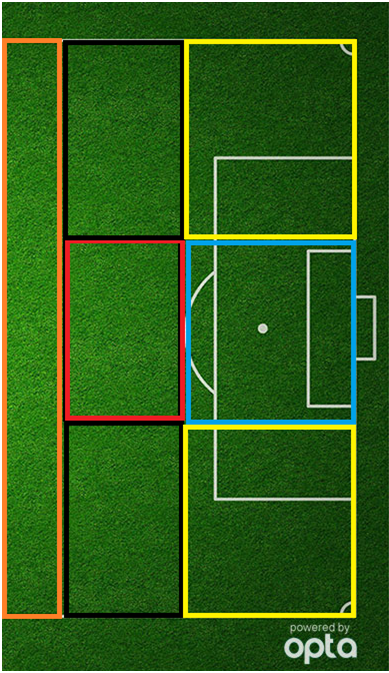
Figure 7: Boundaries of Five Passing Zones
To determine whether a goal was scored from each Opportunity I took the time of the FirstAction and allowed a period of 30 seconds to elapse to see if the attacking team scored a goal. I decided to use 30 seconds in an attempt to allow fluid passing movements to have a reasonable chance of concluding whilst trying not to contaminate the analysis with events from subsequent movements.
The reason that I chose a time based cut off instead of following the move until the team lost possession is that a clearing header by a defender does not necessarily mean the end of an attacking movement as the ball could drop at the feet of the original attacking team. Creating logic to determine when possession was really lost is challenging and objective, and so I avoided this method.
Free kicks were excluded from this analysis.