
Fourteen managers have been sacked during the last and current season of the Premier League. Almost every time we're left wondering if they deserved it based on their team's performance and if their successor did, or will do, significantly better.
After sacking Chris Hughton, Norwich's David McNally was quoted saying: "We are sad to see Chris go, but our form generally, and away from home, has been poor and this is a results business". A simple, honest statement at first glance, but it raises a few questions:
- Is he implying that 'form' and 'results' are the same thing?
- If he isn't, was Hughton let go due to poor form, poor results, or both?
- Isn't it his job as a chief executive to decide whether it's a 'results business' or not? Doesn't he know that results can be misleading, or does he merely use results to justify a decision based on something else?
Now I'm not the ultimate judge of a manager's performance and I don't intend to be. Form, either in terms of results or in terms of the underlying performance, is in the eye of the beholder. It's a matter of perception. This perception of form is what I'm interested in. Here are three important points about how we perceive form:
- There is a temporal dimension. One match occurs after the other, which automatically causes us to perceive a trend - even if there is none (i.e. the trend may not have any predictive value beyond the long term average).
- It's about relative performance/results. A loss may not be judged as harshly if it happens away against a good team, but do we correct for the strength of the opposition enough in our perception?
- And of course there's the difference between results and the underlying performance (good or bad luck), as far as we can measure it.
I while ago I experimented with something I called 'form charts' (article in Dutch). The idea is that they are a graphical representation of a team's attacking and defensive performance relative to the difficulty of the match, over time. In this article I present a slightly improved version.
How it works
Team A plays a match against Team B and Team A gets an attacking 'score' by comparing their offensive output* (adjusted for home advantage) with the offensive output of all other teams in the league against that same opponent (Team B). We know Team B's average amount of offensive output conceded, as well as the standard deviation. The number of standard deviations above or below the mean is Team A's attacking score.
Along the same lines we can calculate a defensive score by comparing the offensive output conceded by Team A with the average offensive output produced by Team B and it's standard deviation.
*The offensive 'output' can be defined as goals, shots, expected goals or anything like that. For example:
- Norwich scored 2 goals at home against Everton.
- A correction for home advantage means this really only counts as 1.74 goals.
- Everton concede an average of 0.98 goals, with variation of 0.62
- Norwich's attacking score is (1.74-0.98)/√(0.62) = 0.97, almost 1 standard deviation above average
For their defensive score we calculate:
- Goals conceded corrected for home advantage: 2.3
- Average goals scored by Everton: 1.63
- Variation of goals scored by Everton: 0.37
- (1.63 - 2.3)/√(0.37) = -1.1
We can simply add the offensive and defensive score to get an aggregate score of -0.13. This is what I view as the 'perceived result'.
If we do the same thing but with ExpG instead of goals we get a metric of 'perceived performance' instead.
This graph shows the (goal-based) attacking and defensive results over the course of Norwich's season (catchy title huh?).
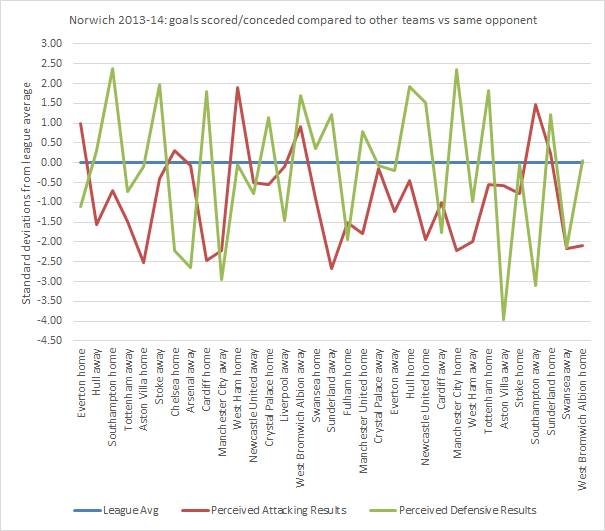
As you can see the values are all over the place. It quickly becomes clear that looking at individual matches isn't very useful and that it only works as a moving average of, say, five matches. This makes sense because a team is not usually judged on the basis of one match. If we're talking about form, we are indeed talking about the perception of a handful of consecutive matches. Exactly what this graph shows:
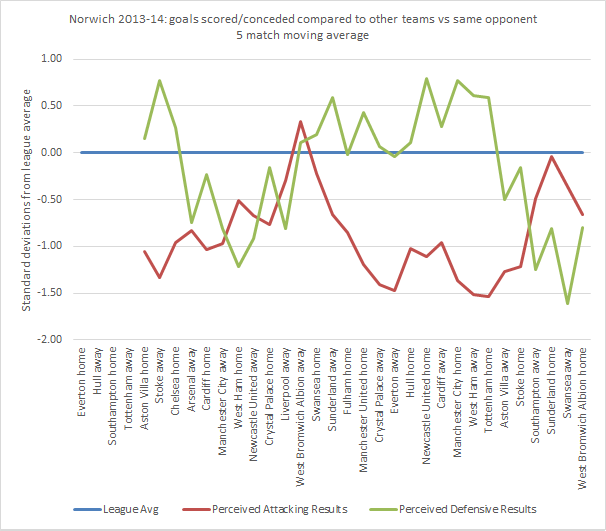
Norwich was in a bit of a slump when Hughton was fired, especially defensively. That's the temporal dimension I was talking about right there. How about the other two points then?
- To see the difference between perceived results and perceived performance we can simply use the difference between goals and expected goals.
- To see the influence of the difficulty of the schedule we can calculate the form graph but remove the correction for home advantage and instead of comparing to the average and standard deviation of a specific opponent, we compare with the league average and the average standard deviation. This way we can illustrate all three points with one graph, because all three metrics fit on the same scale (using the aggregate of attack and defence):
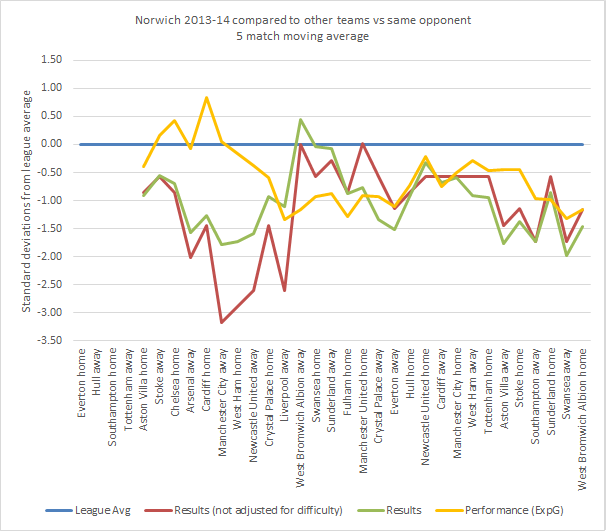
Note that most of the time results with or without correction for difficulty don't deviate that much because difficulty tends to even out over five matches. Some particularly hard or easy stretches can be seen though. The 7-0 away at City and the 5-1 in Liverpool stand out. This graph also indicates that there was more of a downward trend in performance than there was in results, so that might have been the real reason for McNally.
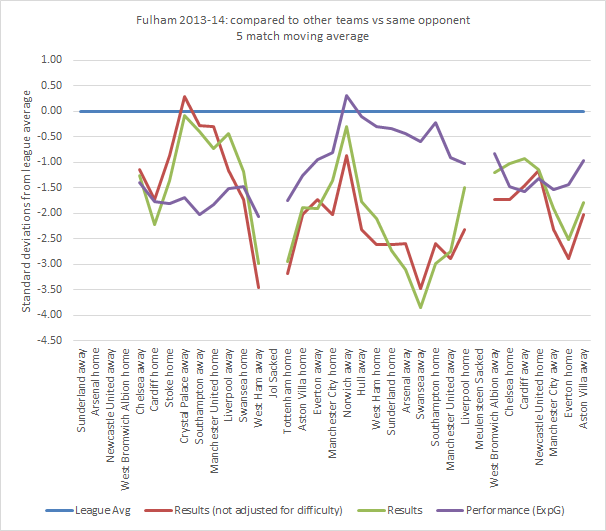
Here's Fulham as another example. The end of Jol's reign shouldn't have been a surprise to anyone, but sacking Meulensteen seemed like a strange decision. Magath certainly hasn't done any better so far.
Before I shower you with more graphs, let's move on to some conclusions after looking at all 14 sackings. I have tried to measure to what extend the three problems with perception of form were present at the time of sacking in each case.
- "Bad luck" - Results score in last 5 minus performance score in last 5 (to what extend were results worse than the performance would suggest)
- "Temporary slump" - Performance in last 5 minus performance in last 20 matches.
- "Underestimation" - Results not adjusted for difficulty in the last 5 minus adjusted results in last 5 (to what extend did the difficulty of the schedule make the situation look worse)
The lower the number, the worse it makes the manager look:
| Club | Manager | Bad luck | Temporary slump | Underestimation |
| Cardiff | Mackay | -0.54 | 0.04 | -0.25 |
| Chelsea | Di Matteo | 0.38 | 0.10 | -1.21 |
| Fulham | Jol | -0.94 | -0.51 | -0.47 |
| Fulham | Meulensteen | -0.48 | -0.58 | -0.81 |
| Manchester City | Mancini | -1.09 | -0.25 | 0.94 |
| Norwich | Hughton | -0.30 | -0.38 | 0.31 |
| QPR | Hughes | -0.36 | -0.49 | 0.48 |
| Reading | McDermott | 0.22 | -1.25 | 0.52 |
| Southampton | Adkins | 0.85 | 0.57 | -0.94 |
| Sunderland | O'Neill | -0.61 | -0.48 | 0.51 |
| Sunderland | Di Canio | -1.61 | 0.64 | 0.06 |
| Swansea | Laudrup | 0.63 | 0.02 | 0.25 |
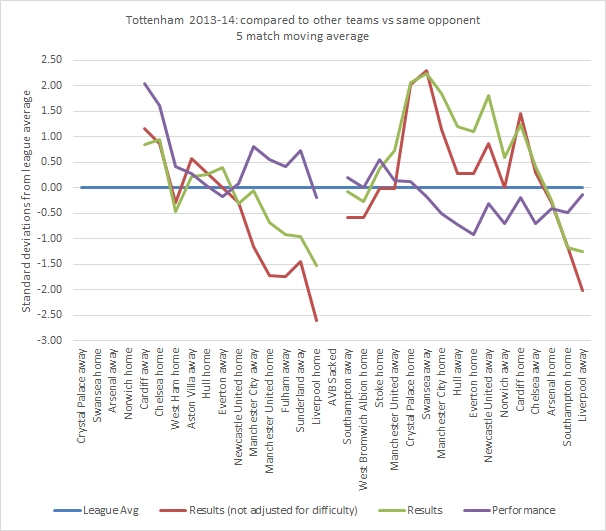
| Tottenham | Villas-Boas | -1.34 | -0.97 | -1.07 |
| West Brom | Clarke | -2.13 | 0.36 | 0.24 |
| Average | -0.52 | -0.23 | -0.10 |
The "bad luck"-effect is the strongest. In 10 out of 14 cases it was present, and on average it makes these managers look half a standard deviation worse than they really are. The "temporary slump"-effect is also at play, but it's less obvious. Based on this data I couldn't say for certain that underestimation is much of a problem.
In the introduction I left open the question whether a trend in performance has predictive value beyond the long term average. In other words: is a temporary slump really temporary? Based on the last two seasons of the Premier League, I can say with some certainty that looking at the last 5 matches to predict the performance in the next match is no better than looking at the last 20 matches. The difference between the performance score in the last 5 matches and the next match is on average 1.24 and the difference between the last 20 and the next is on average 1.17.
Graphs, graphs, graphs
Poor André Villas-Boas...
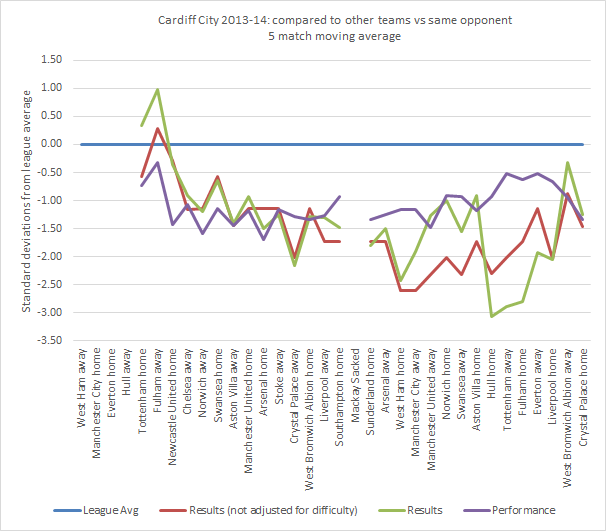
A change of manager didn't have much effect on performance in Cardiff.
Sunderland never looked good during the last few seasons, but Di Canio was particularly bad (click for big):

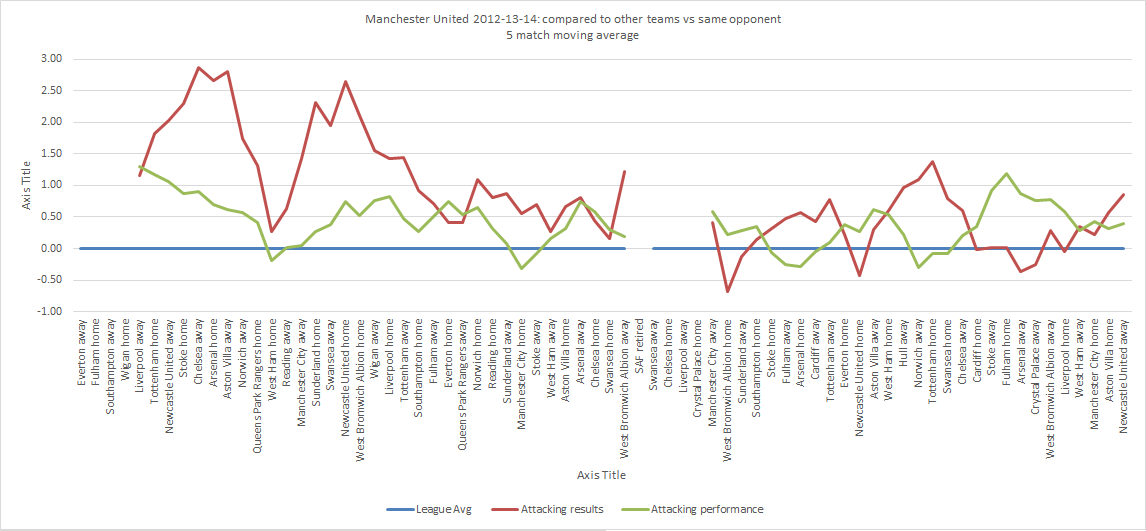
This one shows only the attacking score of Manchester United. The difference in results between this season and the last are very clear. The difference in performance not so much.
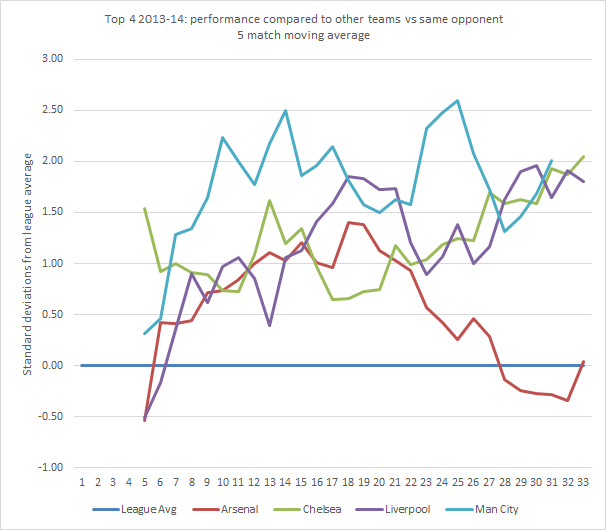
As a bonus, here's the current top 4. Or should I say top 3...
Final note: I didn't read Ben's take on Sacked Managers, Luck & Underlying Numbers before writing this. His approach is somewhat different, but it's definitely a recommended read.