In an article written at the end of July I introduced a metric which measured the intensity of a team’s high press.
That article can be found here, but in summary, this metric measured the number of passes that a team allowed in its attacking areas of the pitch per each attempted defensive action. A defensive action was defined as one of the following Opta events: a tackle, foul, interception or challenge. I used the term PPDA for this metric.
The lower the PPDA, the more aggressive the high press employed by a team.
The area of the pitch that was used in calculating the PPDA value was areas that had an Opta x co-ordinate greater than 40. It is the area to the right of the line in the image below.
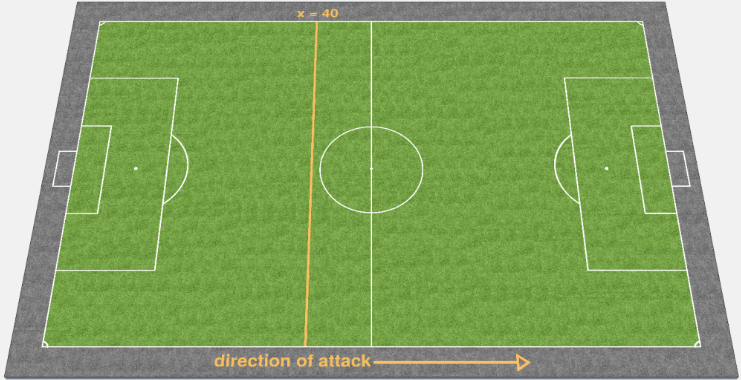
Pitch image created by Valentin
Pitch image created by Valentin
Pitch image created by Valentin
Manager Effect
In the previous article I gave a few examples of how a team’s manager could have an enormous influence on how much their teams used a high press. We saw how Pochettino had an immediate impact on Southampton’s rolling PPDA values, and that even the great Barcelona team of the last few years were not immune to the impact of the manager as Tito Vilanova totally changed the way they tried to win the ball back. Managers really do matter in this aspect of the game. When the high press, or “gegenpressing”, is mentioned, names like Marcelo Bielsa, Pep Guardiola, Jurgen Klopp, Pochettino and Andre Villas Boas tend to spring to mind.
Now, by using Opta data for the last four seasons across Europe’s “Big 5” leagues I am in the position to be able to objectively rank managers based on how aggressively they have implemented the high press, by using their PPDA values.
Data Rules
To appear in this list a manager must have managed at least 34 games over the last 4 seasons in the Big 5 leagues. I chose 34 games as that is a full season in the German Bundesliga (the league that plays the least games per season). This left me with a list of 154 managers. We’ll start with the 20 managers that had the highest PPDA values across their managerial reign. As these managers are associated with teams that allow a lot of passes per defensive action they very rarely employ a high press.
The 20 Managers that use High Press the least
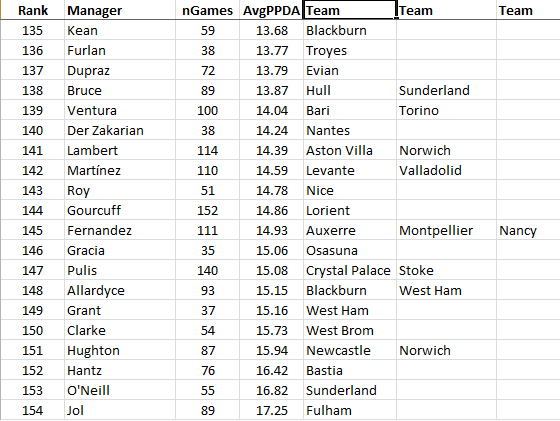
The list is mostly made up of coaches of English and French leagues. I don’t know a huge amount about the individual French managers, but it wouldn’t be an understatement to say that the managers of the English teams in this list were, generally, pretty ordinary coaches. Martin Jol, Martin O’Neill, Chris Hughton, Avram Grant, Sam Allardyce, Steve Bruce and Steve Keen haven’t achieved a great deal of success over the last 4 seasons.
What came first, the chicken or the egg? It’s difficult to know if the teams those managers controlled didn’t employ a high press because they didn’t have the skilled playing staff to carry it out, or were those teams largely unsuccessful because they didn’t press. At this stage, I’m not quite sure how to untangle this possible correlation / causation question but it would be wrong not to address the obvious potential correlation between the use of the press and the (lack of) success of their teams.
20 Most Pressing Managers
Let’s now concentrate on the other end of the list. Who were the managers and coaches that have made the high press a fundamental part of the way they instruct their teams to play?
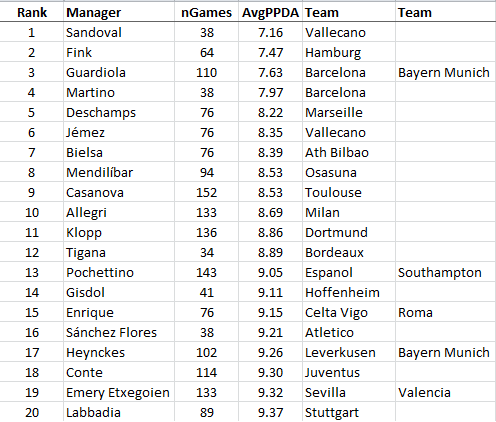
The first thing to notice is that first place in this table isn’t held by any of the managers I named previously as being synonymous with the use of the high press; albeit most of them appear somewhere on the list. Rayo Vallecano have played in La Liga the past 3 seasons, and both of the managers that have taken charge of them during this time appear amongst the top 6 high pressing managers. Jose Ramon Sandoval, their manager during the 2011/12 season, earns the accolade of being the manager that consistently made the most use of the high press.
After Sandoval’s stint at Rayo, he moved to Segunda side Sporting Gijon, and he appears to be currently out of work after parting ways with Gijon at the end of last season. The knowledge that Rayo Vallecano has been a leading exponent of the high press over the last few years is not new. This facet of the game employed by an otherwise ordinary team has been picked up by probably the two most influential tactical sites; Zonal Marking and Spielverlagerung.
It’s no surprise to see Marcelo Bielsa, who is held up as being the inspiration for the high press, appearing prominently in this list. It’ll be interesting to see the impact that the Argentine has on Marseille’s use of the high press this season. Unlike previous seasons, the French side did not favour the use of the high press during the last campaign, and one would assume that Bielsa would attempt to reinforce his preferred tactical style during this term.
The tactics employed by Marseille, and their PPDA value, is one to keep an eye on as the new season unfolds. Bielsa, is said to have been responsible for the footballing education of both Gerardo Martino and Mauricio Pochettino and was also a huge influence on the style of Pep Guardialo. So although Bielsa only managed one club side, Athletic Bilbao, during this period, it’s no surprise to see that his fingerprints are all over this table of the top pressing managers.
Andre Villas-Boas
One name that some might wonder about its absence from this list is that of Andre Villas-Boas. I am sure that Chelsea and Tottenham fans would suggest that AVB ran a kamikaze high defensive line during his tenure at both London clubs. However, my PPDA values don’t suggest that he actually used a high press during his two managerial reigns.
In fact, out of the 154 managers in the list, AVB is only 110th in terms of managers based on how aggressively their teams pressed!! If Villas-Boas attempted to operate the high press he was definitely doing it wrong. Is it possible that AVB just had an awful set up where he played a high defensive line but his teams weren’t actually able to press high up the pitch?
The opposition players then had time on the ball to pick out a pass and play through his defence which was, by now, stranded high up the pitch. The end result is a great shooting opportunity for the opposition due to a lack of defensive pressure and cover. The relatively high PPDA values recorded by AVB teams over the period covered by this analysis certainly suggest that they weren’t successful in applying pressure where it needed to be applied given his favoured defensive setup.
Villas-Boas vs Pochettino comparison
My assertion that Villas-Boas’ teams were not successful in pressing may come as a surprise to many. With this in mind I thought it would be interesting to visually compare the PPDA values for Tottenham’s last two permanent managers – AVB and Pochettino. So yes, I am erasing the existence of Tim Sherwood for this exercise.
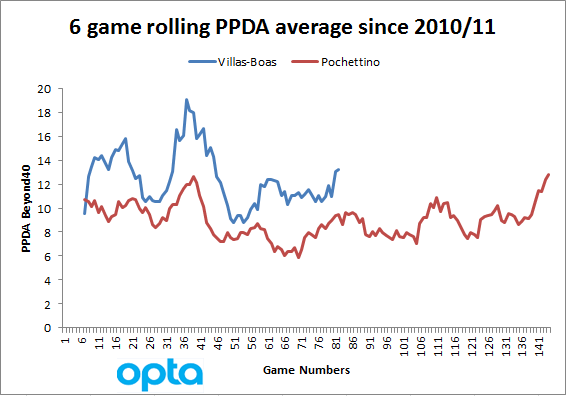
AVB only managed 81 games during this period, whereas Pochettino has been in charge for 143 games - this is why Pochettino’s red line is much longer than AVB’s blue line. However, what this image shows, due to his lower PPDA values, is that Pochettino has consistently been much more aggressive in his use of the high press. This demonstrates that the use of a high defensive line does not necessarily mean that the team operates a high press; indeed perhaps AVB is a case study as to why one without the other can be a recipe for disaster.
How high a line did Villas-Boas use?
I wanted to see if it was possible to test the hypothesis that AVB employed a high defensive line without having a high press by using the data that I have access to. To obtain a proxy for the height of the defensive line I obtained the average x Opta co-ordinate for all defensive actions for defenders. Like all Opta detailed events this only captures “on the ball” events so if a defender was high up the pitch but didn’t made a tackle, a foul or an interception I won’t be aware of his existence.
Although I am aware of this proxy’s shortcomings, over a large number of games I would expect the average x co-ordinate to give us an idea of where a team’s defenders typically engaged with the opposition. During the period that AVB was in charge of proceedings at White Hart Lane (from the start of the 2012/13 season until 15th December 2013) his Tottenham team operated the second highest defensive line in the Premier League – only Man City’s defenders had their average defensive touch higher up the pitch than Spurs’.
However, on the PPDA pressing metric Tottenham were just the 7th most pressing team in the league. So it does seem that there was a mismatch in the height of Tottenham's defensive line in comparison to the pressure that his players further up the field were able to put on the opposition. I’m sure that AVB’s failings were more complicated than just this, but the above seems to be a plausible explanation of at least part of why Villa-Boas’ brand of defending during his time in England was so porous.
Osasuna
When compiling the two tables that appeared in this article I was intrigued by the PPDA values notched up by the various Osasuna managers. Mendilibar appears in the list as running one of the most aggressive high press systems, yet the manager that replaced him at the beginning of last season, Javi Gracia, totally abandoned this style as he ran a team with a seriously high PPDA figure.
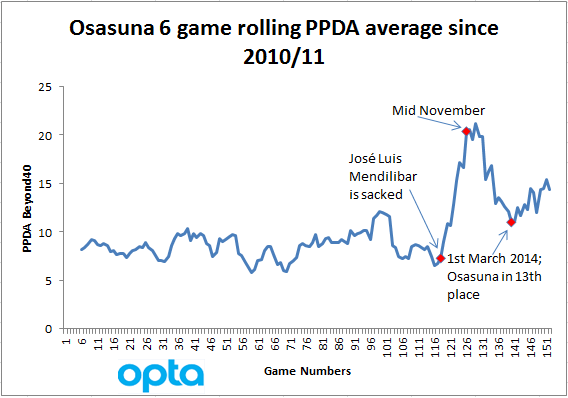
The immediate change in style after Mendilibar was sacked is apparent as Osasuna’s PPDA climbed in an almost vertical fashion over Gracia’s first dozen games in charge. At this stage, mid-November, Osasuna was occupying one of the relegation places. Over the next 14 games an improvement in results (they climbed to 13th position in the league) was matched by a substantial reduction in their PPDA value. Unfortunately, this momentum was not sustained and the final stretch of games seen them collect just 10 points from the last 12 games, a tally which ultimately seen them relegated.
Again, the downturn in results is matched with an increasing PPDA value. Although I’ m not claiming that all teams will get better results by pressing more aggressively, we can see that in the case of Osasuna in 2013/14 this correlation definitely held true.