 There were two impetuses for this. The first was Arsenal. That's usually the case. It's a completely rational response to the frustration caused by watching a Wenger-managed team week after week. If you bury yourself deep enough in the individual trees of observation you'll totally miss the forest of ennui. The other option is to drink. If you go back and canvass last season's week-by-week EPL title predictions floating around the Twittersphere, you'll find that many of those models generally loved Arsenal almost up until the day when it was mathematically impossible for them to win the Premier League. But most of those models don't have any defensive information or, if they try to impute it, it's probably coming up short. Models that were largely expected-goals-based were probably loving Arsenal because they were probably over-estimating the probability Arsenal's shots were ending up as goals. And that's because, well, they were. That's an insightful tautology, huh? But at this point a bot could manage against Arsenal. Put 10 men behind the ball and defend while they try to walk the ball into the net for 70 minutes. Then, when they start pressing for a winner because the clock is winding down and they are getting frustrated, hit them on the counter 1. And it's my contention—possibly with an assist from confirmation bias—that no team sees a defense like that as consistently as Arsenal. A shot against a defense with four guys in the box has a higher probability of getting scored as a goal than a shot against a defensive with eight guys in the box. That's not a guess. Not all datasets lack defensive info. In another post on Statsbomb Dustin Ward started generating his own (scroll down to the subsection title 'Box Density'). It was crude, but still, it produced maybe the single most important result last season (that I saw anyway). He tracked Stuttgart's Bundesliga shots for and against by hand (seriously, that level of commitment is both laudable and baffling) and found that, on shots under 20 yards, just the difference between having 4 or fewer defenders vs. 5 or more defenders in the box caused a 1/3rd drop in the percentage of shots to score. If we assume that Arsenal are indeed consistently facing more defenders in the box more often, then their shots have a lower probability of being scored than a model built on entire league-seasons would predict. Not only that, but they would also get shots blocked at a higher rate. We can't really calculate the entirety of the former (that would be in the defensive info that we's missing), but we can capture a bit of it in the latter. To do that we build a three term model where we calculate the probability that a shot ends up 1) on target 2) off target or 3) blocked 2. This is roughly analogous to Three True Outcomes in baseball. If you're shooting in soccer you can't really control whether the keeper makes a save or not, all you can control is whether or not you get it on target (necessary but not sufficient for scoring)3. Here we're taking shot data and just re-slicing it in a way to model what number of shots 'should' get blocked (along with a couple of other things). But we're theorizing that is going to be wrong for Arsenal. They routinely encounter enough extra men packed in the box against them that they are going to see more of their shots blocked than a model lacking defensive info would predict.
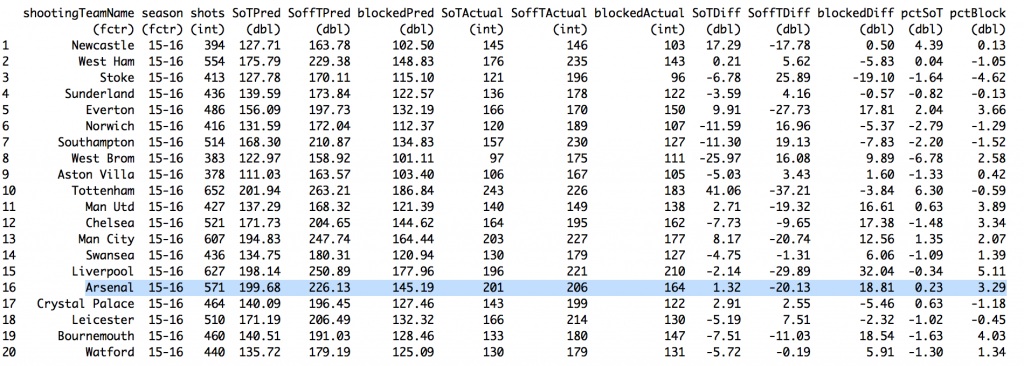
![]()
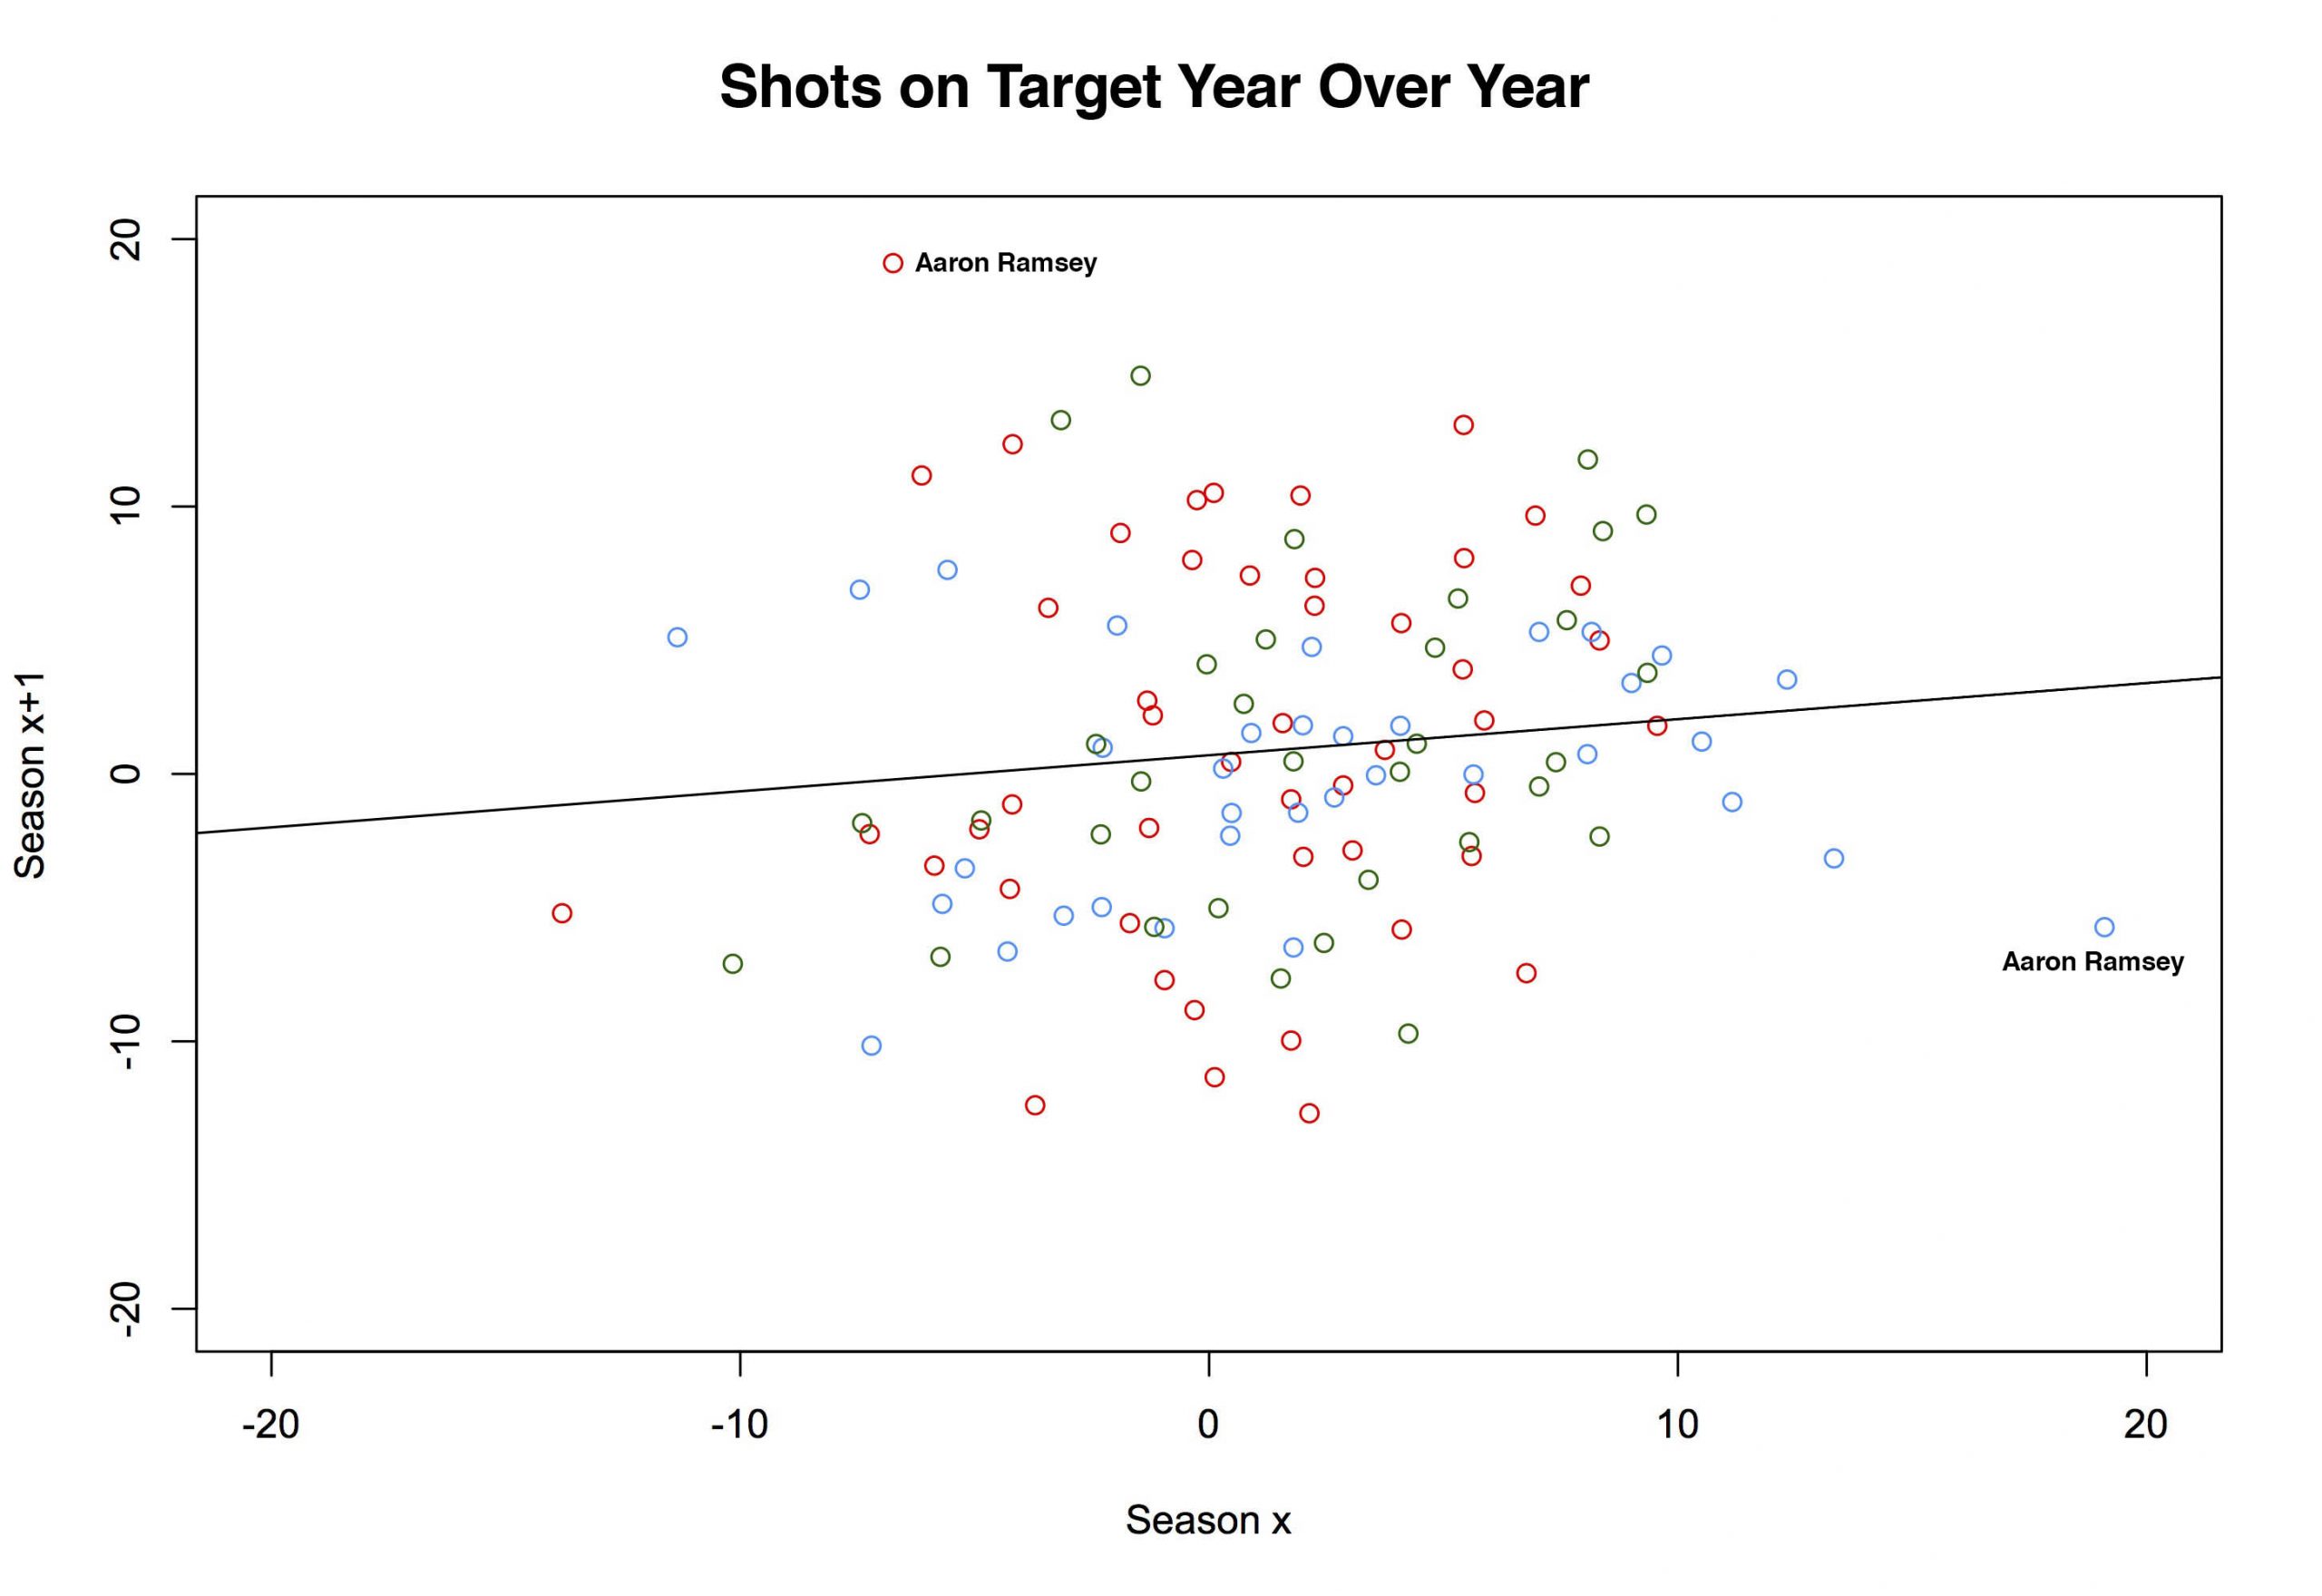
And we're right (see the above). They did see more blocked shots. The model predicts Arsenal should have had 145.2 shots blocked whereas in actual game play they had 164, a difference of just under 19 (column names should be self-explanatory; 'Pred' is short for 'Predicted', 'pct' for 'percent', and 'Diff' for 'Difference'). That might be worth as many as 4 points on the table4. That's probably not enough of a difference to explain why the models were so wrong for so long. The other, more likely answer is that 38 games is just big enough for us to think our models are useful, but small enough for the massive amounts of deviance to remind us otherwise5. The other impetus for this piece was a tweet by James Yorke, which itself is actually just shot a map from Paul Riley.
Some Tottenham shot locations courtesy of the @footballfactman on target charts (Eriksen!)https://t.co/4x9sb7GTuJ pic.twitter.com/z6KJ5fy99B
— James Yorke (@jair1970) March 7, 2016
Look at that Eriksen map. All those shots on target from outside the box. That's insane, right? Well, it turns out Riley only uses shots on target, so that's all he's plotting. Assuming they take enough shots, anyone could look like they are lethal from distance. D'oh. Still, my kneejerk idiocy doesn't change the question: How often should shots from distance end up on target? 'Bad' shots should have a lower probability of ending up on target (if you don't believe that, watch Philippe Coutinho for, oh, at least a half or, better yet, rewatch England play Iceland). If a player takes lots of those shots, he'll end up with fewer on target than someone who takes the same number while parked inside the six. That Eriksen plot might still be ridiculous, depending on how many shots he has taken. And, by summing on individual players instead of teams, we can use the same model from above to examine just that. Turns out, it was pretty ridiculous. By the model, Eriksen should have put 27.77 of his 100 shots on target last season. He put 41 on target. As a percentage of total shots, he was second in the league only to Yannick Bolasie. The more important question is: Is that repeatable? To answer that, we sum over multiple seasons, then plot one season on the x-axis, and the subsequent season on the y-axis and we get the quasi-amorphous blob of a chart below6. The x-axis is the percentage of excess (or deficit) shots on target relative to the total for any given player. The y-axis is the same number in the following season. The colors are for the three different paired seasons (12-13 to 13-14 (red), 13-14 to 14-15 (blue), and 14-15 to 15-16 (green)).
![]()
For example, the red-colored point sitting up near the top of the chart labelled "Aaron Ramsey"? That represents Aaron Ramsey. Clever, no? In the 2012-13 season, the model predicts that Ramsey should have put 15.1 of his 46 shots on target. In the real world, Ramsey only managed to get 12 of his shots on target7. So he was -3.1 away from the target, or -6.74% of the total (-3.1/46). The following season, we get a predicted SoT for Ramsey of 17.45. He put 27 out of 50 of them on target. His percent overage was 19.10. And with that, the half of Arsenal fans who thought Ramsey was horribly overrated were forced to admit they were wrong or at least forced to do some linguistic gymnastics to find ways to consistently criticize him. But there is that blue dot on the right side of the graph. It's also labeled 'Aaron Ramsey' and it also represents two seasons of his shooting. This time the x-axis is the same as the y value from the 13-14 season (above). Now our y-axis is 14-15 Aaron Ramsey. His predicted SoT was 20.6. His actual total was 17. One season later, he's gone back to being slightly negative and half of Arsenal's fan base subsequently reverted to being wrong about being wrong about Ramsey8. If we fit a line to the above plot (it's there already) we get a slope of .135. It's slightly positive, but that's mostly noise9. So there's little to support the idea that getting shots on target is a repeatable skill 10. Kind of. It turns out it might matter how we set this up. Again we plotted consecutive seasons. But of the four best player-seasons in our set, Eriksen actually has two of them (his 13-14 and 15-16 season). It just so happens that for the 14-15 season he went slightly negative. So, while on the whole, it looks like it's not repeatable—we do have 168 player pairs in our plot—that mightn't be true of everyone. Cesc Fabregas also has two good seasons as does Harry Kane. With only a couplathree seasons here, we might lack the data to saying anything more definitive than it doesn't look to be repeatable overall but it might be repeatable for a select few players11. That's probably not too reassuring to Tottenham fans wondering how many of those 'excess' 41 shots on target (see top chart) they can expect not to get next season. Sorry12. @bertinbertin 1 It also helps when your keeper has the game of his life, which seems to happen fortnightly against Arsenal. 2 For this I built a cross-validated multinomial model. The nice thing about multinomials is that you have a built-in way to quickly check you did everything right. All of the outcomes you specify in the model should sum to one. Right? If you say there are three things that can happen, then for each observation, those three individual probabilities need to add up to one. And hey, we didn't mess it up. Below is a screen of a few rows. All do indeed sum up to one. More importantly, hand auditing a few observations seems to check out (i.e. close-in non-headed shots have high probabilities of end up on target and low probabilities of being blocked). 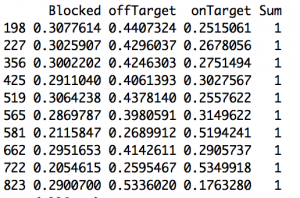 3 I'm still not sure about how to think about blocks in terms of whether it's in a shooter's control. Theoretically, an offensive player should be able to know whether he has a clear shot on target. If there are three bodies between you and the goal mouth, you are free to pass up that shot, knowing there is a very good chance it will be blocked. But by that logic you could also wait until you know you had the keeper beat before taking a shot. So then there would be four outcomes (block, on target, off target, goal). However, one of the things I'm trying to measure is blocks, so I have to have it in the model; the other two terms (on- off-target) are things within a player's control. It is admittedly not as tidy conceptually as I would like. Also, I stuck with the convention of classifying a shot that hit the post as off-target. Not entirely sure why traditionally it's done that way. Can't you hit the inside or underside of the post and have it carom in? That seems pretty on target. 4 If you want to assume that all of the excess blocked shots would have ended up on target—and that's by no means necessarily a good assumption—then we can ballpark that Arsenal missed out on about 4 points. Here's the no-modeling-skills-needed estimation for that. First, about 30% of SoT end up as goals, so if Arsenal missed about 19 SoT, that's around 6 goals. By the Soccer Pythagorean, you get about an extra 2/3rds of a point for each additional goal in goal difference. So an extra +6 GD is about 4 points. That's just enough to make a dent in Leicester's final 10-point margin but not enough to threaten. Maybe... depending when the points had been picked up, 'pressure' on Leicester before their relatively easy run might have changed the entire dynamic of the back end of the season. Moreover, when those 6 goals were scored (Southampton (H), Palace (H) off the top of my head) could theoretically be worth much more than 4 points. Clearly I'm still at the 'Bargaining' stage. I hope to have achieved 'Acceptance' by the start of next season. 5 It's worth pointing out that, even though that 18.81 for Arsenal looks pretty large, Chelsea, Manchester United, Liverpool, Bournemouth (really?), and Everton all had higher percentage of blocks above expected. I'd say those are generally attacking teams but, well, that's LVG's United. City was also non-trivially positive. 6 For the upper 'mistake' chart, I used a qualifying cutoff of 30 shots. For this expanded chart I used 40 shots. That's not based on anything other than 40 is just over 1 shot per game, which seemed like something you couldn't fluke into. 7 Incidentally, almost the entirety of his deficit can be attributed to blocks; he had about 3.5 excess blocked shots. 8 This season he had about 3 fewer blocked than predicted. He Zamora'd an excess of about 10% of his shots that season. Not good. 9 Residual deviance over null deviance here is 4518/4581. So we're basically doing little better than just the intercept, which, incidentally was just fractionally over zero. 10 Either that or there is something in defensive positional information we're missing that will help with prediction here. That's likely. The degree to which it will improve such a model, that would be a straight guess. Also, even if we limit it to people whose job it is to shoot (i.e forwards), it doesn't get a whole lot better. Across the data there are just three who posted plus-percentages in back-to-back seasons: Aguero, Suarez and Kane. I should also point out that I upped the minimum qualifier to 100 shots for that set. 11 I'm fairly confident I'll think of a better way to come up with something more definitive about 10 minutes after this posts. 12 Not sorry.