This entry is a follow up on my passing autographs entry (I've since decided that Passing Network Profiles has a better ring to it) in which I thought I'd go through some of the profiles' results for Bundesliga and Premier League teams. A quick update first of all: I've made a few small improvements to the methodology presented previously and have achieved repeatability above 95% now. Also, in this new improved methodology, 8 spatial categories slightly ousts 9 as the optimum choice. That's pleasant since 8 is a much nicely round number (no pun intended). Remember from last entry that what we mean by "team passing network profile" is a set of 40 numbers: the relative frequency of each of the 5 motif types performed in the form of each of the 8 spatial categories. Below are the results for the classic high-dimensional data visualisation methodologies of hierarchical clustering and principal components for data from the 2015-15 Bundesliga and Premier League: 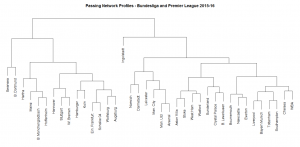
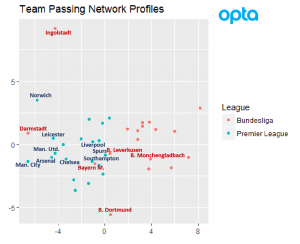 There's a lot to talk about regarding these results. First of all, there is a clear distinction between the profiles of Bundesliga teams versus Premier League teams, so in other words across both leagues we find different types of passing network profiles. Among Bundesliga teams though, there are 4 teams that are in general closer to Premier League teams than to their German counterparts: Bayern Munich, Bayer Leverkusen, Ingolstadt and Darmstadt. Clearly this is to varying fortunes: Darmstadt and Ingolstadt both seem to be headed for relegation. NOTE: Don't read too much into Ingolstadt and Darmstadt's position in these plots. Even though it's true that in general they are more similar to Premier League teams, they're actually outliers of the data set and are pretty far away from everybody. The same applies to Norwich. The fact that Norwich and Darmstadt appear similar to Leicester and Man. City is more a shortcoming of these methodologies when trying to plot high-dimensional observations in only two dimensions. Having said that, there are several clusters of interest. The first of these is the one made up by Arsenal, Manchester United, Manchester City and Leicester; and the second one is made up of Bayern Munich, Liverpool, Tottenham, Southampton and to a lesser degree Chelsea and WBA. This last pair is interesting considering WBA's great season so far in 2016-17. Another interesting pairing in this confirmation-bias sense is Hoffenheim and Monchengladbach. But anyways, best to keep it short and let the reader make his own analysis of these results. I'd love some feedback from the surely many many more tactically literate readers on what they make of these results. Please read and share!
2017
Team Passing Network Profiles - Some Examples from the 2015-16 Bundesliga and Premier League
By admin
|
April 25, 2017
