
At one point in the 16-17 season, I posted a radar featuring Zlatan Ibrahimovic's xG stats and basically exclaimed that his output so far was exceptional and that goals would come.
This was... controversial. And as with almost anything that's controversial on Twitter, I took a bit of a battering.
We've recently added date filters for radars to the StatsBombIQ platform, and Zlatan's Manchester United season is a fantastic case study for a boring old stats concept called "reversion to the mean."
Applying the concept to Zlatan, despite the fact that he scored few goals for United in the first three months of the season, I was predicting that his future output would revert toward the mean expected output, and he'd start scoring a lot of goals.
The first image below is his actual output vs predicted output from the start of the season until November 1st.
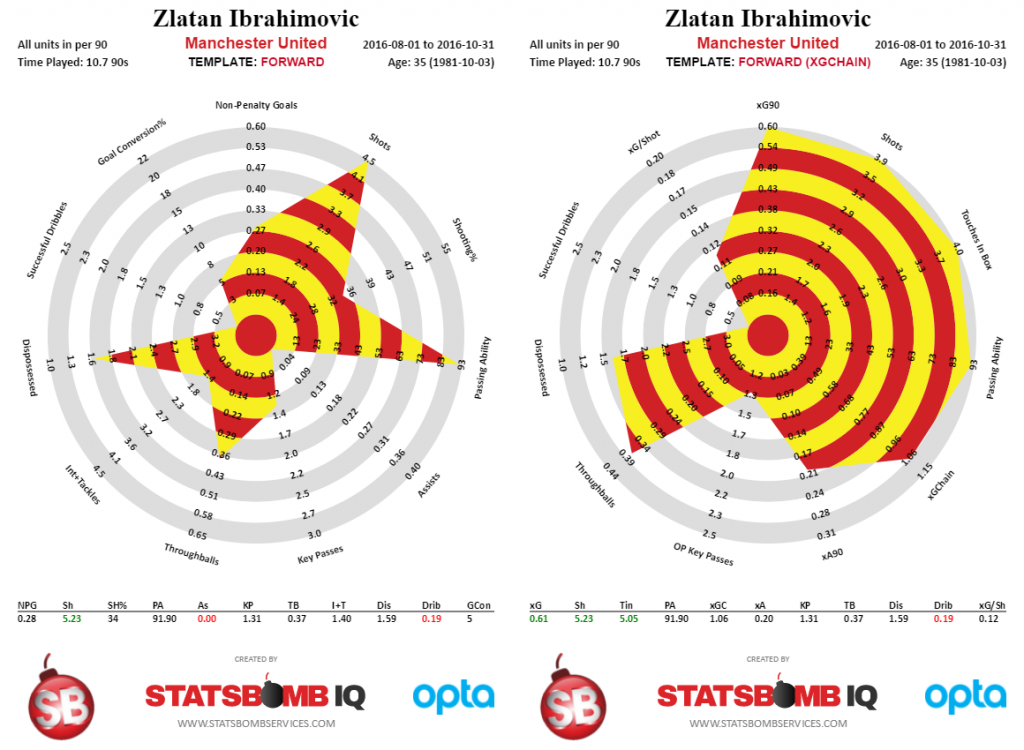
The formats here are slightly different, but from a stats perspective, my contention was that his scoring output was going to move toward to his expected goals (xG) and expected assists (xA) at some point in the future.
Here is Zlatan's production from November 1st onward, the left side representing real world output, and the right side containing the xG info.
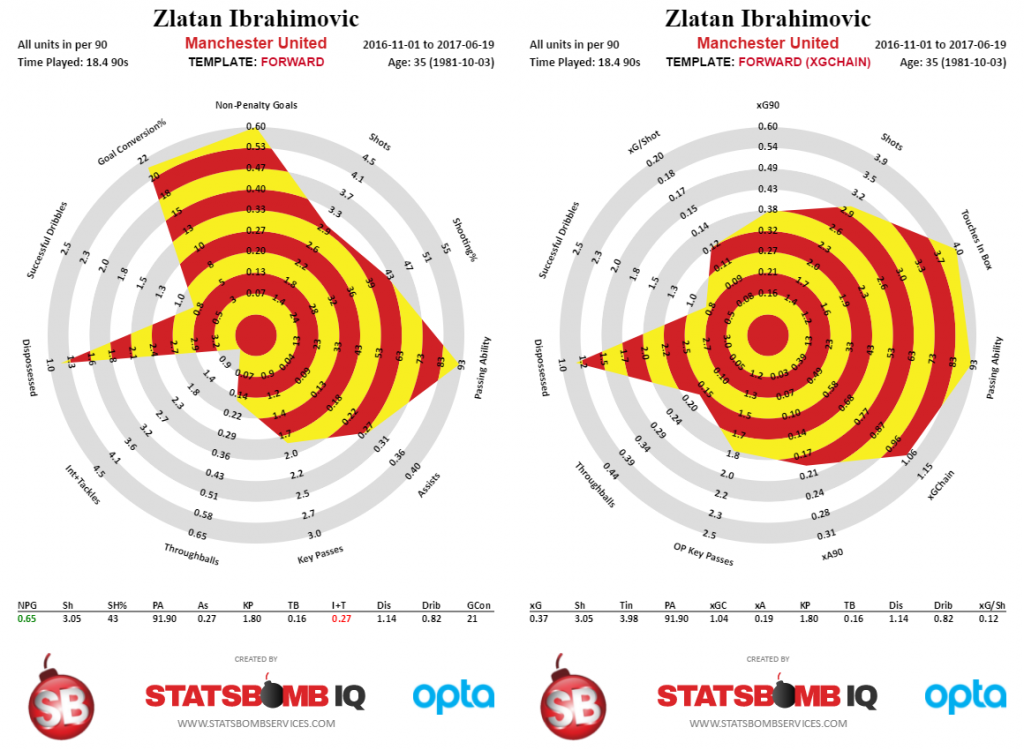
So from November onward, Zlatan actually outperformed his xG numbers by scoring more goals than expected. As my colleague DOCTOR Kwiatkowski might say, "Welcome to the world of averages and variance!"
The final Zlatan radars below are his output for the full season, which was unfortunately cut short by a brutal cruciate ligament tear.
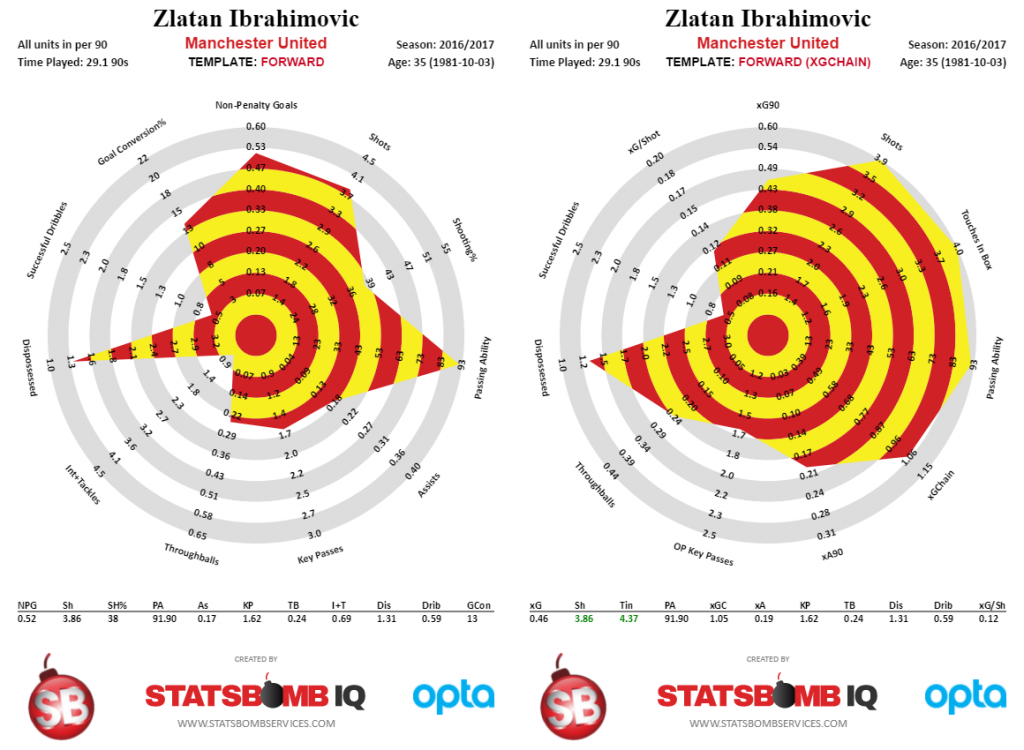
And BEHOLD, actual production and expected production ended up being very similar to each other, which was what I was suggesting would happen in the first place.
Now this happens in football all the time. A hot scoring streak that isn't backed by high xG numbers should not be expected to continue indefinitely. On the flip side, players with strong output like Zlatan above might be very good candidates for a discount transfer move, assuming you can't find obvious flaws in their game.
We actually had a situation like this happen at Brentford with regard to Alan Judge. Coming into the 15-16 season, our group really liked him. He had a great defensive work rate, some very good assist numbers, and he was pretty good with the ball.
On the other hand, by midseason, he was viewed as Brentford's only really good player. The reason for this can be seen in his shot maps.
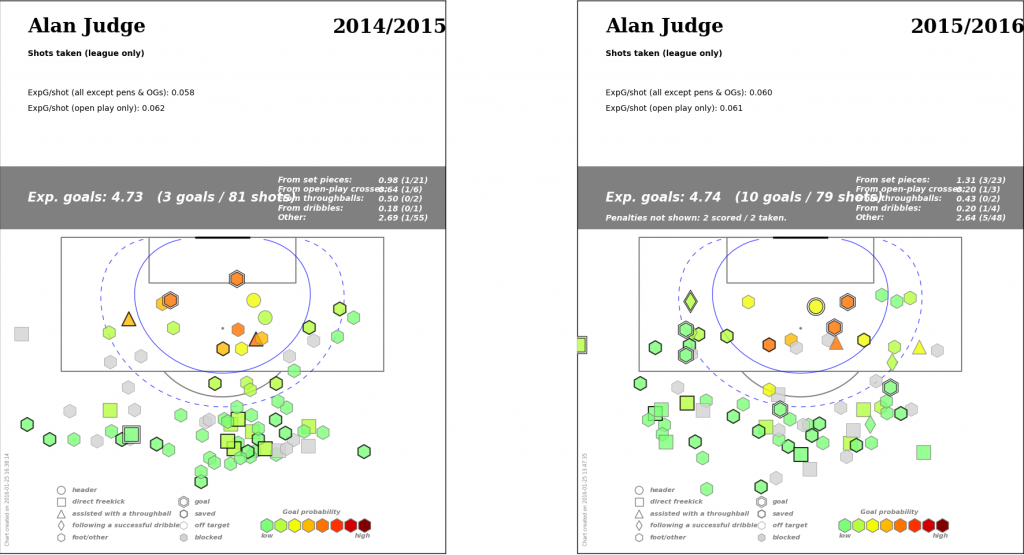
In an amazing piece of serendipity, the point that I pulled Judge's shots for a shot location presentation I was giving was within two shots of his previous year's output. One of the things I wanted to talk about was yes, Judge was playing very well, but don't expect that level of output to continue. There was also a subtext there of, if he didn't want to sign an extension and good offers came in, maybe we should consider selling him.
The cool part about the Judge shot maps is they cut through a lot of the usual arguments you get into about player over/under performance. This was in a player
- in the same team
- in the same league
- with mostly similar teammates
- only one year older
- With IDENTICAL SHOT QUALITY from similar locations overall
And yet one season he scored three goals and the next he scored 10 + 2 penalties, which was completely changing how everyone thought about the player, including our own club personnel.
Unfortunately, shortly after I gave the presentation, Judge suffered a horrible leg break and hasn't played since, so the concern about a reversion was replaced with an entirely different set of concerns.
In practical terms, reversion to the mean combined with not all shots being equal is exactly why we moved from using actual output to analyse players and started to use expected output. Both of the examples above are practical use cases that happen thousands of times across football every year, and when used correctly, stats help you see likely future performance far more clearly than you ever would via traditional methods.
Ted Knutson
@mixedknuts
ted@statsbombservices.com