Models that attempt to measure passing ability have been around for several years, with Devin Pleuler's 2012 study being the first that I recall seeing publicly. More models have sprung up in the past year, including efforts by Paul Riley, Neil Charles and StatsBomb Services. These models aim to calculate the probability of a pass being completed using various inputs about the start and end location of the pass, the length of the pass, the angle of it, as well as whether it is played with the head or foot.
Most applications have analysed the outputs from such models from a player passing skill perspective but they can also be applied at the team level to glean insights. Passing is the primary means of constructing attacks, so perhaps examining how a defense disrupts passing could prove enlightening?
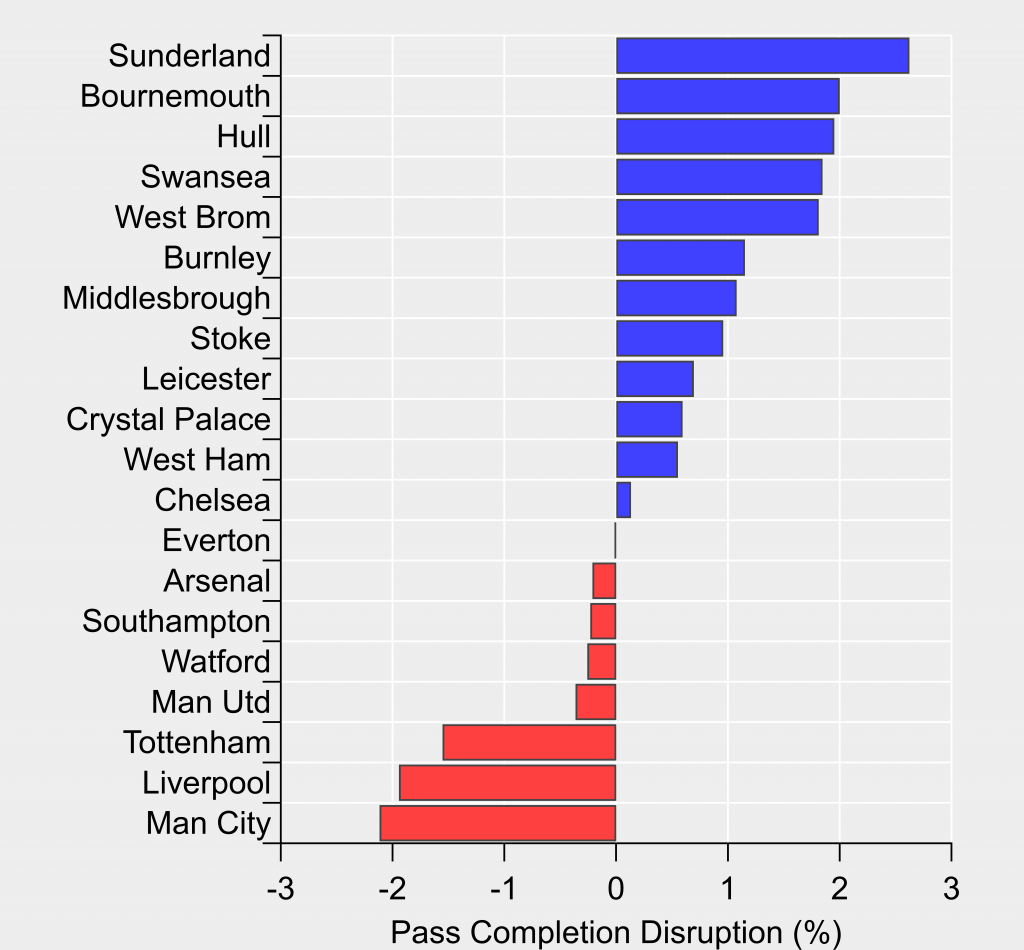
In the figure below, I've used a pass probability model (see end of post for details and code) to estimate the difficulty in completing a pass and then compared this to the actual passing outcomes at a team-level. This provides a global measure of how much a team disrupts their opponents passing. For 2016-17, we see the Premier League's main pressing teams with the greatest disruption, through to the barely corporeal form represented by Sunderland.
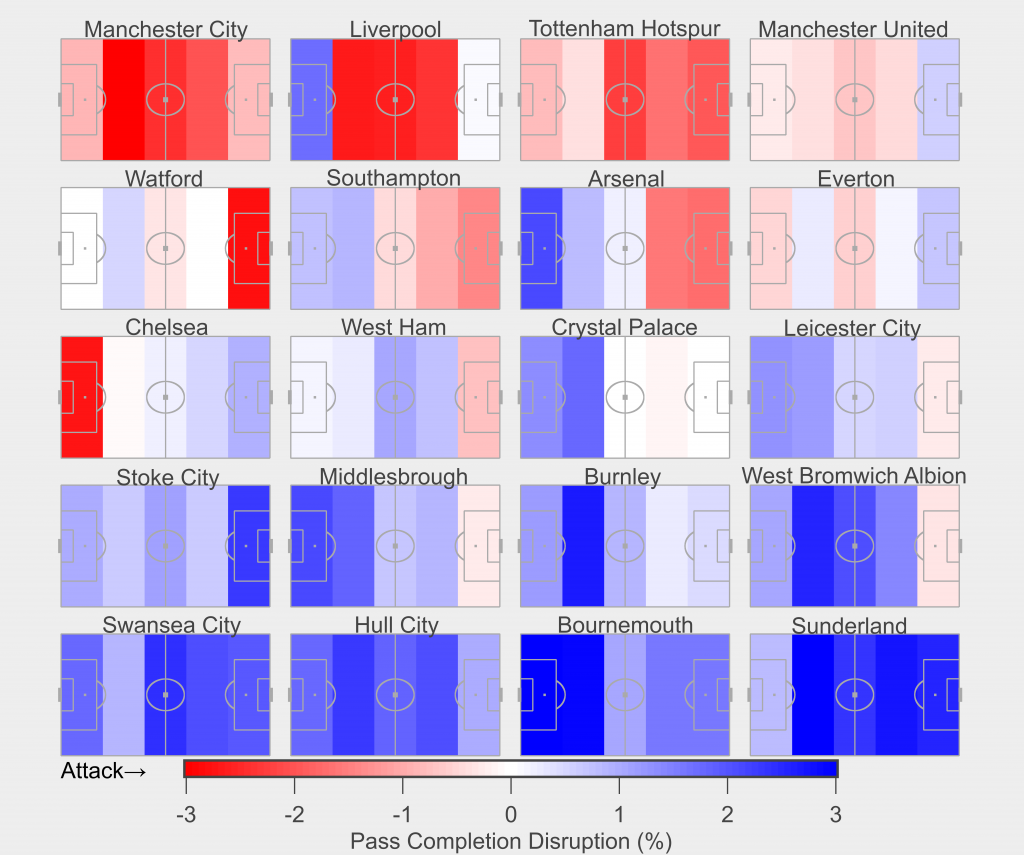
The next step is to break this down by pitch location, which is shown in the figure below where the pitch has been broken into five bands with pass completion disruption calculated for each. The teams are ordered from most-to-least disruptive.
We see Manchester City and Spurs disrupt their opponents passing across the entire pitch, with Spurs' disruption skewed somewhat higher. Liverpool dominate in the midfield zones but offer little disruption in their deepest-defensive zone, suggesting that once a team breaks through the press, they have time and/or space close to goal; a familiar refrain when discussing Liverpool's defense.
Chelsea offer an interesting contrast with the high-pressing teams, with their disruption gradually increasing as their opponents inch closer to their goal. What stands out is their defensive zone sees the greatest disruption (-2.8%), which illustrates that they are highly disruptive where it most counts.
The antithesis of Chelsea is Bournemouth who put together an average amount of disruption higher up the pitch but are extremely accommodating in their defensive zones (+4.5% in their deepest-defensive zone). Sunderland place their opponents under limited pressure in all zones aside from their deepest-defensive zone where they are fairly average in terms of disruption.
The above offers a glimpse of the defensive processes and outcomes at the team level, which can be used to improve performance or identify weaknesses to exploit. Folding such approaches into pre-game routines could quickly and easily supplement video scouting. ____________________________________________
Appendix: Pass probability model
For this post, I built two different passing models; the first used Logistic Regression and the second used Random Forests. The code for each model is available here and here.
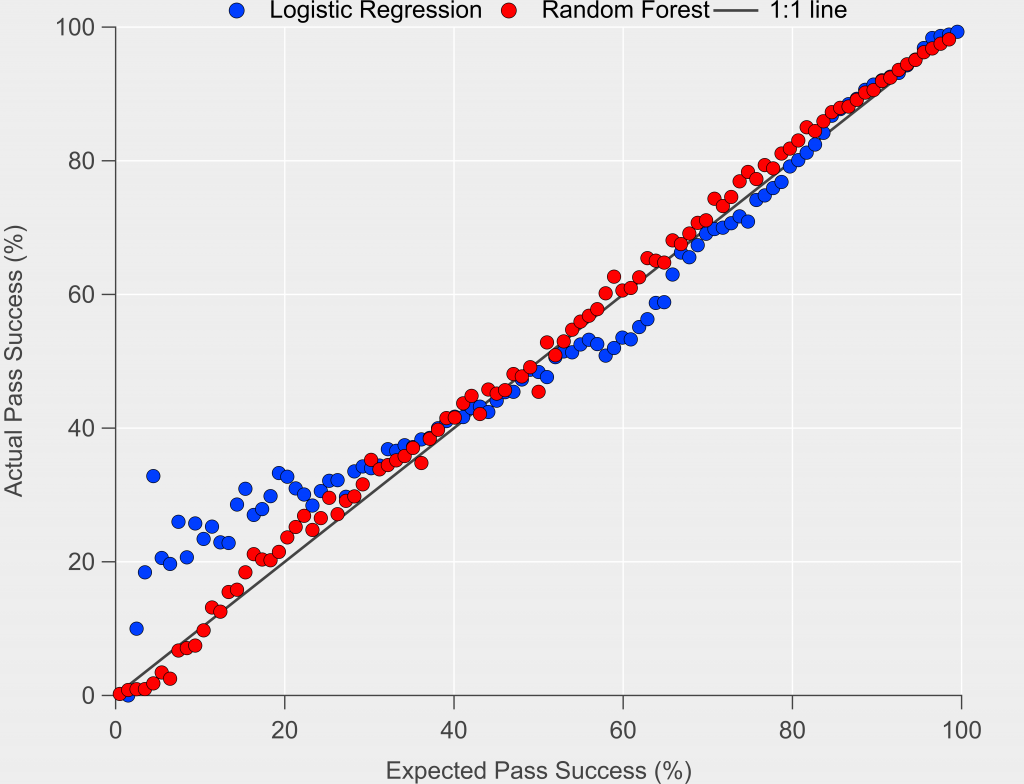
Below is a comparison between the two, which compares expected success rates with actual success rates on out-of-sample test data.

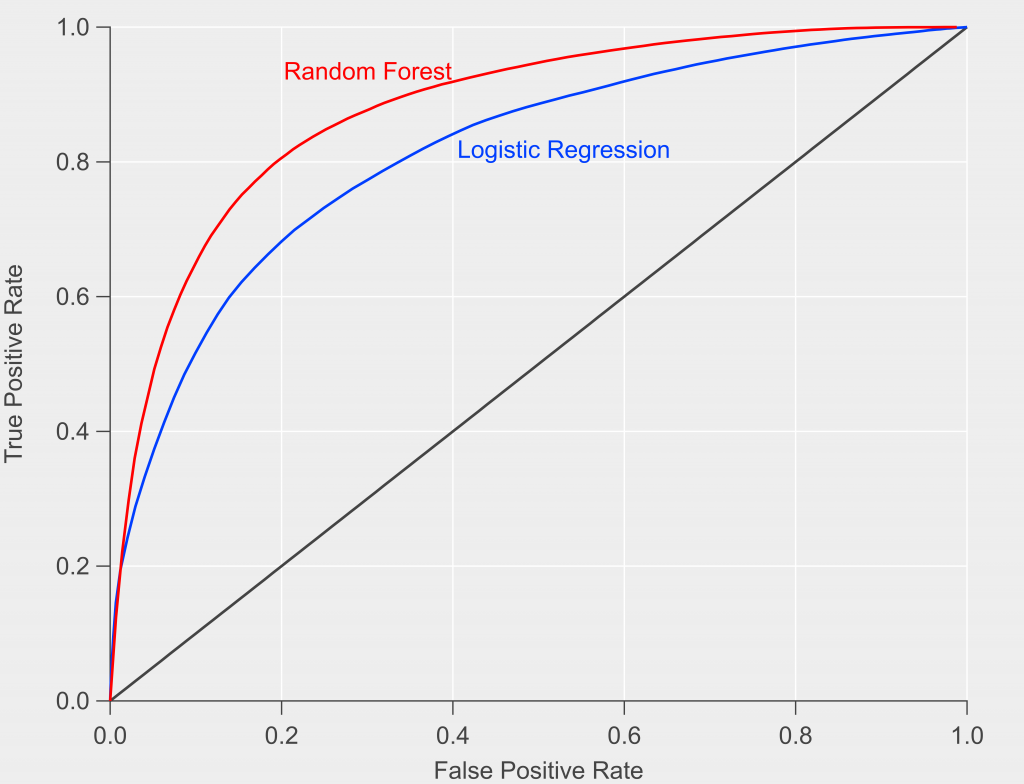
The Random Forest method performs better than the Logistic Regression model, particularly for low probability passes. This result is confirmed when examining the Receiver Operating Characteristics (ROC) curves in the figure below. The Area Under the Curve (AUC) for the Random Forest model is 87%, while the Logistic Regression AUC is 81%.

Given the better performance of the Random Forest model, I used this in the analysis in the main article.


