
Yesterday, in part one, we talked about how expected goals came to be. Today, we’re going to look at what StatsBomb is doing with it.
The way the world started using xG for single games, combined with the shortcomings of that usage, presents an awkward point. Given how the stat was constructed, and the way it works, we know a lot more about how it operates mechanically than we do about why.
Broadly, teams eventually score and concede roughly the number of goals they're statistically predicted to, but the day to day decision making and minutiae of managing a team, the actual process that results in goals and expected goals ending up close together is largely opaque. Hopefully, StatsBomb can start pulling back that curtain. And to do that, we need to talk about our favorite thing. It's data time (but not Lore, never Lore).
The Limited Eyesight of Data
Much of the work that goes into building xG models has to do with getting around the limits of the data available. Location is recorded, so is the body part used to take a shot, the kind of pass that led to the shot, any instances where the player dribbled around a defender, and a handful of other specific events. Still, using on ball data is like trying to figure out what's in a giant warehouse with a tiny flashlight. What you see in front of you offers clues as to what you can’t. But you’re still left doing guesswork to fill in the blanks.
Did the shot come after a fast attack?
If so that means the shot ends up being a little bit better on average than after a slow one. Why? Because the speed of the attack means that the defenders were likely less set and more likely out of position. Did the player dribble by the keeper before the shot? Well then that gets a big boost because that means the goal is most likely wide open. Was it from a through ball? Great, there are probably less defenders in the way, give that shot a boost. And on and on and on.
Clues in the data let analysts extrapolate out to what they can't see. Additionally one thing that data collectors have done to help build more data sets is use some sort of signifier to indicate if a chance is an extremely good one. Recognizing that nothing in the data set will distinguish particularly good chances from similar looking but mediocre ones, data collection leaned on creating a label that let everybody know
“HEY! LOOK OVER HERE! THIS CHANCE WAS REALLY GOOD!”
Tautologically, knowing that a chance was good helps xG models determine if a chance was good. It's also a bit of outside information being slipped into recorded data. Big chances aren't a depiction of what's going on on the pitch, rather they're a tiny bit of analysis used to supplement it, a recognition, and attempt to compensate for, the necessarily incomplete data. StatsBomb isn’t doing that.
We’re Going to Need a Bigger Flashlight
Rather than use a big chance moniker, StatsBomb is trying to do a better job including more information about every single chance created. To that end, StatsBomb data, as Ted Knutson talked about in his presentation at the launch event, records all sorts of stuff. One big difference is defensive positioning. Any defender on screen when a shot gets taken gets recorded. The same is true of keeper positioning and shot velocity. All of these are additional pieces of information that help illuminate what’s going on on the pitch.
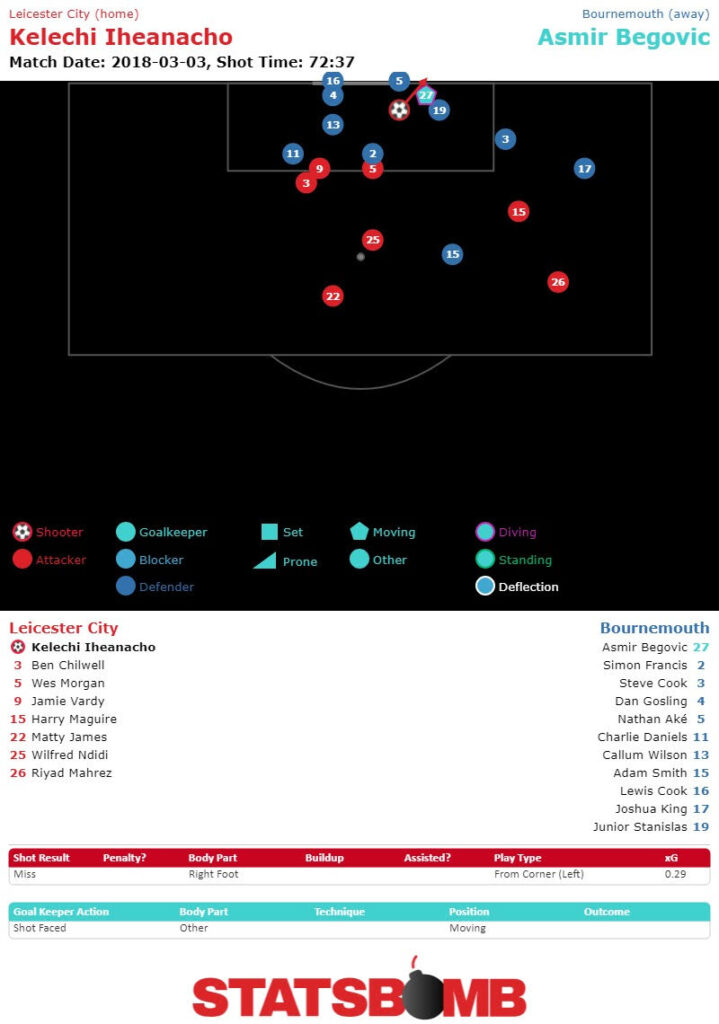
The reason to do this isn’t necessarily because it will make an xG model more predictive (though hopefully once there’s lots of data in, and the testing is done, and the smart people who do the number things are done doing their number things it will), but rather that SBxG (StatsBomb xG, get it? We're really good at naming things here.) will better describe reality. Let’s take an example. Back in March, Leicester City hosted Bournemouth.
In the 73rd minute, Leicester won a corner. After the ball ricocheted around, Harry Maguire managed to pass it to Kelechi Iheanacho, who had the ball on his right foot directly in front of the goal. Somehow he managed to put it wide. This is a chance it’s easy to rate quite highly. He’s right on top of goal, he’s got it on his foot, he had the ball past to him from nearby instead of reacting to a scramble. All pretty good indicators. Here’s what the shot looks like to a typical xG model. It ranked it 0.93.

Here’s what it looks like to StatsBomb.
And here’s what the play looked like to watch.
Pretty different. Should we do another one?
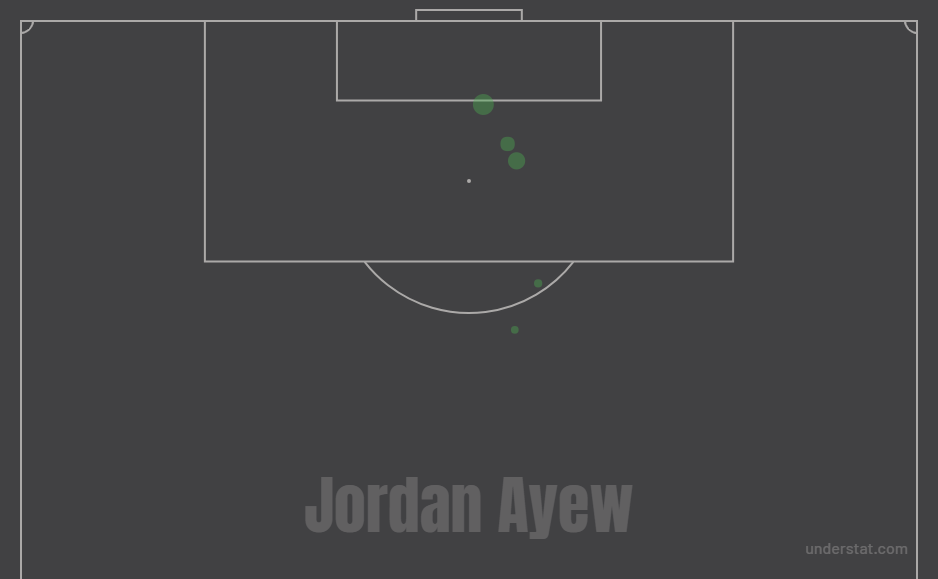
This one is from Swansea and Jordan Ayew. He scored from just outside the box away against Crystal Palace in late August. Here’s a typical xG evaluation. This particular goal is the little green dot at the top of the box. Seems like a pretty unlikely shot from distance. This xG model gives the shot a 0.06.
Now here’s the SBxG.
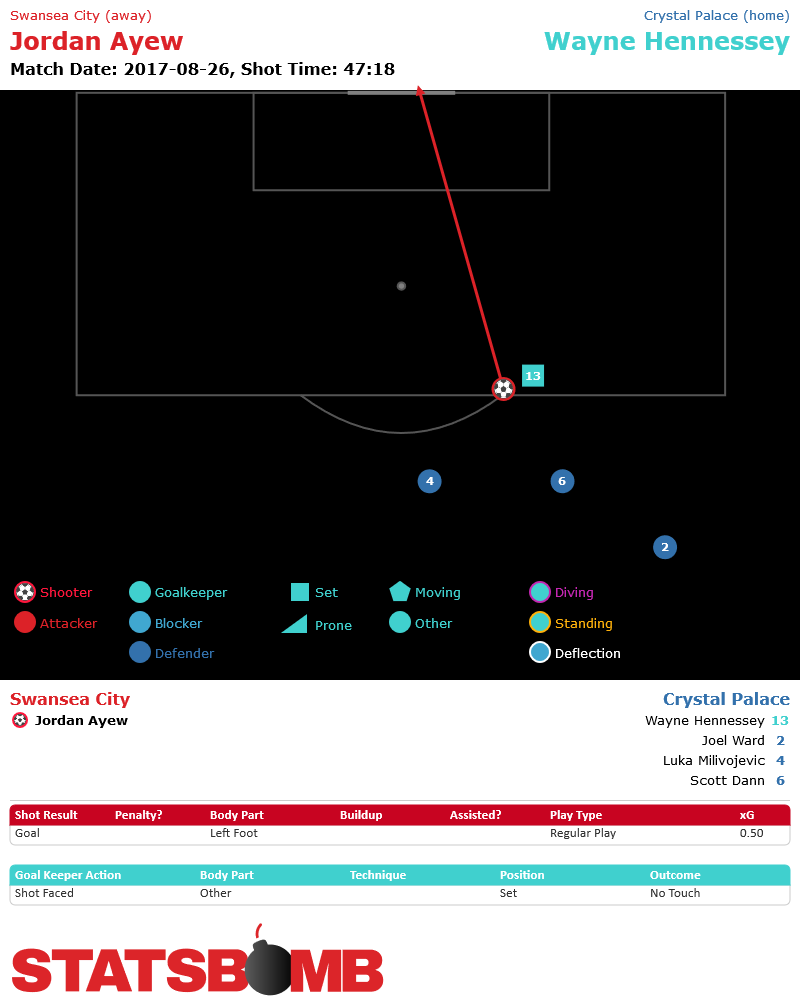
And here’s the video.
Seems like keeper location was pretty important for evaluating this shot.
SBxG and Cautious Optimism
Those two examples are unfair.
They’re extreme outliers, situations in which missing information, either on the keeper or on defender location are particularly damaging to a typical xG model’s ability to correctly measure a shot. In the grand scheme of things those shots are the exception, not the norm. Also, in the grand scheme of things those exceptions don’t particularly hurt xG’s ability to do the job for which it was designed. But, outliers are valuable to coaches.
They’re valuable to analysts, and they’re valuable to fans. And they're valuable to understanding small sample sizes like a single game. It’s pretty clear watching the tape that xG gets that Iheanacho shot wrong. It obviously misses the Ayew one. StatsBomb data picks up on that. Old data showed Bournemouth’s defense breaking down, and somehow avoiding conceding. Our data shows a Bournemouth defense standing strong in a difficult situation. Old data shows Ayew getting lucky from distance, scoring a low percentage shot that coaches would be happy to give up. Our data shows a dreadful defensive mistake.
This data is all new, so we’ve got a long way to go before we can actually make definitive claims about, well about anything really. But, the design is for StatsBomb data to be granular enough to describe chances as accurately as the vague moniker “big chance” while also giving a wealth of descriptive information about shots. It's impossible to say for certain what the future of using this data looks like. We simply don’t know how often examples like the ones above occur, or if they occur in measurably consistent ways. It’s possible that at the end of the day all this data doesn’t actually improve overall predictability much, but it improves precision a lot.
It’s possible it only improves precision a little, and in obvious situations like the ones above.
That is, rather than revealing something new, this data only confirms what close watchers of the game can see. That has value. It certainly has value for coaches looking to evaluate performances, or fans looking to understand what happened.
It’s also possible that as this data becomes more robust, and we have more games and seasons and leagues under our belts, patterns will start to emerge. Perhaps certain teams or players will stand out as doing something that fooled earlier xG models. Maybe the model will pick up on errors in defensive positioning more reliably, or be better able to quantify teams that pack the box. It’s impossible to know until the work gets done. The exciting thing is that now that all this new data is here, there’s finally something to do that work on. It’s too early to know exactly what goodies this data has in store for more robust xG models. But, it’s definitely time to get excited about finding out.