StatsBomb Data has been collected for League One 2017-18 and will be collected for the forthcoming season too. Last week we looked at some players who stood out via the numbers to examine how to get a starting point for player evaluation, so do check out that article if you missed it. This time round we’re going to look at some metrics that are part of or derivable from StatsBomb Data and discuss the results.
In The Clear
One of the major upgrades that StatsBomb Data incorporates is player positioning for all shots. Not just the shooter, but everyone visible within the “frame” of the shot for both teams. This Freeze Frame means that we are able to evaluate the pressure a player might be under at the time of shooting, whether there are blockers prevent a good sight of goal--for the shooter or the goalkeeper--or if a teammate was better placed or open, whether they made the wrong decision to shoot. The data is fundamentally objective too. We are not making a binary decision whether or not a chance is a certain size or simply counting players. We are mapping the location of the players. The potential for exploration within this part of the data is extensive and we are only scratching the surface here. Much more can be done whether you are a StatsBomb Data customer or enjoying the free women’s football data that we have made available. In this instance we are going to look at shots “In The Clear”. Definition: Shots where only the goalkeeper was in between shot-taker and goal, i.e: within a cone between the shot-taker and the goalposts. Open play shots only. Here are a couple of shots from League One top scorer, Peterborough's Jack Marriott, that qualify as in the clear: 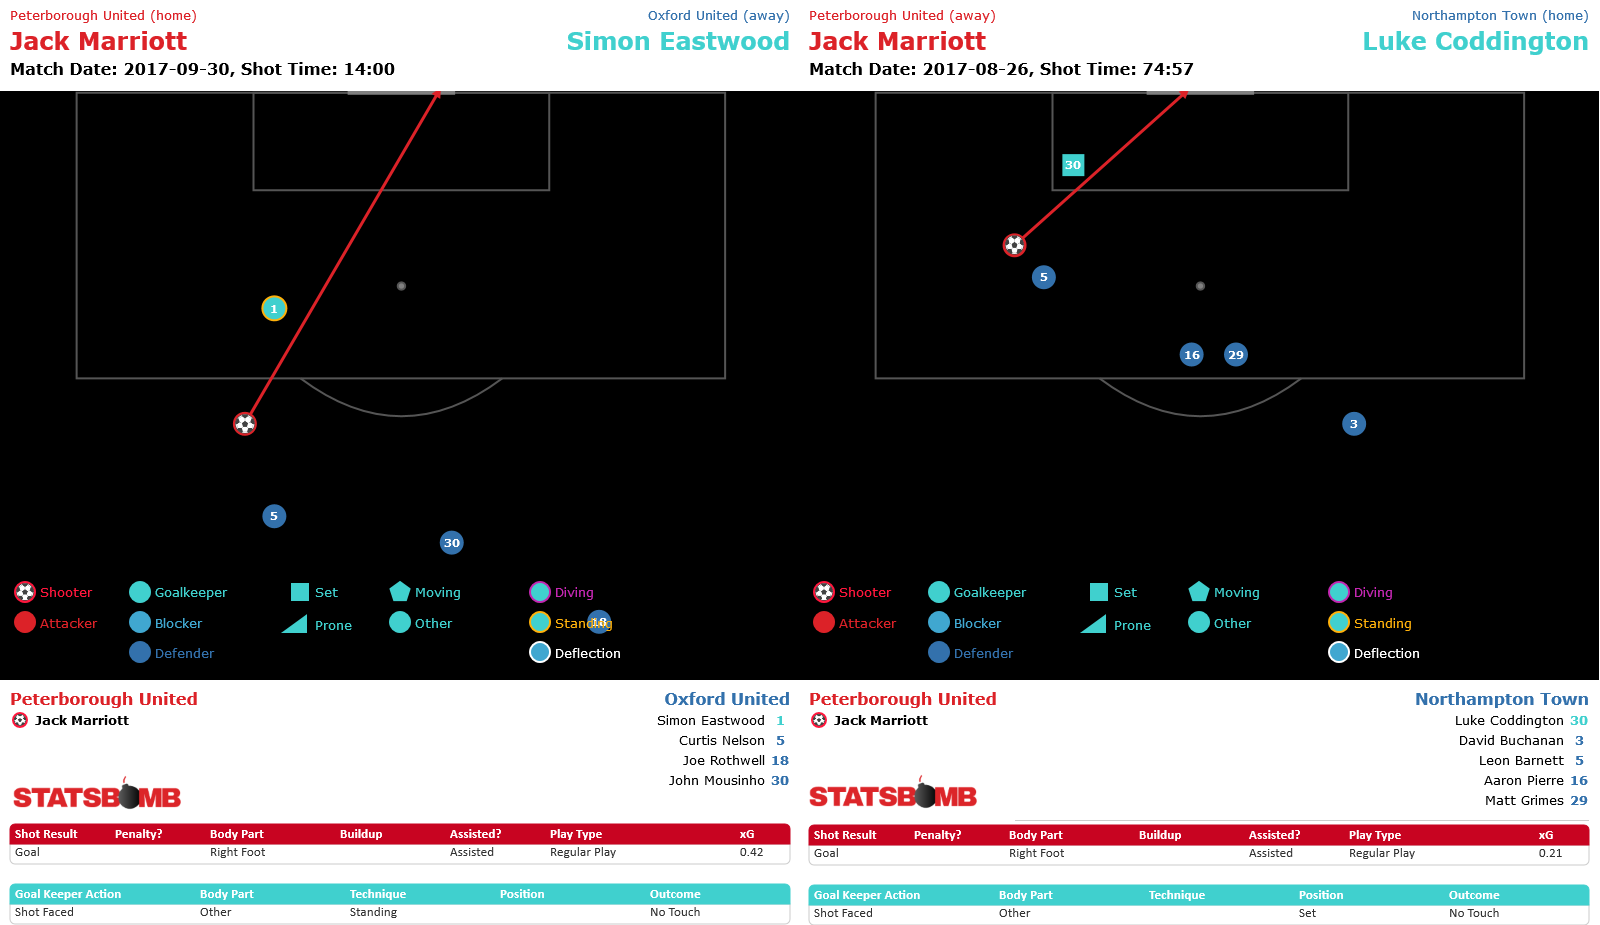 As we can see, the defence trails behind him and he's significantly ahead of his teammates--none of whom are in the frame. These are particularly obvious examples, but a free header would likely also qualify as would plenty of shots in which the player has made space for a shot quite normally. So how did League One shape up in total? Let's look at how many of each team's shots were In The Clear:
 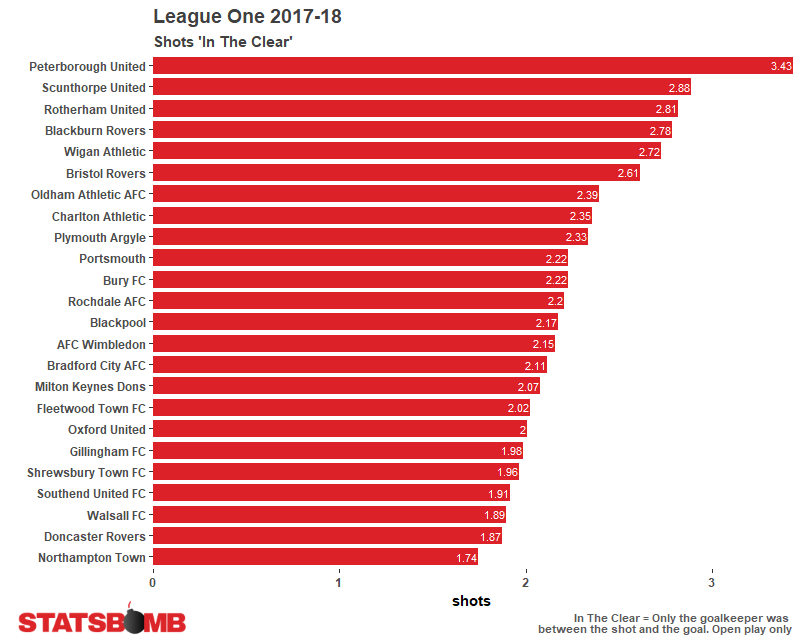 Peterborough (powered at least in part by Marriott) created the highest percentage of shots here, and in fact Marriott himself not only led the league for shot volume but also for in the clear volume too. Of the players with 100 shots or more in the division, the player with the highest percentage of in the clear shots was Ellis Harrison, the player with the lowest percentage was Nick Powell:
 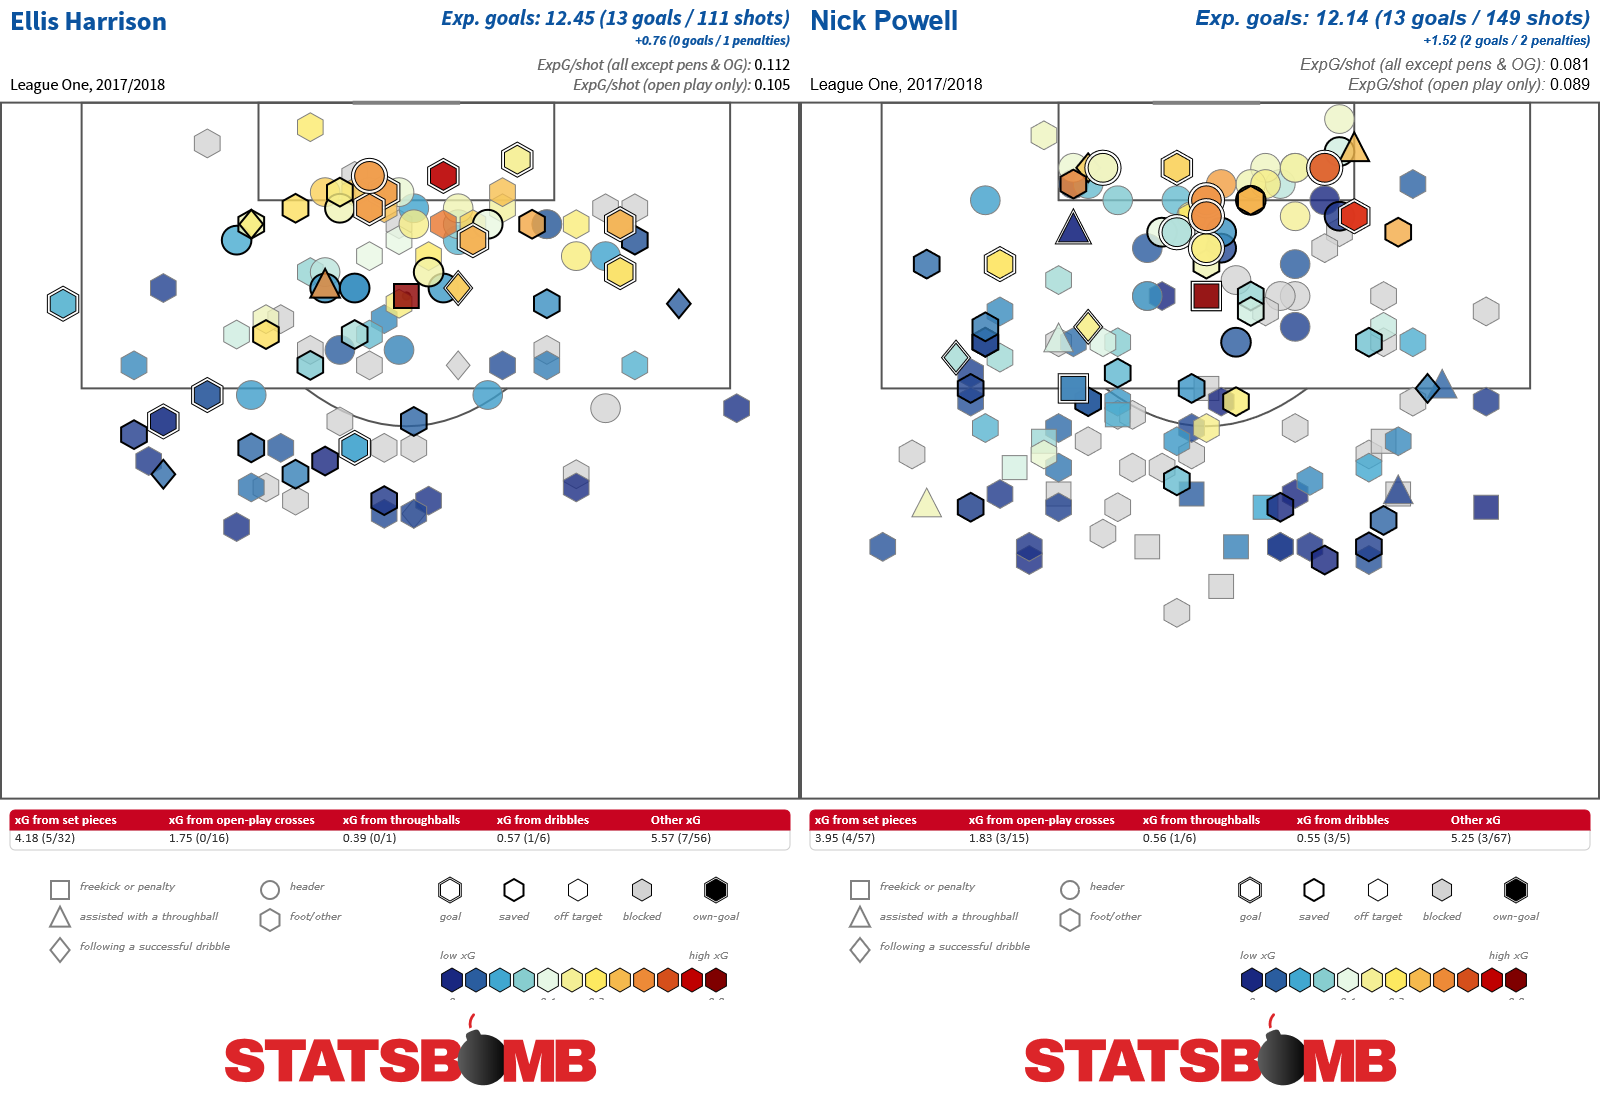 Visually the differences aren't hugely pronounced between the two players, but we know that Harrison took a ton more shots that were in the clear while Powell's total was augmented by lower value less clear shots from range. So we've added an extra layer to our shooting analysis, thanks to the information contained in the Freeze Frames. As mentioned, this is just a starting point but we have a great basic example of scalable data analysis that once enacted can be applied across an entire dataset, be that a single league or many.
Pressure in the opposition half
Pressure events are another unique aspect of StatsBomb Data for which there are many avenues of exploration ahead. Here we're going to take a straightforward look at events higher up the pitch in League One. The team that recorded the most pressure events in the opposition half of the pitch were the champions Wigan. This may be something of a surprise given they were also the team that recorded the most possession (54%) but it shows that their work rate was first class in the zones where it mattered for their attack: 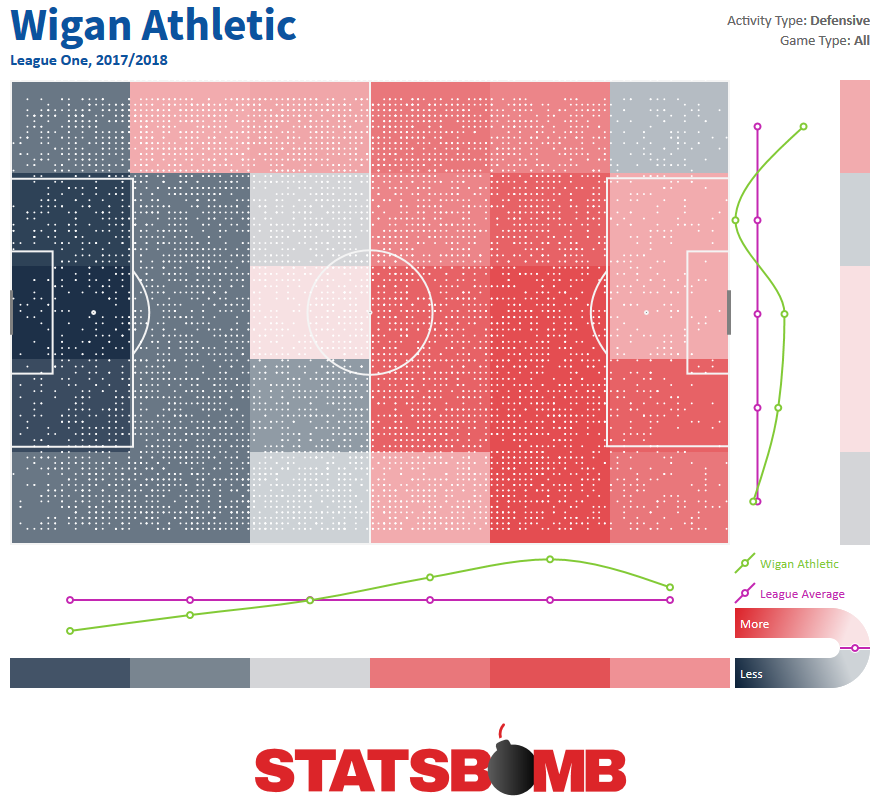 By way of contrast, Bradford City recorded the fewest pressure events in the opposition half in the division--over eight per game fewer than next lowest Oldham Athletic:
 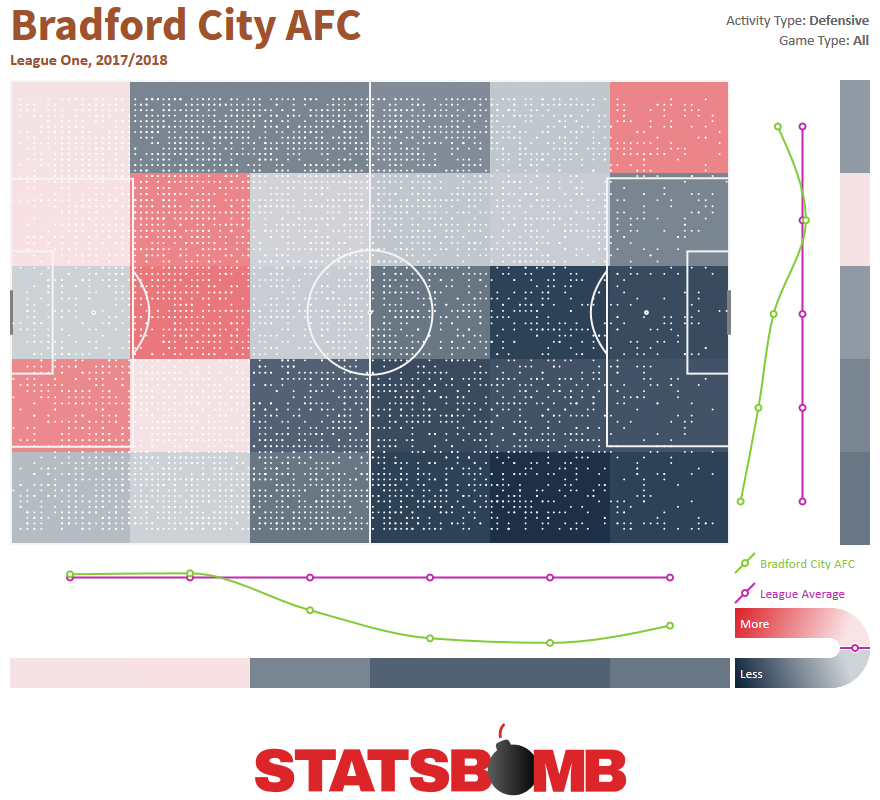 Their passivity extended over most of the pitch but perhaps crucially not within their own defensive zone. Overall, this less aggressive style did not appear to have had a strong negative impact on their performances as they landed squarely in mid-table in eleventh place. However, they offer a distinct contrast to every other team in League One in skewing so heavily away from pressure events up the pitch. In relation to players, a willingness to chase down the opposition can be a useful string to a forward's bow as Devante Cole found. He had a stellar first half to 2017-18 at Fleetwood Town, part of which meant that he led the league for opposition half pressure events per game:
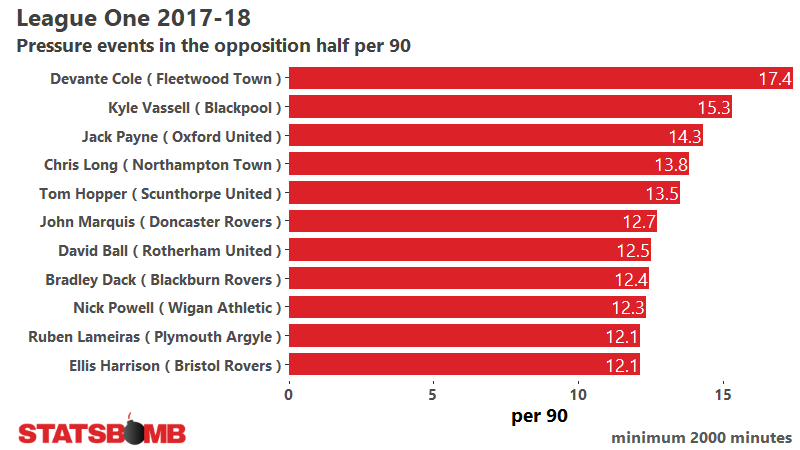
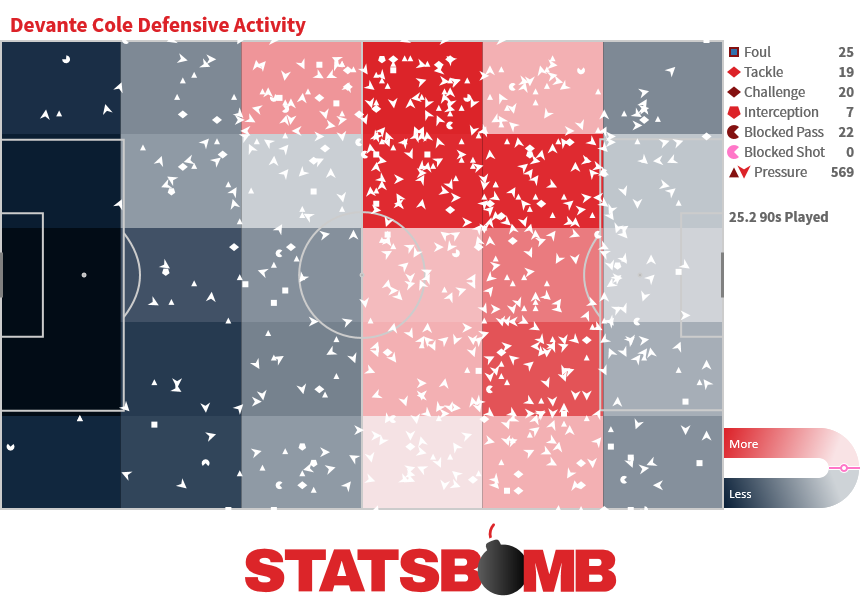 Exactly the kind of profile that might attract a team oriented towards opposition half pressing like Wigan... who promptly signed him in the January transfer window. Sadly for Cole, he only managed six all too brief substitute appearances for the champions in the second half of the season, but we can at least understand part of the thinking behind his signing--beyond the 10 goals he scored for Fleetwood. Expected Goals Lastly, a quick note about expected goals in the division. StatsBomb Data comes with expected goals values for each shot as part of the package so full player and team analysis can be conducted straight away using the benefit of our extensive knowledge in this area. There is occasionally talk that expected goals is a less reliable indicator in non-top divisions. However, using the StatsBomb xG model, we found that there were few surprises at the top of the League One table in 2017-18. The three teams most impressive via expected goals finished first, second and fourth and all ended up being promoted:
 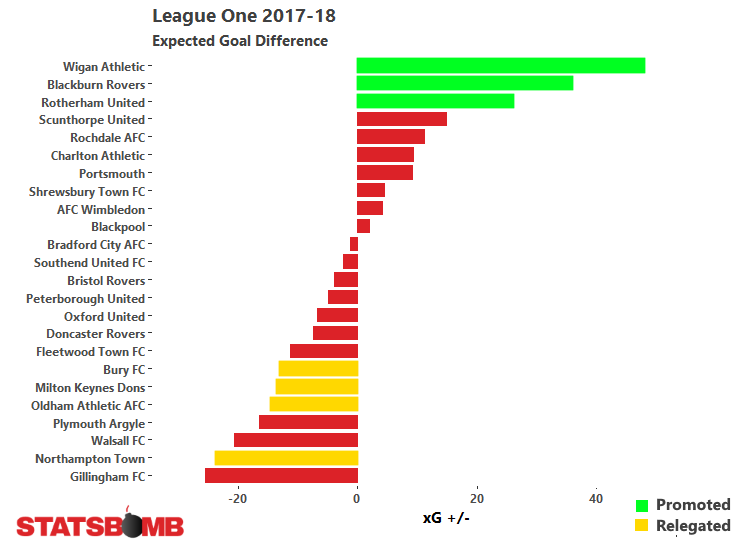 At the bottom of the table, four of the seven lowest ranked teams found themselves relegated, and perhaps Gillingham can consider themselves the biggest beneficiaries of a positive skew in their numbers. By landing 56 points they ended up two wins clear of the drop, yet in doing so overshot expectation by the greatest margin in the whole league:
 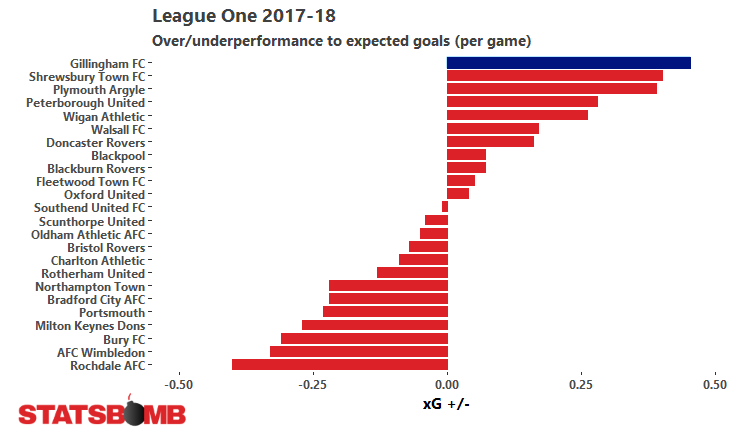 Plymouth were a team who had a season of two halves, 24 points before Christmas and 44 points after and they too look as though they benefited from a positive skew ahead of expectation. For both of these teams expectation ahead of 2018-19 may well need to be tempered, as the structural basis for their final 2017-18 positions indicate possible problems in the future--all things being equal--but it's best to know this ahead of time, rather than be surprised on the other side of any potential reversion.
StatsBomb will be collecting high quality data for the English Premier League, Championship, League One and League Two in 2018-19 as well as a host of other leagues. Get in touch with us via sales@statsbomb.com if interested or submit our online form. Thanks for reading part two of our look at League One. Part One is here, where we majored on players highlighted by the data. And ahead of the new season we have been tweeting out further highlights from last season's League One data here. Enjoy the new season!