
Since I introduced our versions back in January of 2014, radars have practically become the staple player visualisation for football data. I'm not sure if that's a good thing or a bad thing, but it's definitely a thing at this point, so here we are. If you are encountering our site or this type of visualisation the first time, this article represents a primer for understanding the latest version of the metrics and templates we use at StatsBomb.
Before we tuck in, if you want to understand a bit more about the design process and history of StatsBomb's radars, please go back to this piece published in 2016 for details. And for those of you who want to understand more about the weaknesses of this particular style of vis, which I knew about before I did the original design, and why we continue to use them, you should check this piece out.
For those of you who just care about the most modern versions... here we go.
The New New
Shortly after our data launch, I tasked James Yorke and Euan Dewar with revisiting all of our radars with an eye to what metrics were mostly bad and needed to die, and what metrics we could replace them with from StatsBomb Data.
The reason for the change is pretty obvious - old radars were built on a different data set and therefore have different boundaries and metrics to display. The idea behind the update was to unlock new things like Pressure, while adding some extra utility that we have used on the consulting side for a while (Turnovers and Deep Progressions in passing come to mind).
What flowed from that was an extensive revamp of all positional templates and the generation of a new Attacking Mid/Winger template. I'm going to break down the new stuff in each template with relevant examples and explanations along the way. I will note that these new templates are still effectively in beta. The last versions of radars only existed as stable forms after years of testing and daily use. The new ones will potentially change based on our own use, customer feedback, and new advances on the data science side.
Strikers
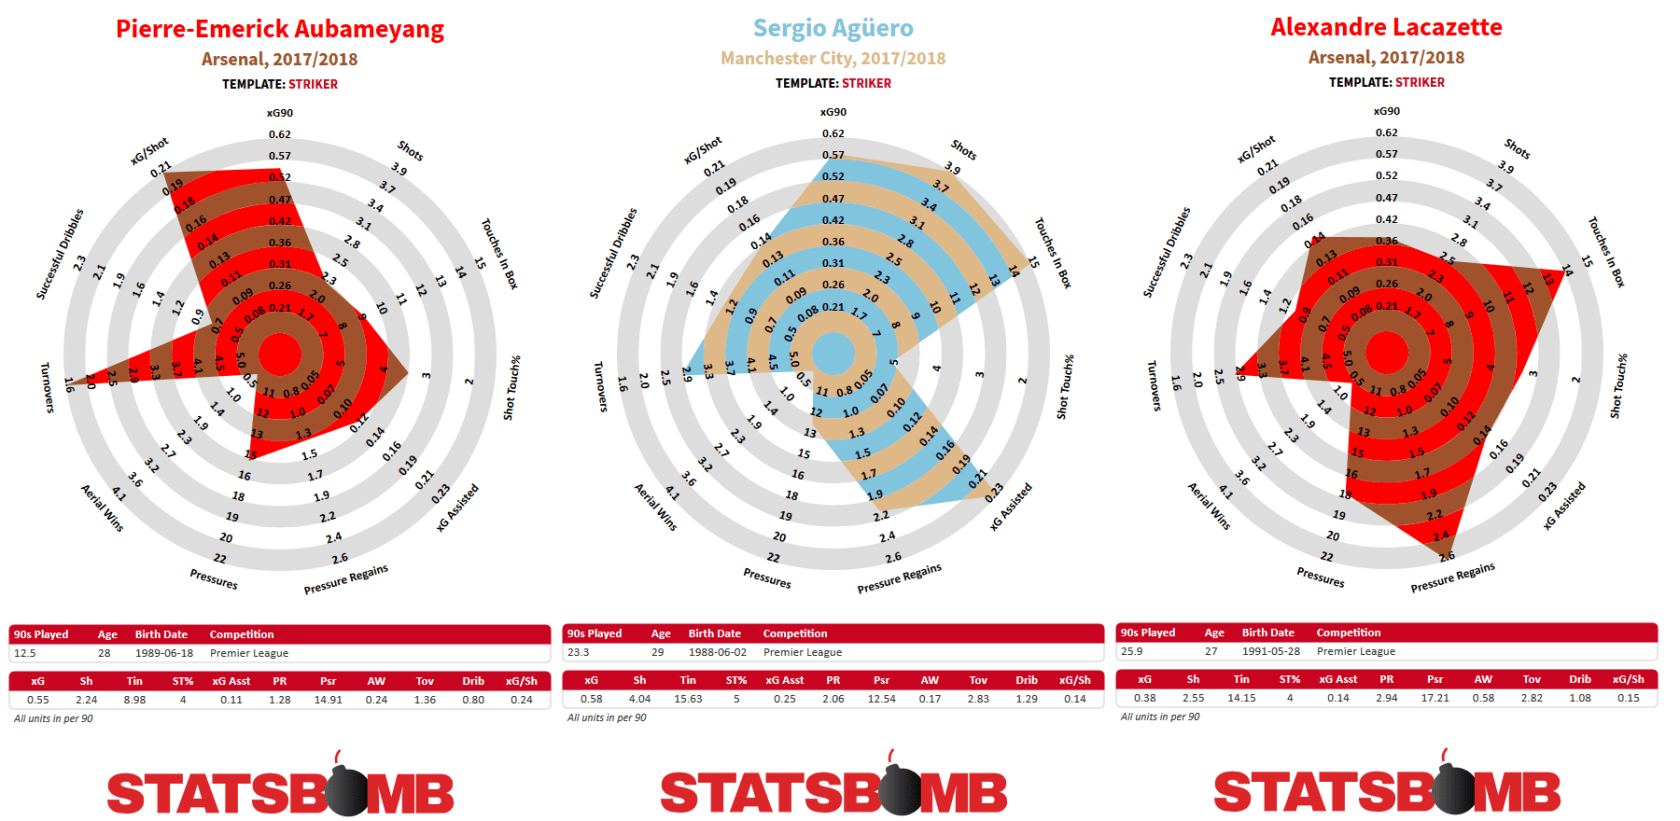
There are a number of new metrics in the Striker template:
Shot Touch% - The amount of shots a player takes as a proportion of their touches of the ball.
Pressure Regains - Times a player’s team won the ball back within 5 seconds of the player pressuring an opponent, per 90 minutes.
Pressures - The number of times a player pressures an opposition player per 90.
Aerial Wins - Number of aerial duels a player wins per 90 minutes.
Turnovers - How often a player loses the ball via a miscontrol or a failed dribble per 90 minutes.
We've brought back some defensive metrics, but more in the form of pressure and pressure regains instead of the traditional tackles and interceptions. Pressure from the front is a big part of the modern game, and the new data better reflects work rate in that area than traditional metrics.
Two stylistic metric changes here are Aerial Wins and Shot Touch %. Aerial Wins is meant to provide a good indicator of whether a forward is good/active in the air. It's contextual, but in a way many teams still care about. Shot Touch might be the new metric I am least certain about, partly because there are multiple ways to interpret it.
In some cases, it provides an efficiency indicator as to whether a striker is good at turning balls targeting him (or her) into shots. In other ways, it can also provide an indicator as to how involved in buildup a forward is, or whether they simply shoot every time they receive the ball. We'll likely revisit that metric in the coming months.
Attacking Mid/Winger
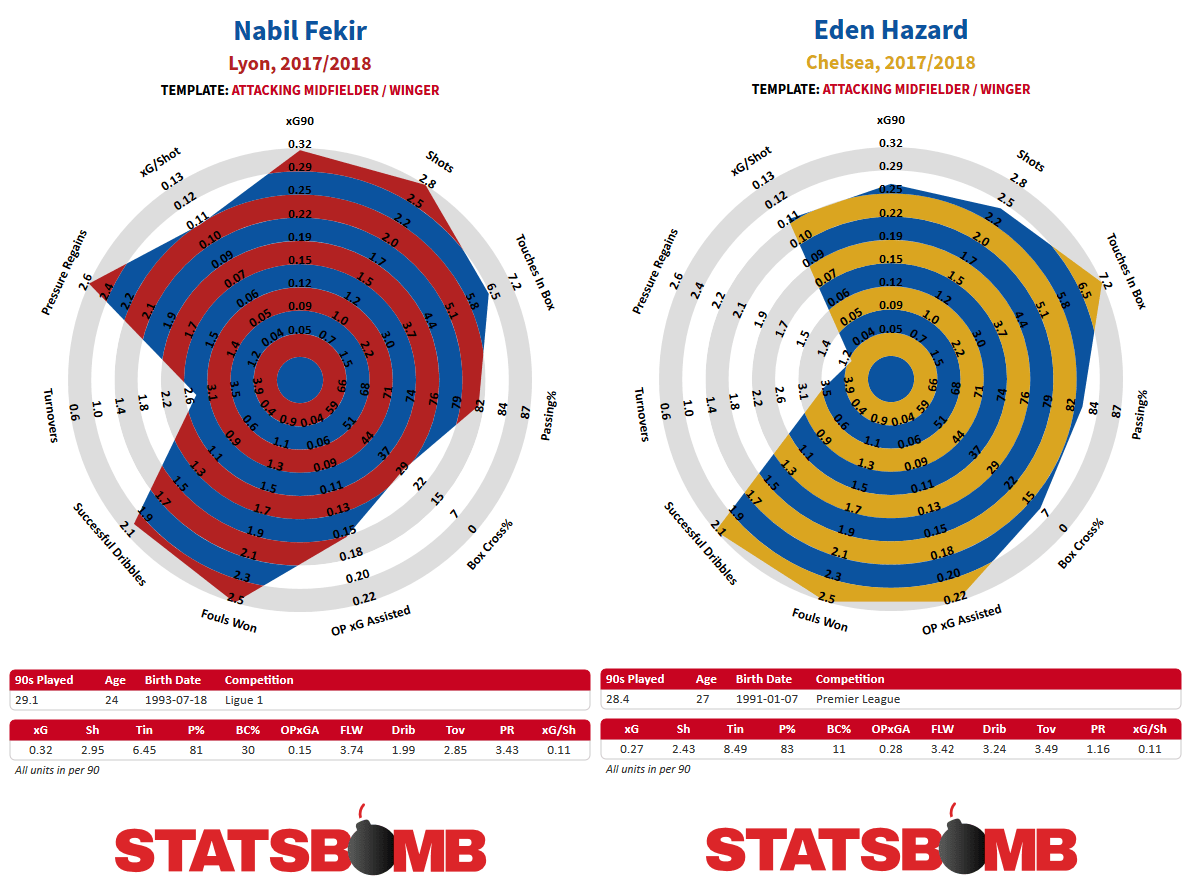
This is the new template that bears some resemblance to the old "forward" template while adding a lot more information on essentially what type of non-striker attacker a player is and how good they are at their job.
New metrics not already discussed above are:
Box Cross% - What percentage of a player’s completed passes into the box are crosses.
Fouls Won - How many times a player is fouled per 90 minutes.
We felt it was time to separate out Strikers from the rest of the primary attackers and this is the template we landed on. For those who are wondering, we did investigate adding Set Piece xGAsst to this and other templates, but it's such a low volume event for most players it didn't really make sense to add it here. It's the type of extra information you would want to investigate, but not a big enough deal for most players to comprise a primary spoke on a template.
Midfielder

Of all the old templates, I think this was the one I was generally happiest with. Good Defensive Midfielders pop on the left side of the vis, good Attacking Mids on the right. Simples.
I feel like we've kept that spirit here while incorporating valuable new information.
New stuff looks like this:
Deep Progressions - Passes, dribbles and carries into the opposition final third per 90 minutes.
xGBuildup - The xG of possessions a player was involved in outside of shots and assists
Turnovers - How often a player loses the ball via a miscontrol or a failed dribble per 90 minutes.
Pressure Regains - Times a player’s team won the ball back within 5 seconds of the player pressuring an opponent, per 90 minutes.
Pressures - The number of times a player pressures an opposition player per 90.
Fullbacks
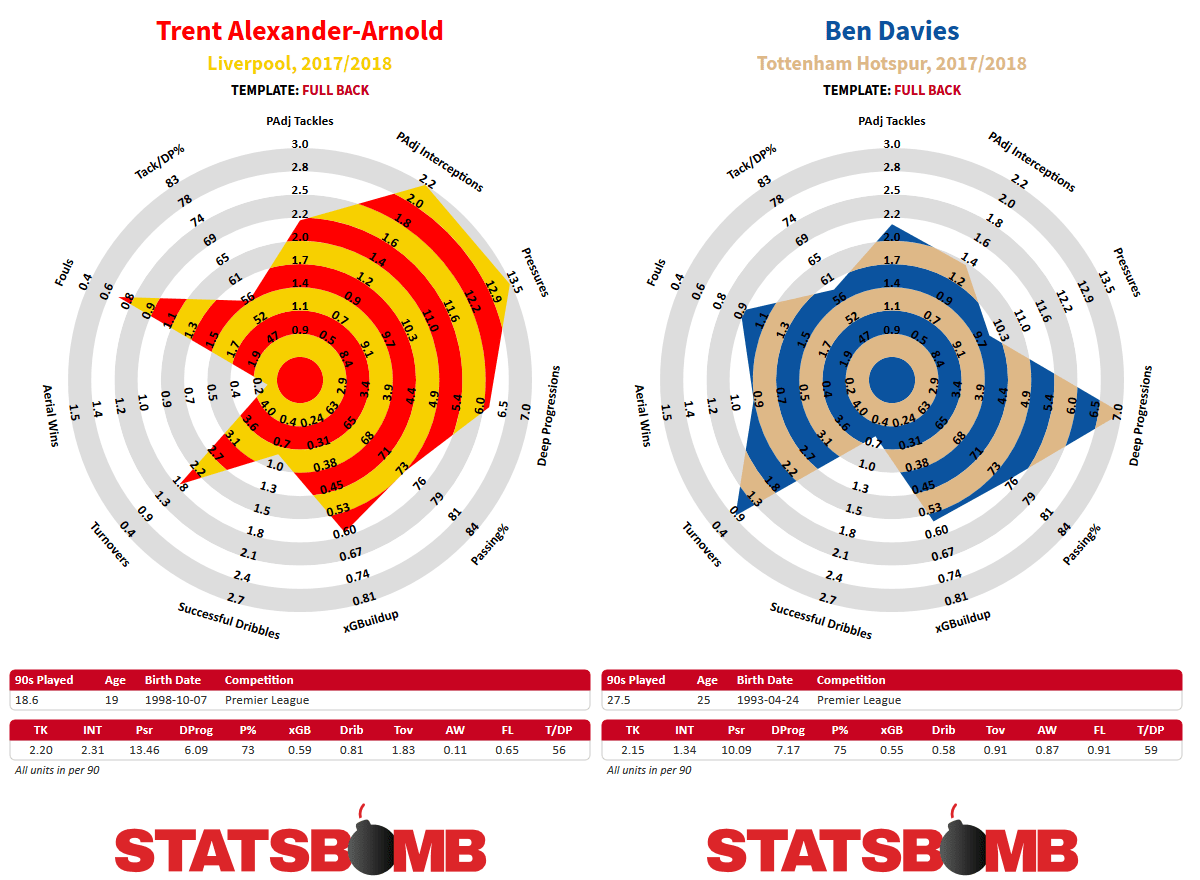
Fullbacks might be the most interesting position to try and profile via data. Their roles are hugely system dependent... are they attackers half the time? Wingbacks? Pseudo-midfielders? Strictly defensive? And yet if you know what you want them to do, they light up like Christmas trees statistically. My guess for why this occurs is because the role is incredibly demanding both physically and technically.
The only new adjustments to fullback radars are Deep Progressions and Pressures, but it's come at the cost of crossing stats, which many found very valuable. We will be keeping an eye on this one going forward, especially with regard to customer feedback
Centre Backs
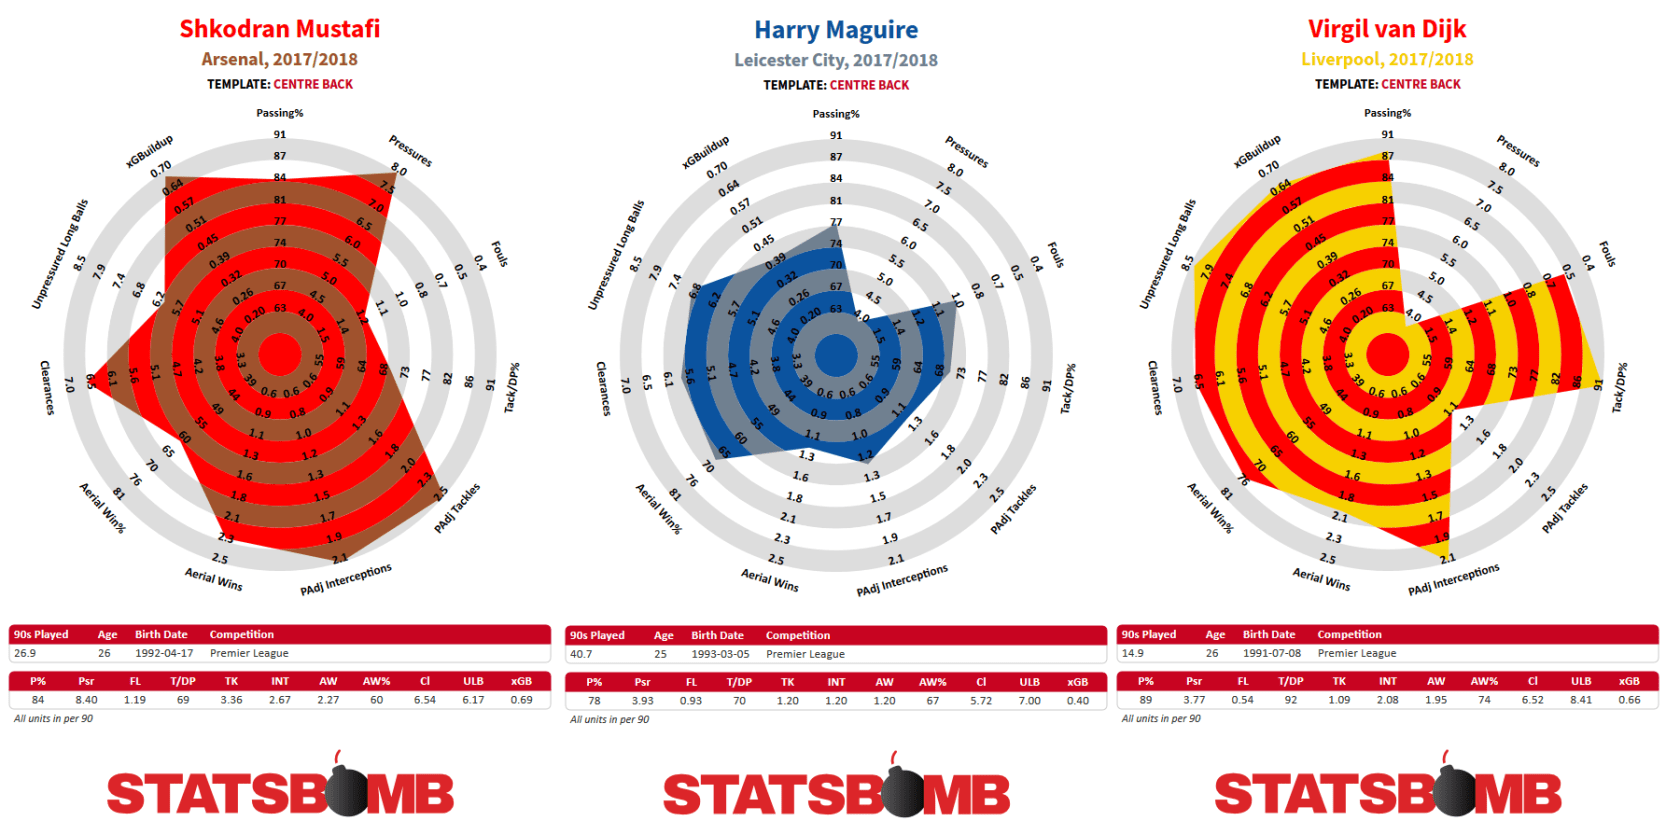
Because of how tied center back stats are to the tactical style they are asked to play, CB radars are generally less useful than the other templates. We use these mostly to profile style of defender, and then do a lot of scouting to analyse quality.
Clearances - Times a player makes a clearance or plays a long ball while under pressure per 90.
Unpressured Long Balls - Number of completed long balls while not under pressure per 90.
TL;DR Use with caution.
Passing Ability Model
Improved components we added to the passing model:
- Right/Left Footedness
- Under Pressure?
- Intended Recipient
- Pass Height
- Back Heel (this is huge, obviously)
Things we subtracted from the passing model:
- About 20 million open play passes.
Sooooooo...
The Passing Ability Model is currently on hiatus due to small sample size on the new data set and the metric on the radar spokes has been reverted back to basic passing percentages.
This is unfortunate, but StatsBomb Data completely breaks the old model in myriad ways that allow us to do MASSIVE upgrades to the model in how we evaluate the context around player passing... once we have enough data. The current plan is to try and collect some past seasons this year in the big leagues as well as going forward to help bolster sample size, and then rebuild the model entirely on the new data set in spring 2019.
Future Design Notes
We're working on some metrics in data science that I think are a big deal, but won't be ready for a few months yet because they require some serious research to do correctly. We'll look to incorporate that research toward the end of the year.
As part of the new GK Data module due in StatsBombIQ soon is also a threat from data scientist Derrick Yam to produce GK radars, but I'll believe it when I see it.
The other thing I noticed as part of the design process this time around much more than in the early days of radars is that eleven spokes on player radars felt super restrictive. This is mostly attributable to how much our understanding of the game and player skill sets has advanced over the last four years, but it also indicates a need to incorporate additional info as part of the basic visualisation set going forward. Exactly HOW to do that is a design challenge we'll be tackling for customers in IQ before the end of the year.
It's hard to convey the amount of new work that went into something that seems "old" now, but I hope you all enjoy the results.
