A lot of ink was spilled last season on why these two teams were breaking expected goals models. Between them, the two sides conceded a shade under 90 expected goals but just 63 non-penalty goals: about 1.4 times better than we’d expect.
We’ve had a lot of theories emerge about why this situation might have arisen. In United’s case, the thinking has mostly been around David de Gea, goalkeeping superhuman. As for Burnley, there has been some talk of the keeping exploits of Tom Heaton and Nick Pope, but the assumption for the most part is that their superior ability to get bodies behind the ball in a compact shape means that xG models are overrating the chances they concede.
Cut forward a few months and the two sides together have conceded 15 non-penalty goals from around 11.5 expected goals.
So what’s happening? Is this just regression to the mean after a year of surprising overperformance? Is everything actually fine, and this is just a weird small sample size? Has something actually changed at either club? Let’s take a closer look.
Manchester United
On the face of it, it’s hard to see what has changed for United. The manager is the same, the players are the same, save for Fred, who has been the side’s most aggressive presser off the ball without offering an awful lot on it. The system is still the same 4-3-3 that Mourinho adopted in the second half of last season, and it’s still producing around the same numbers it has been for all of this calendar year.
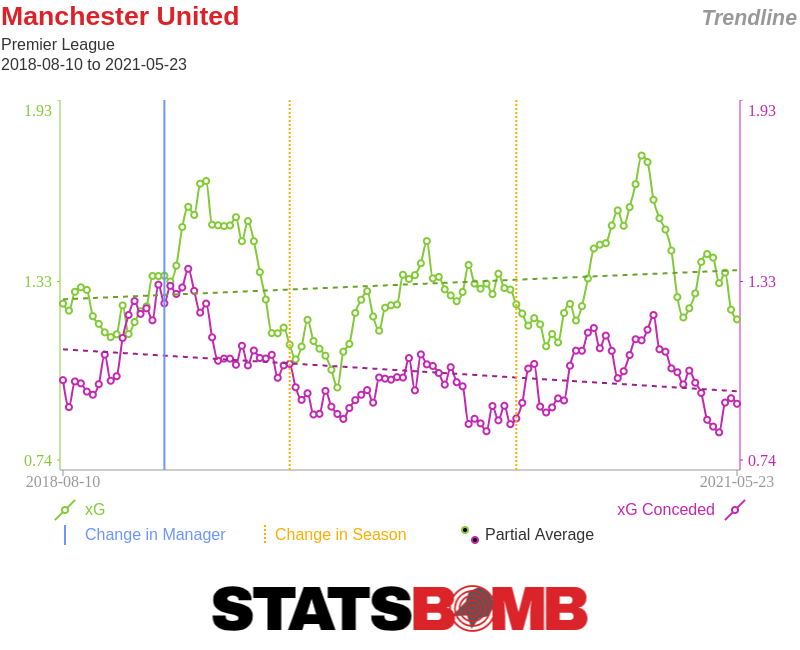
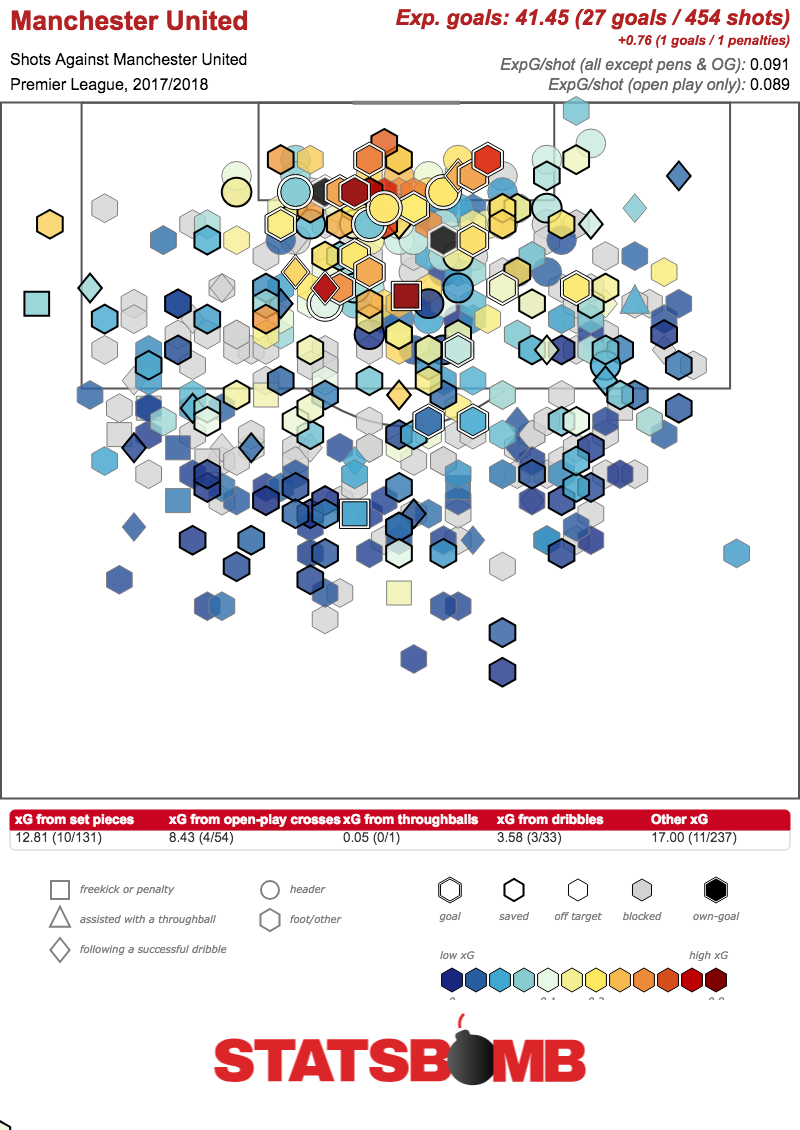
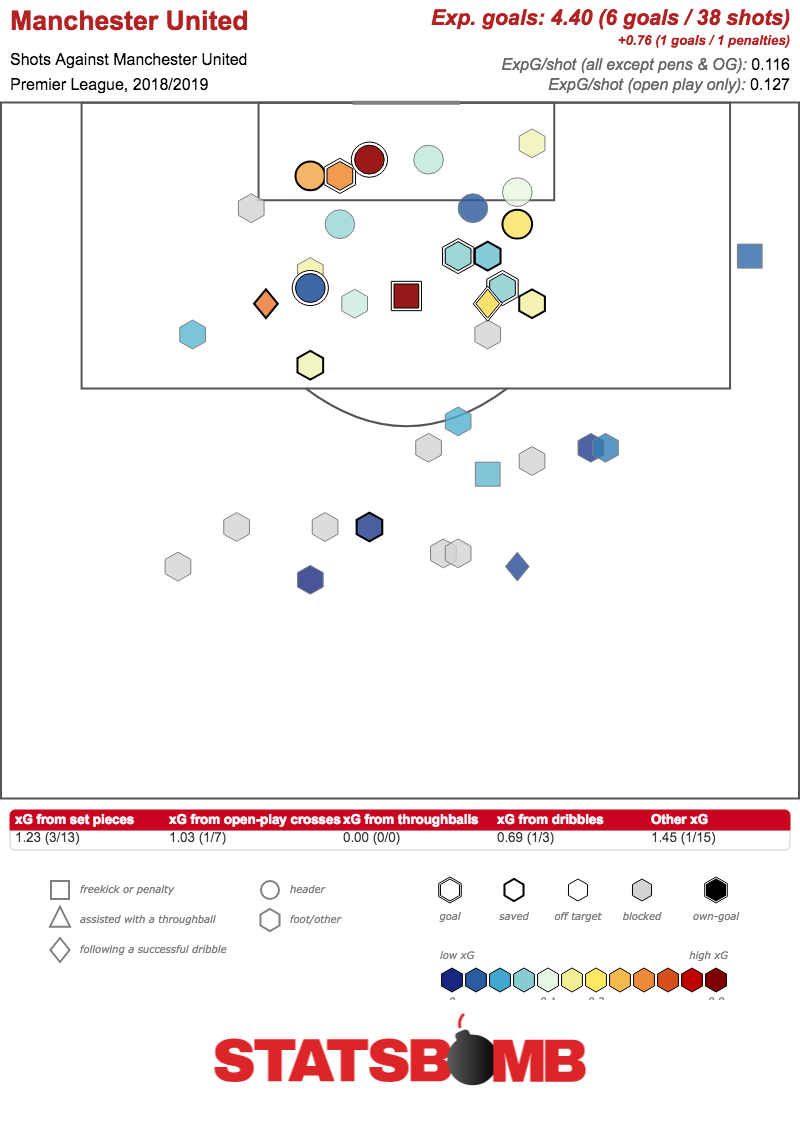
So, is anything different? It requires a touch of squinting, but there are some small differences that, if we’re being very generous, could have contributed. Even though the xG conceded per game is almost identical this year (1.10) to last (1.09), the xG per shot has risen from 0.09 to 0.12. The team are conceding about 2.4 shots fewer per game than last year, but those shots are a full third more likely to be scored. As to why that is, the early evidence suggests the side’s pressing profile has changed somewhat. United have completed 211 defensive actions per game, barely any different to last season’s 216, but the areas of the pitch where they choose to engage have shifted. In the final third, the team are now making around 43 defensive actions per game, a subtle increase on last year’s 40. In their own defensive third however, so far there has been a noticeable drop-off, going from close to 85 defensive actions last year to 68 now. This is a higher pressing United than last season. As such, it’s not a surprise to see a different profile of shots conceded, with high pressing systems generally associated with excellent shot suppression but the risk of giving away the odd very dangerous chance.
The other big question at Manchester United is around David de Gea. Consistently an above average keeper, albeit with an off the charts year last season that was surely unsustainable, De Gea has experienced some challenges in recent times. Following a World Cup with some high profile errors, De Gea has yet to find the groove of previous seasons. What might be notable here is that Spain were very much a high pressing side, one that conceded a low volume of shots per game (7.5) with a fairly middling xG per shot (0.10). It’s not that De Gea isn’t capable of performing well in a high pressing side. His excellent form under Louis van Gaal shows that he’s more than able to be a top goalkeeper in such a system. It is possible, though, and we’re definitely in straw clutching territory here, that a fairly sudden shift in the kind of shots he’s facing has caused disruption. He likely needs to take up starting points further off his line, and generally position himself differently to what his instincts might be. It’s also not inconceivable that a decrease in defensive pressure in United’s own third means that the shift in shot quality is actually greater than the model is indicating, and that the side were actually doing things that the numbers weren’t picking up on last season. The most likely scenario, though, remains simply that these are the early signs of a predictable regression, and we will need to see these trends continue for longer before making any bold claims.
Which brings us to another, slightly smaller, club in the North West…
Burnley
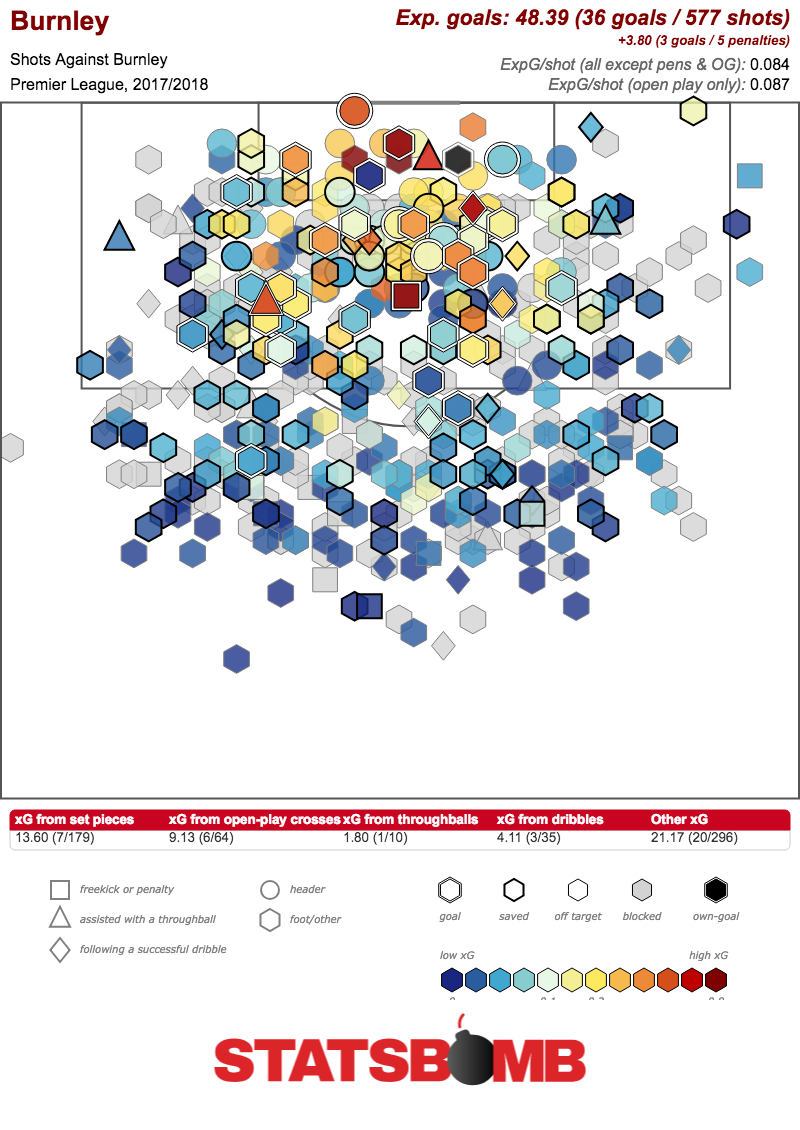
You can’t talk about beating xG without talking about Burnley. Their significant overperformance last season wasn’t even particularly out of line for them, and for some time now there has been talk that “Sean Dyche is a warlock”, such is his team’s ability to defy the models. The received wisdom in football analytics has always been that the side get a greater number of bodies behind the ball than average, making them better able to block shots (which they do a lot of) or just make it more difficult for the attacker to place his shot properly. That StatsBomb’s expected goals model, which takes player locations when the shot took place, did not rate Burnley’s defence any higher suggested this was in doubt, but it certainly felt as though something was happening. Underlying numbers fluctuated throughout the season and yet, save for a lull around midseason, results kept coming for Burnley last year.
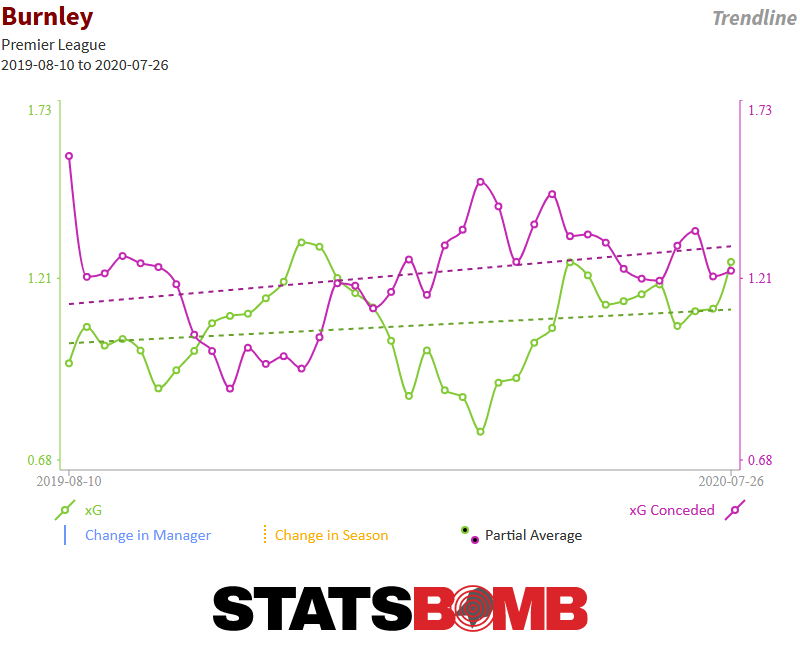
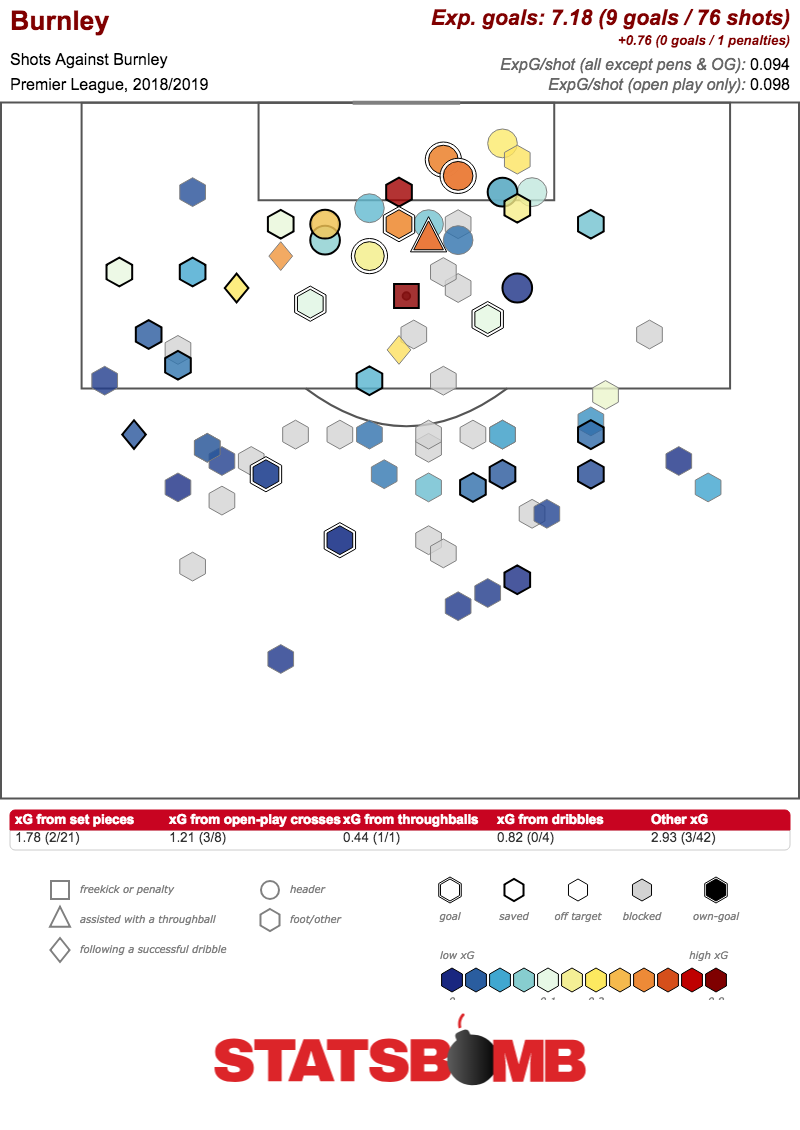
Currently, the side is on one point from four games, having scored three and conceded nine. The defensive magic that saw them invulnerable to xG has apparently dried up. Those of you who were sceptical that Burnley ever had anything sustainable in this regard will probably point to this again as the start of a simple regression, and you may have a point. The contingent who argued that Tom Heaton and Nick Pope were both simply goalkeepers who had fantastic seasons will look at Joe Hart’s less than stellar record and identify his arrival as the problem. Again, they may well have a case. But if there is an alternate reason, and it is a stretch to say that there is, it might be as follows. Burnley were an aggressive pressing side all over the pitch last year, but especially in their own half, as we can see from all the red on the defensive activity map:
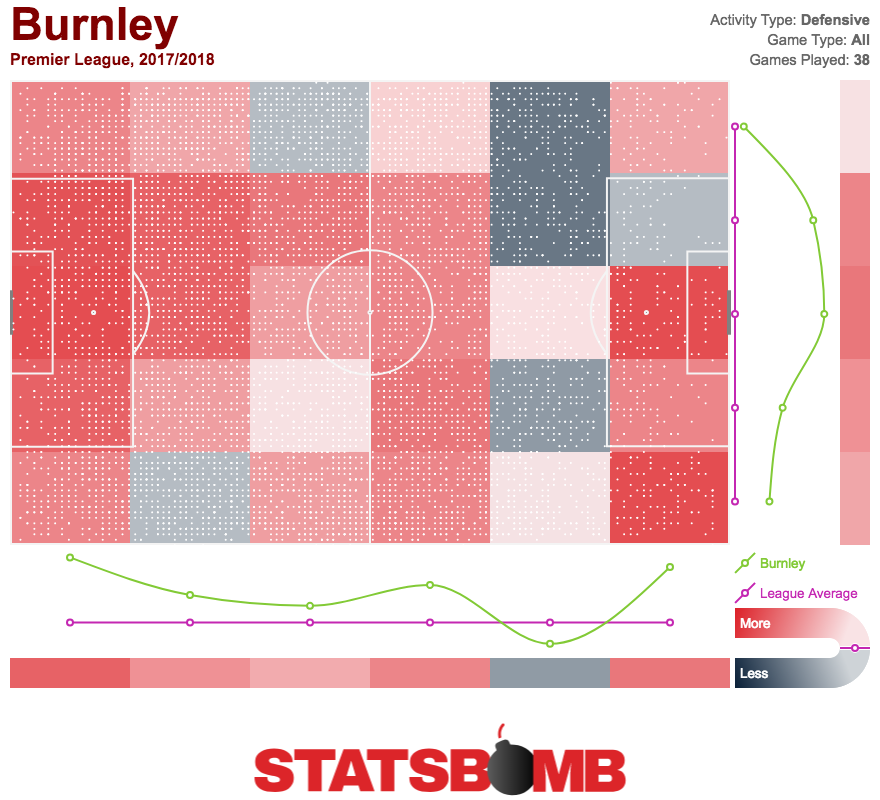
Burnley on average made 220 defensive actions last season, while this season it is a small drop off to 198. What more, these actions in Burnley’s defensive third are down from 92 per game last year to 67 now. Burnley’s defending right in front of their own goal is a step less aggressive. We can see this elsewhere. Last season, Burnley managed to block 36% of the shots they faced, in what was a very important part of their defensive game. This year, that figure is 28%: not a dramatic fall, but still a less impressive figure. This may be just normal fluctuation from a sample size of just four games. It may be a fitness issue, with the Europa League fixtures causing trouble (a problem that will not recur, with the team failing to qualify for the group stages). It might be a deliberate stylistic shift. Again, we will have to wait for a larger sample in order to have any confidence.
Conclusion
It needs to be said that we’re four games into the season. This is nowhere near enough to make any grand, sweeping statements. Put it this way: we had a whole season of data last year and people still aren’t convinced what happened wasn’t a weird blip that would even itself out over time. Nonetheless, it was last season for both sides that was the outlier, and now we’re seeing something more in line with what we’d expect to happen on the defensive side.
There was always less of a sense that Manchester United were doing something that the xG models were genuinely missing than Burnley. While Dyche has a relatively long track record of this, Mourinho’s sides typically perform fairly close to expectations, so it was a surprise to see them suddenly concede very few goals from those chances. As such, a fall was always likely to be on the cards. Burnley are an altogether more questionable case, and this is perhaps one of the most interesting stories to track over the season. If they are able to turn this start around and get back to conceding improbably few goals, it will get harder to doubt Dyche’s warlock status. For now, though, questions remain, and any magic remains yet to be proven.