Welcome back to our data exploration of shot pressure using StatsBomb data. In part 1, we laid the groundwork for our definition of shot pressure. We showed how overall shot pressure, and specifically pressure from certain angles, influences scoring likelihood. We continued that analysis to investigate players’ tendencies to shoot in the midst of pressure.
In part 2, we looked specifically at headers under pressure and teased you with some insight on passer’s ability to find open shooters. Unfortunately, we’re not quite ready to leak our player’s decision making analysis. Instead, in this article we are going to take a visual tour of the effects of shot pressure from different locations.
In this analysis, we continue with our shot pressure definition from part 1, which split the shot pressure into equal quadrants to the right, left, front and back of the shooter. After filtering for only shots from open play, we present a visual representations of how pressure from each direction effects the scoring rate.
How does the direction of pressure effect scoring rates in different locations of the pitch?
We present a series of figures with an interpretation for each one below. Please note that in the figures below, the color scale changes to make it easier to see the differences between shot locations. We calculate the change in scoring rate as the scoring rate under pressure (defined for each direction) minus the scoring rate without pressure from that direction. We tested these figures with various bin widths and they were not highly sensitive to the number of bins which is encouraging, but with even more data we will be able to fine to our spatial analyses.
Pressure left
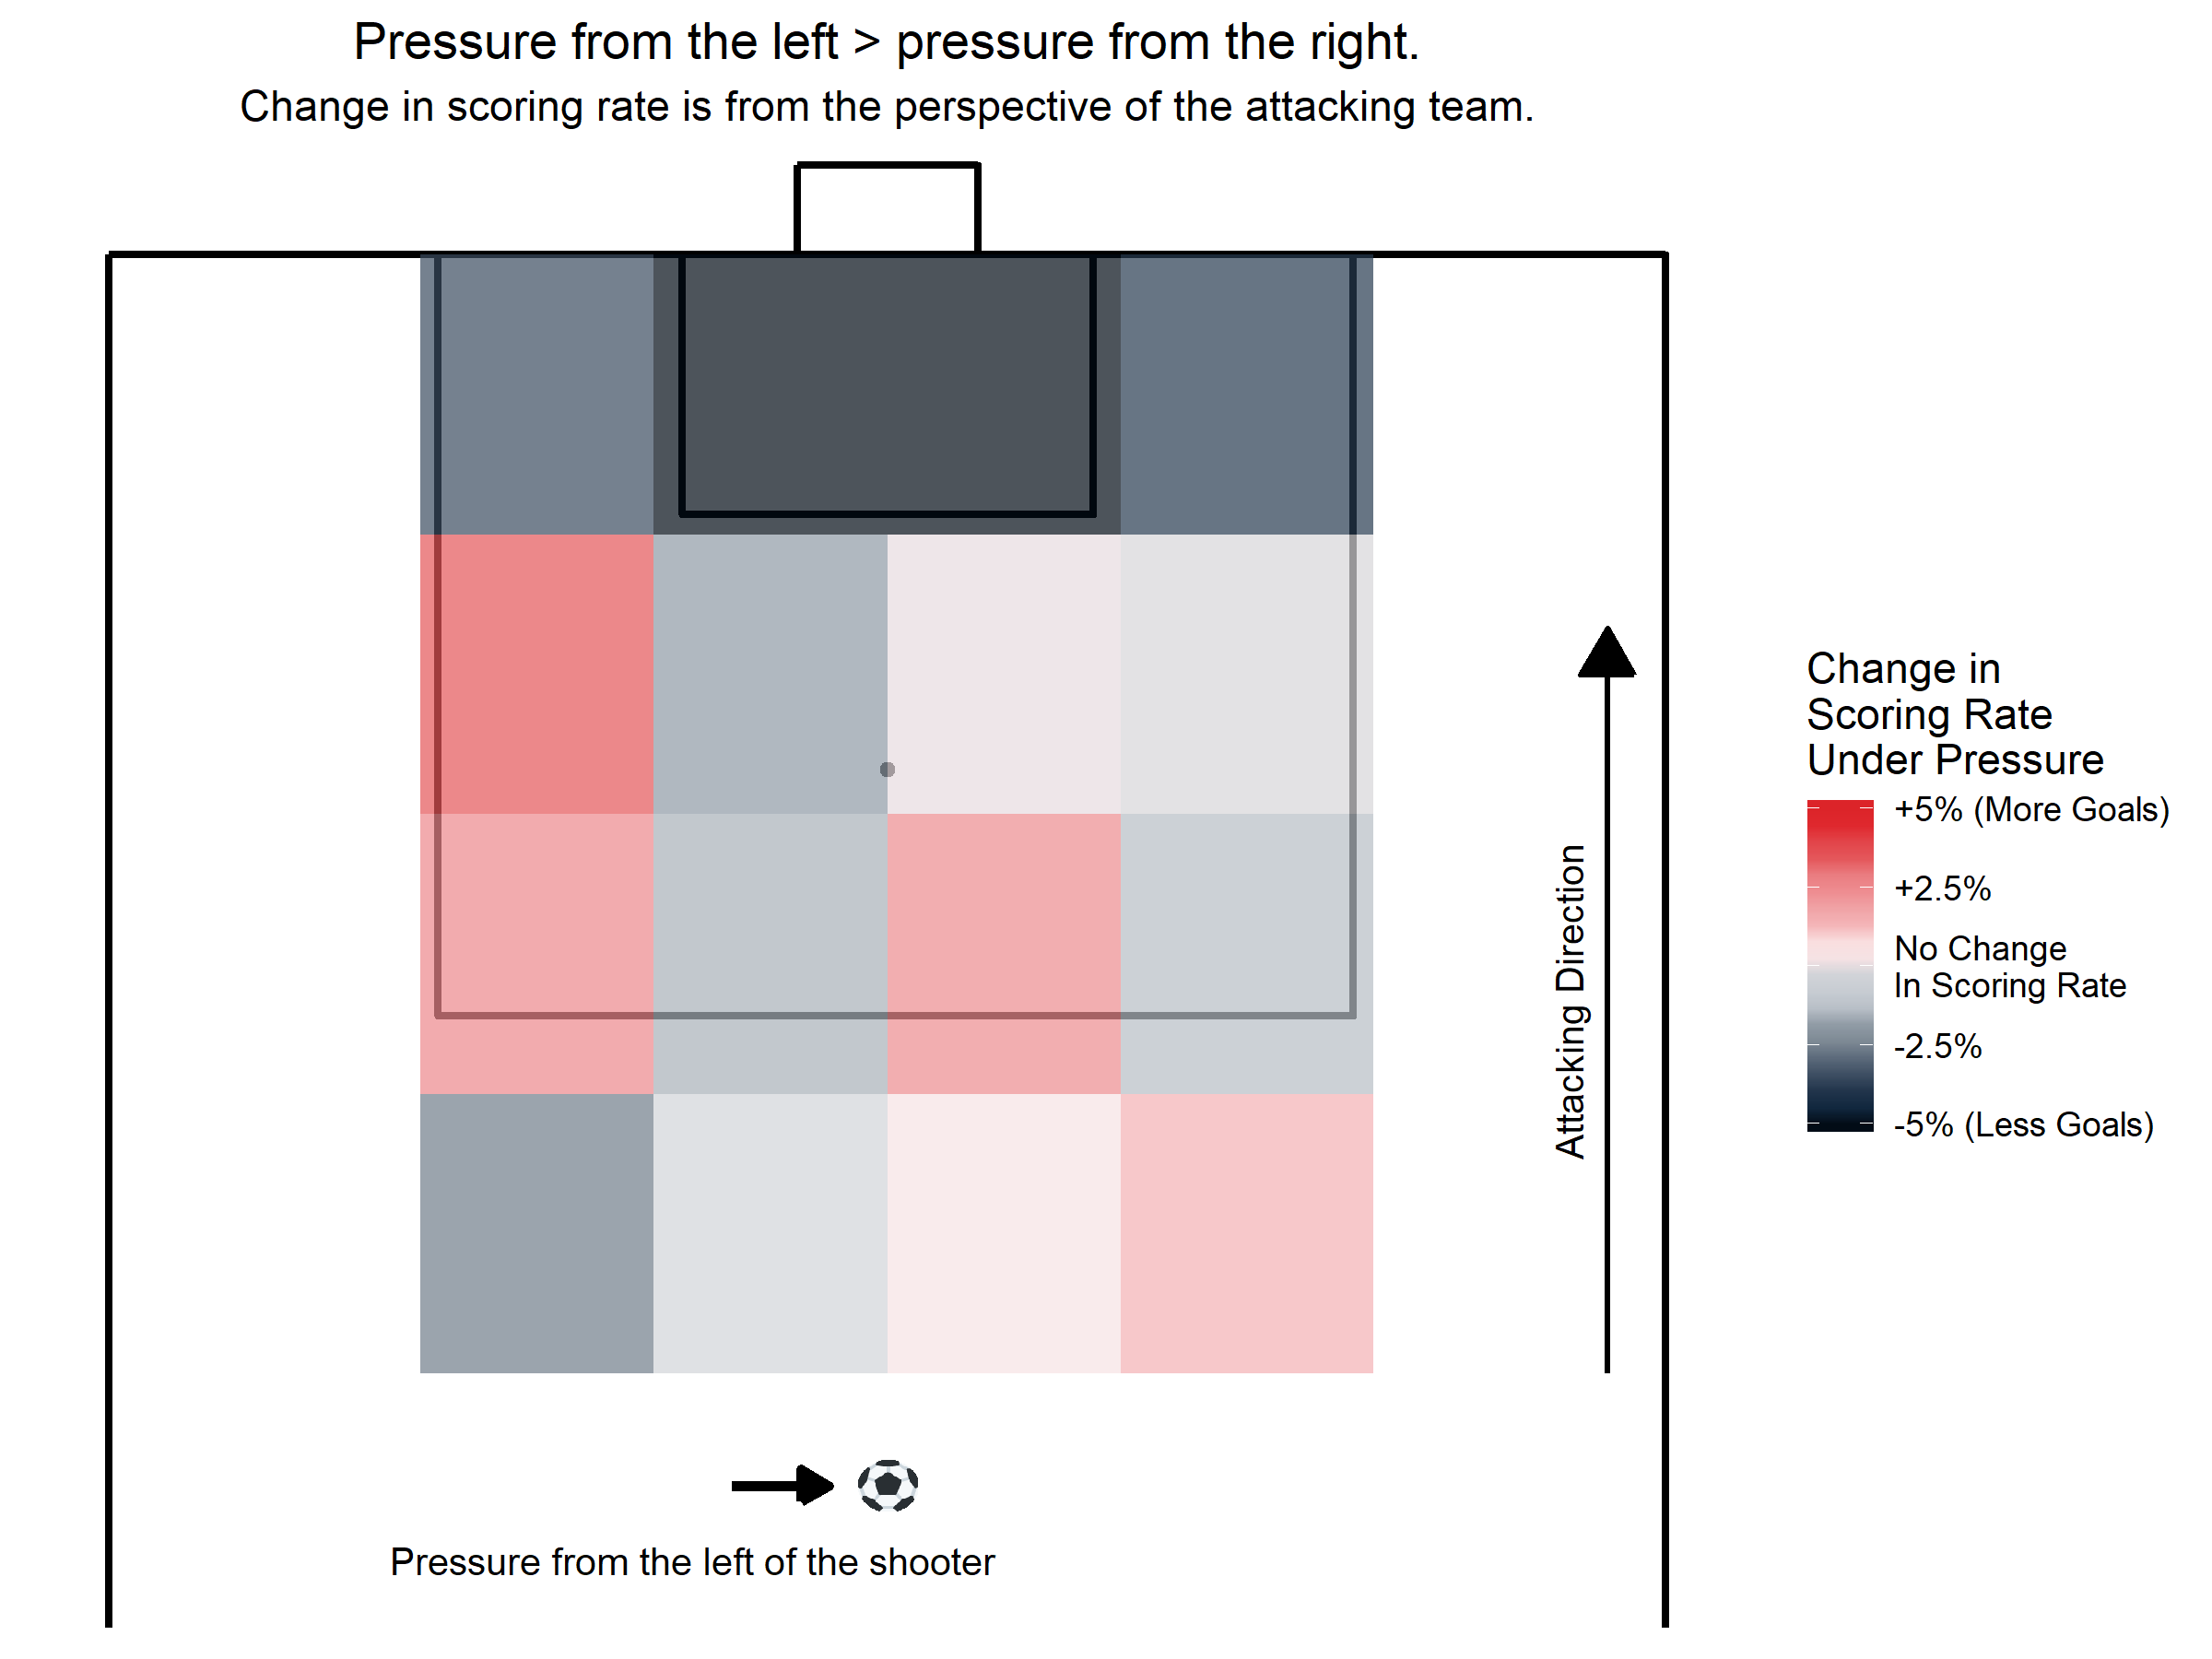
In the figure above, we see that on the left side of the pitch, when the pressure from the left is greater than the pressure from the right, the change in scoring rate varies from approximately a 3% increase to no change (except for the top and bottom tiles). The intuitive explanation for this is that on the left side, the pressure is forcing shooters inside the field and giving them all of the goal to shoot at.
Closer to the goal frame, we see a drastic decrease in the scoring rate when there is pressure from the left and this is likely due to the proximity of the defenders to the attacker this close to the goal easily influencing the shot outcome by being more likely to block the shot or simply put the attacker under psychological pressure. On the right side, the pressure from the left is forcing shooters away from the goal and taking away part of the goal frame so we would expect scoring rates to decrease, however we see no such trend.
Pressure right
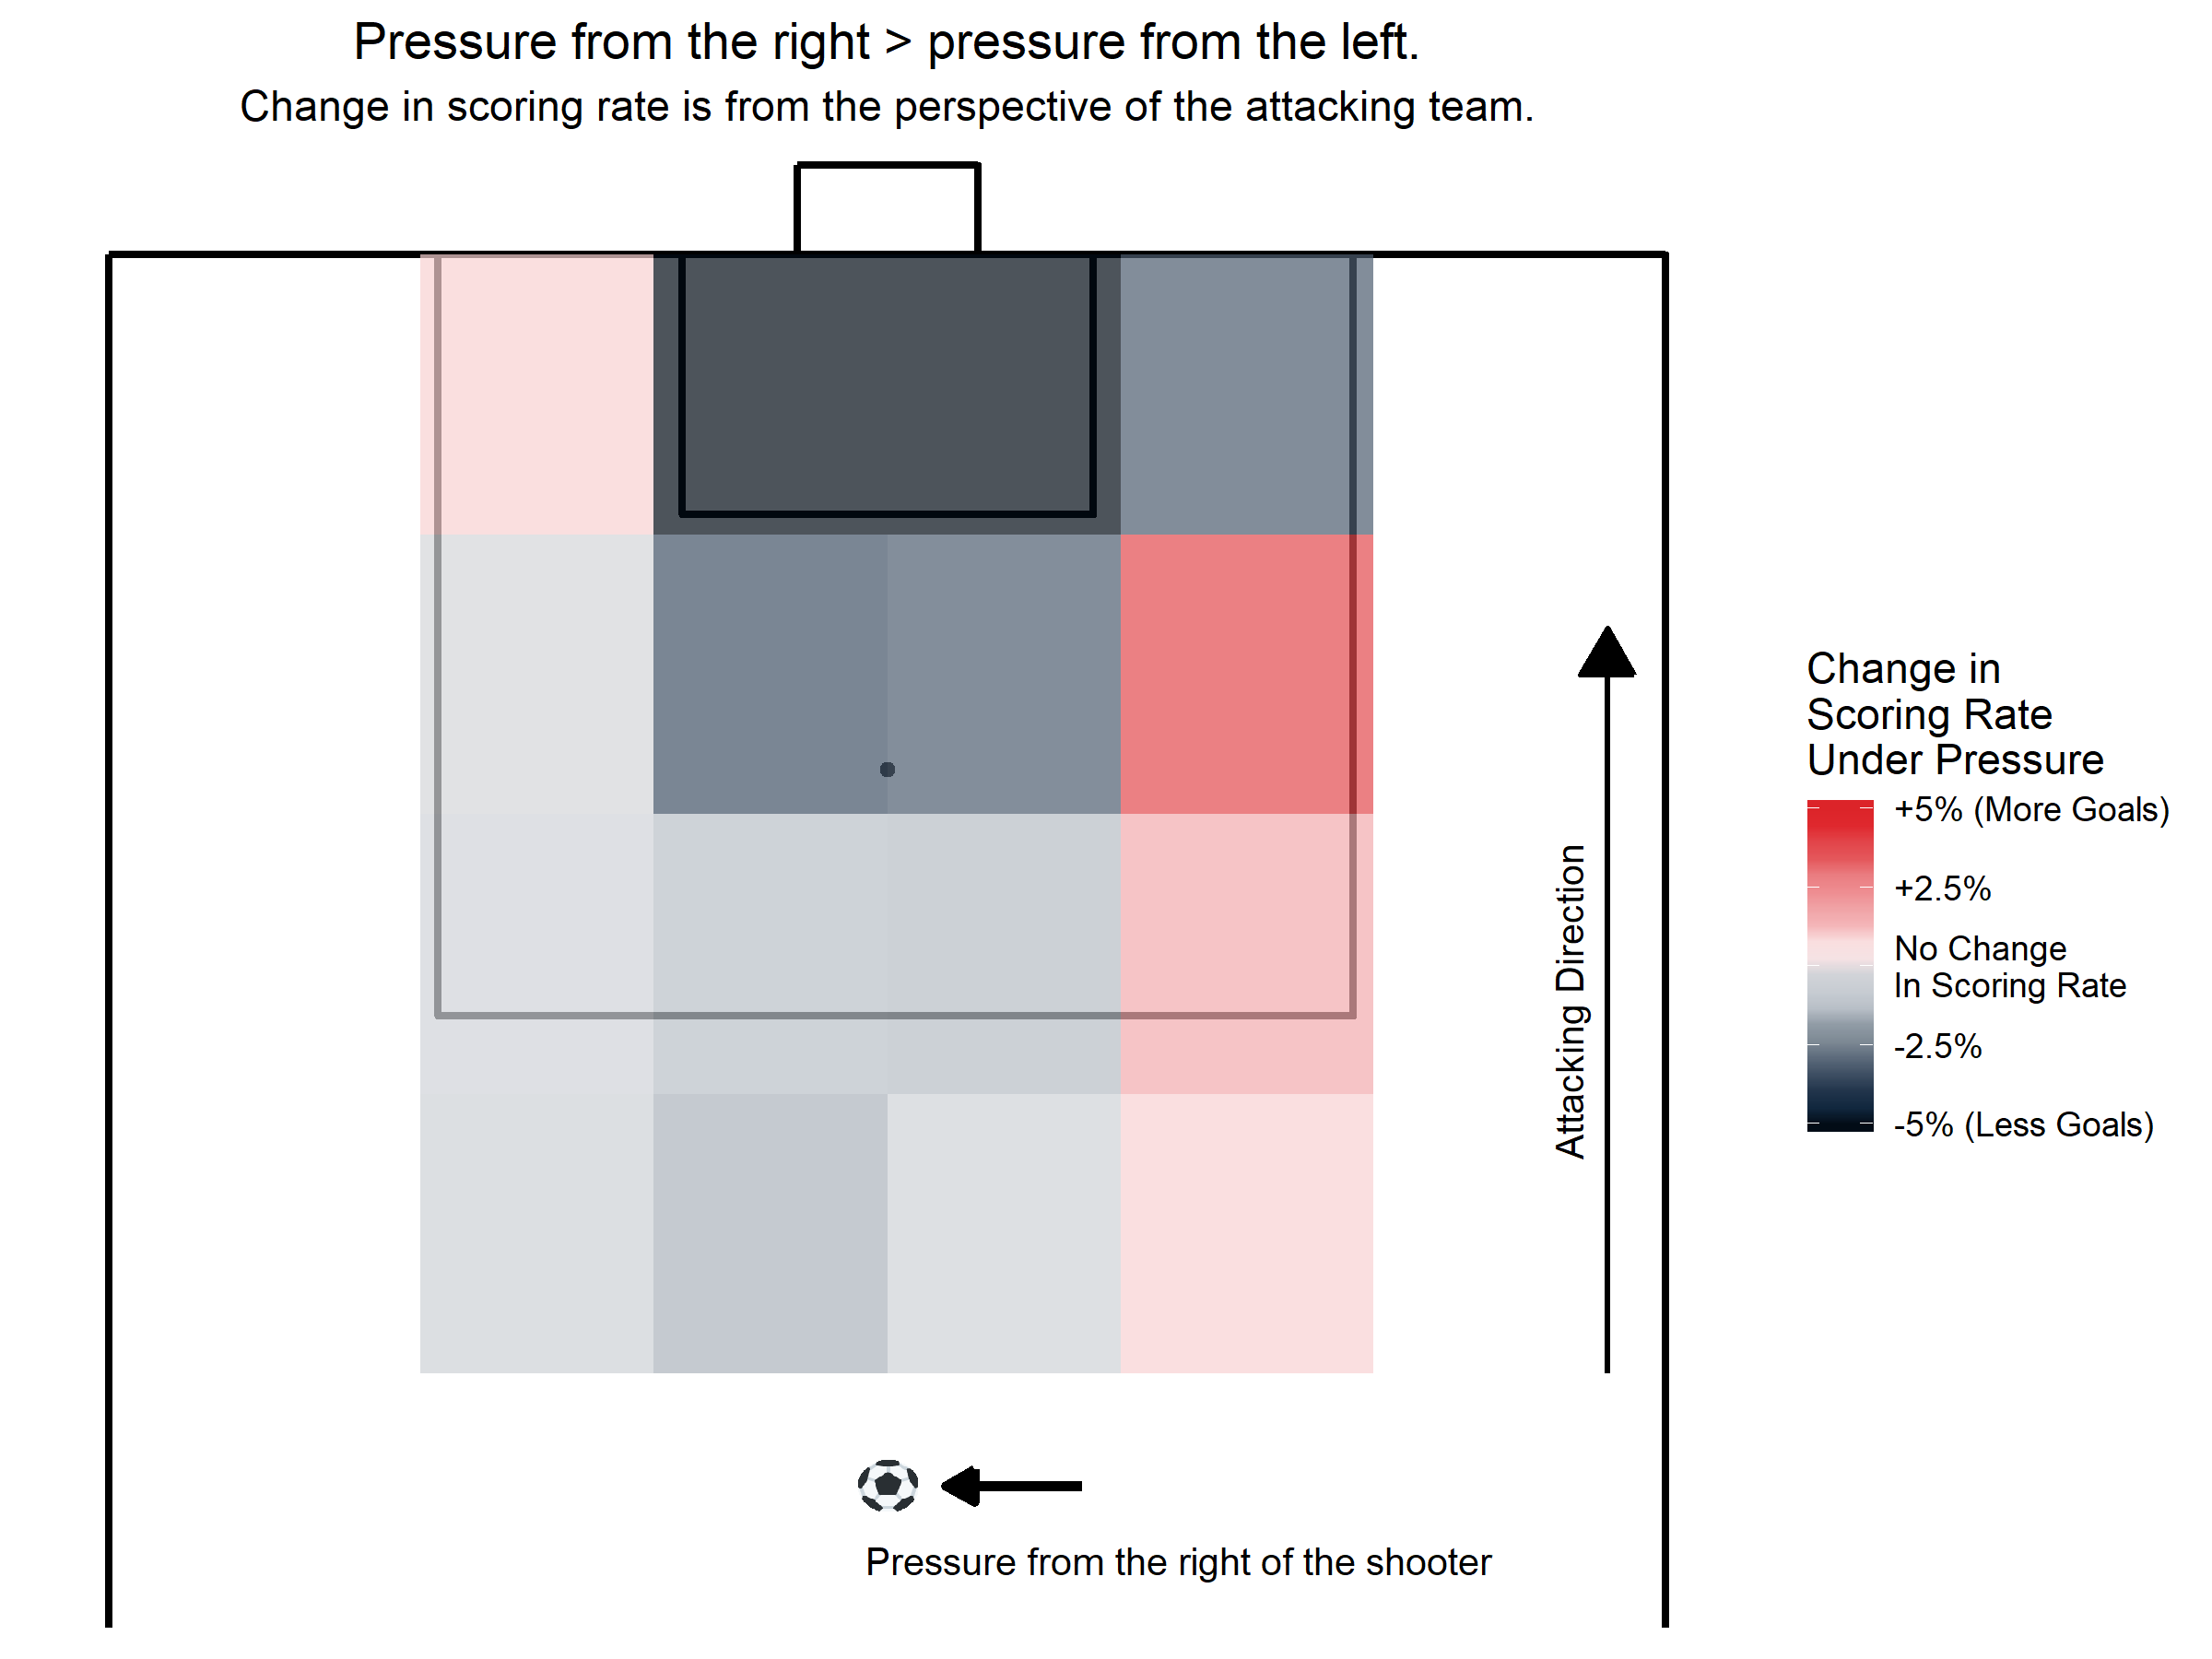
When we look at pressure from the opposite side now, we see an increase in the scoring rate on the right side of the pitch, but essentially no change on the left side of the pitch when the pressure is forcing the shooter outside. A possible explanation for this is the plethora of right footed players shooting through pressure on the left side of the pitch despite the pressure coming from the right, which could be confounding the effect of pressure in these regions.
Pressure Front
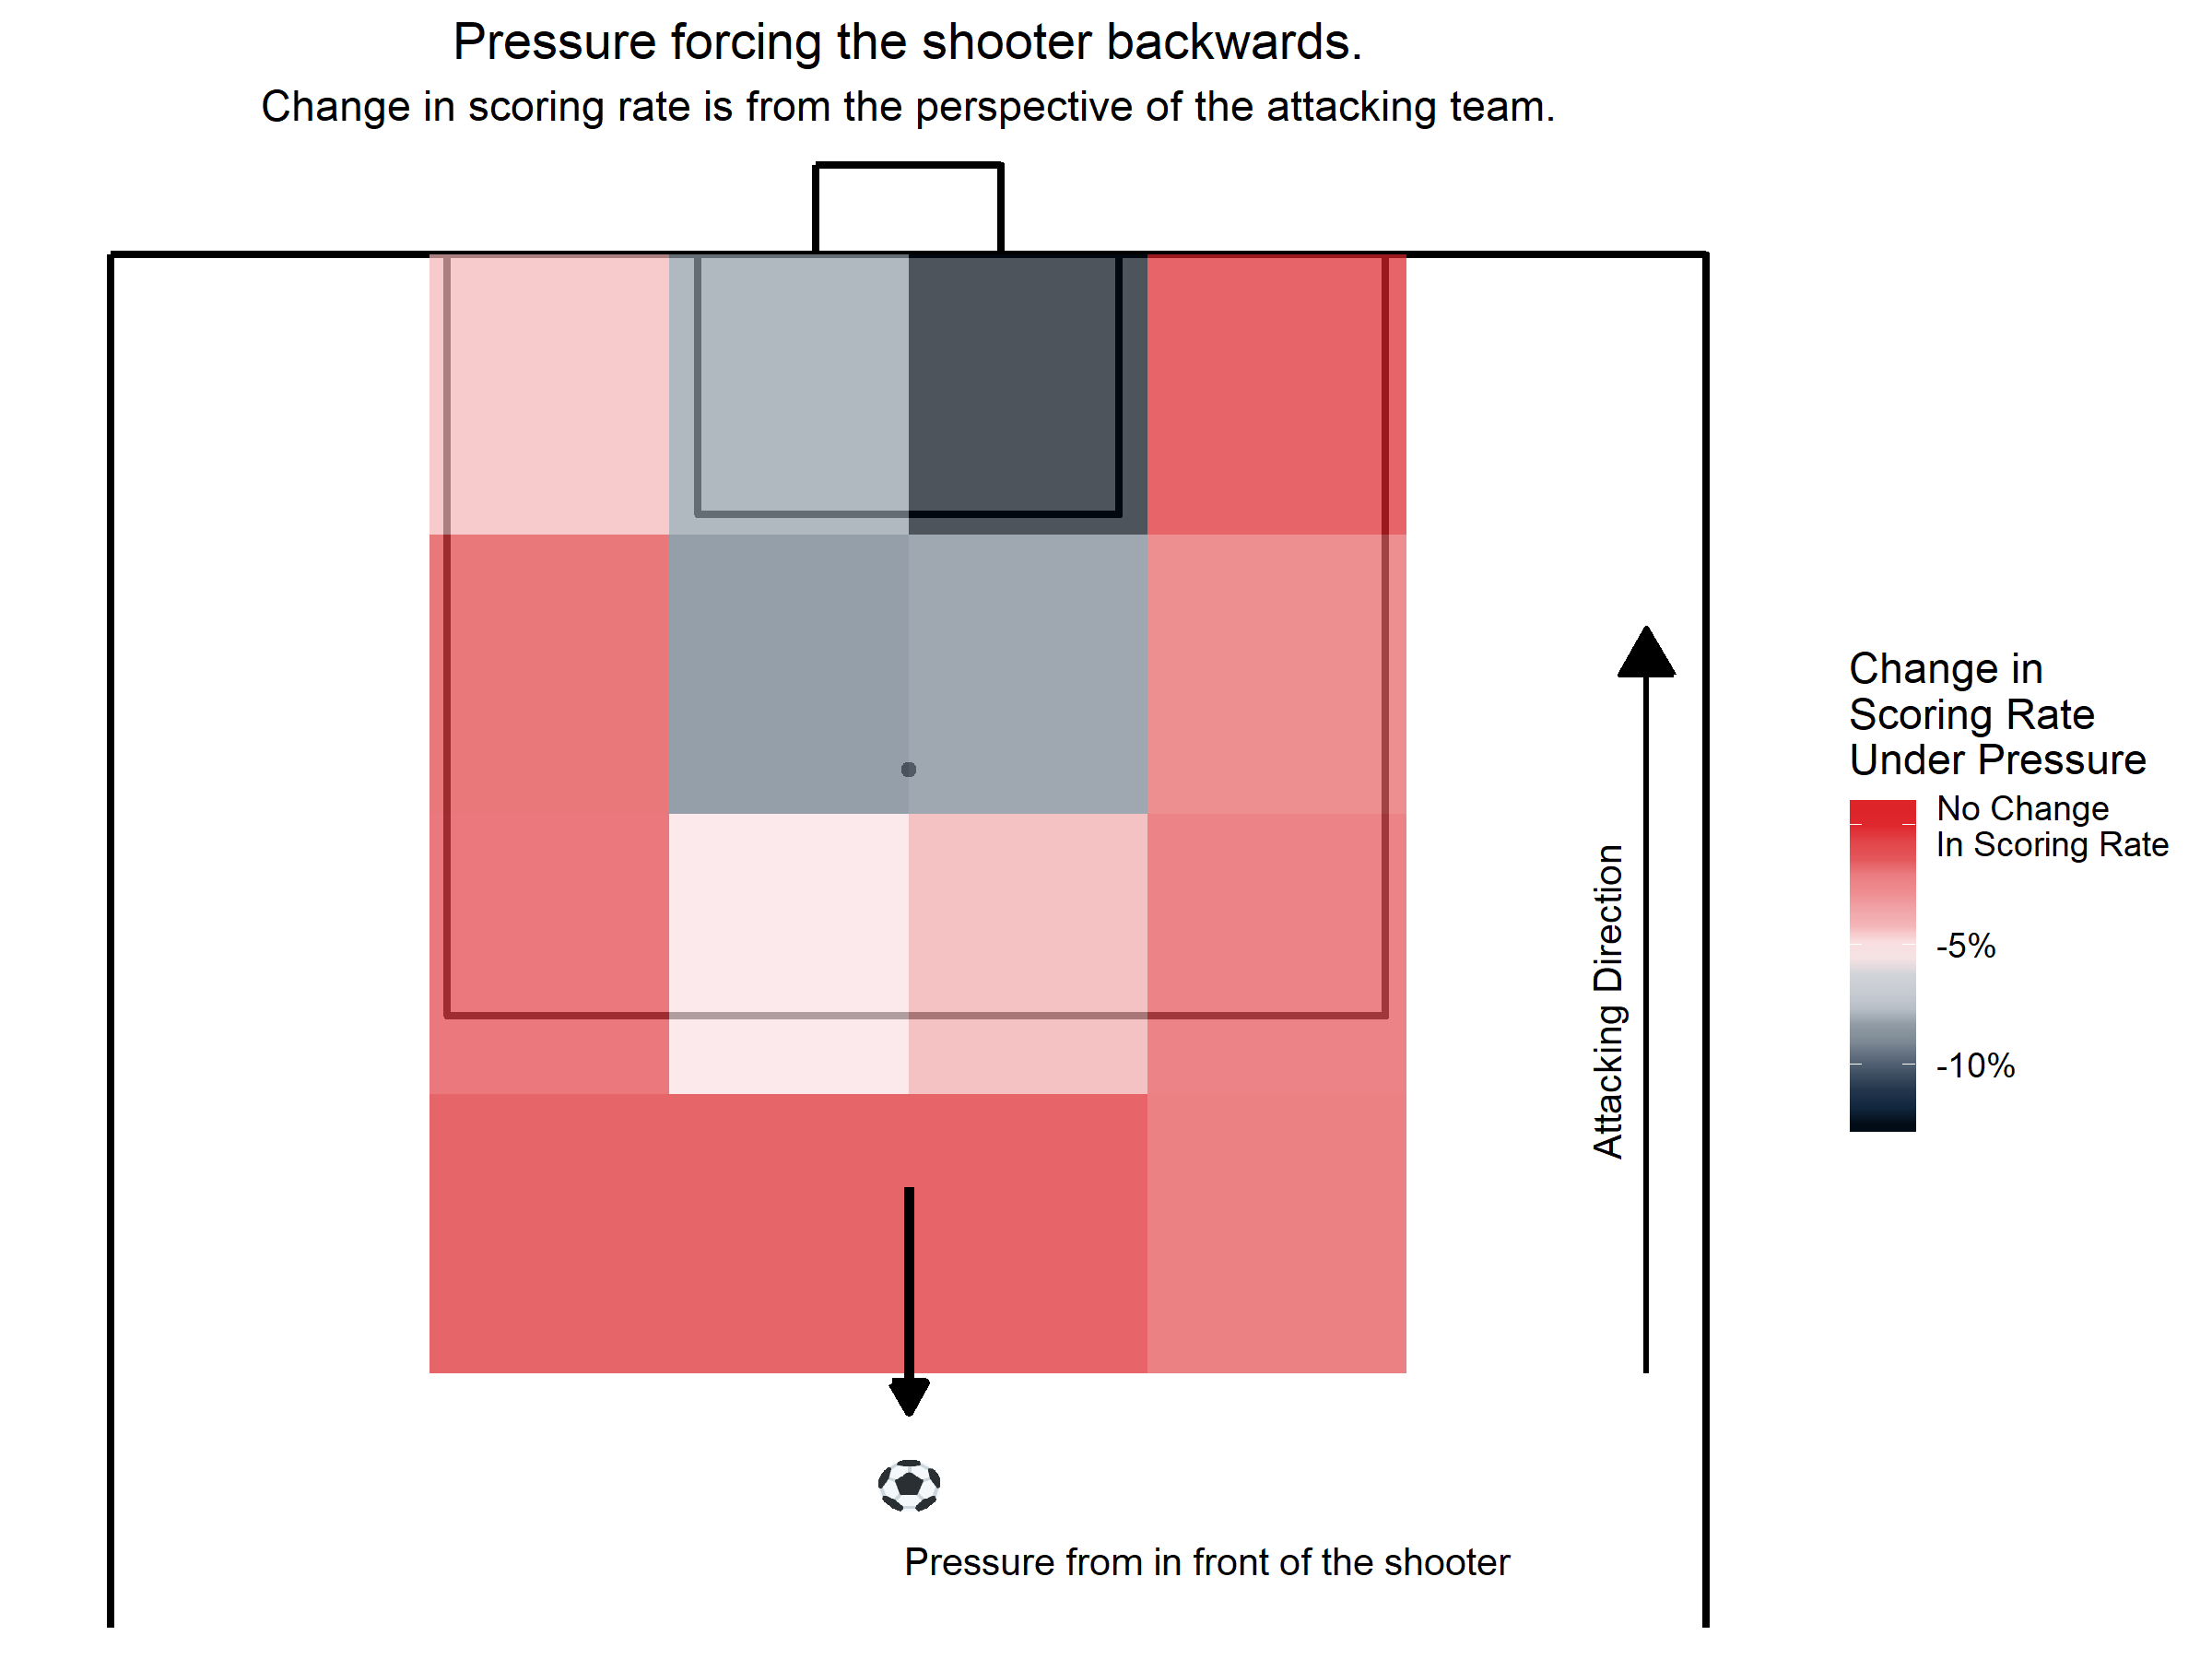
Pressure in front of the shooter shines again, just like in part 1 of this series. Note the change in color scale. In almost every tile, the scoring rate decreases when there is pressure from a defender forcing a shooter backwards. It is also important to note that the effect diminishes as the shooter gets further away from goal.
This could be due to the extra space behind the defender allowing for more uncertainty in scoring. But, it could also be due to how we are defining shot pressure as a radius growing with the distance from the goal. If the latter is correct, then we will have to revisit our shot pressure definition. That would also have implications for defensive technique when it comes to blocking shots further out from goal, and the optimal levels of aggression for closing players down..
Pressure From Behind
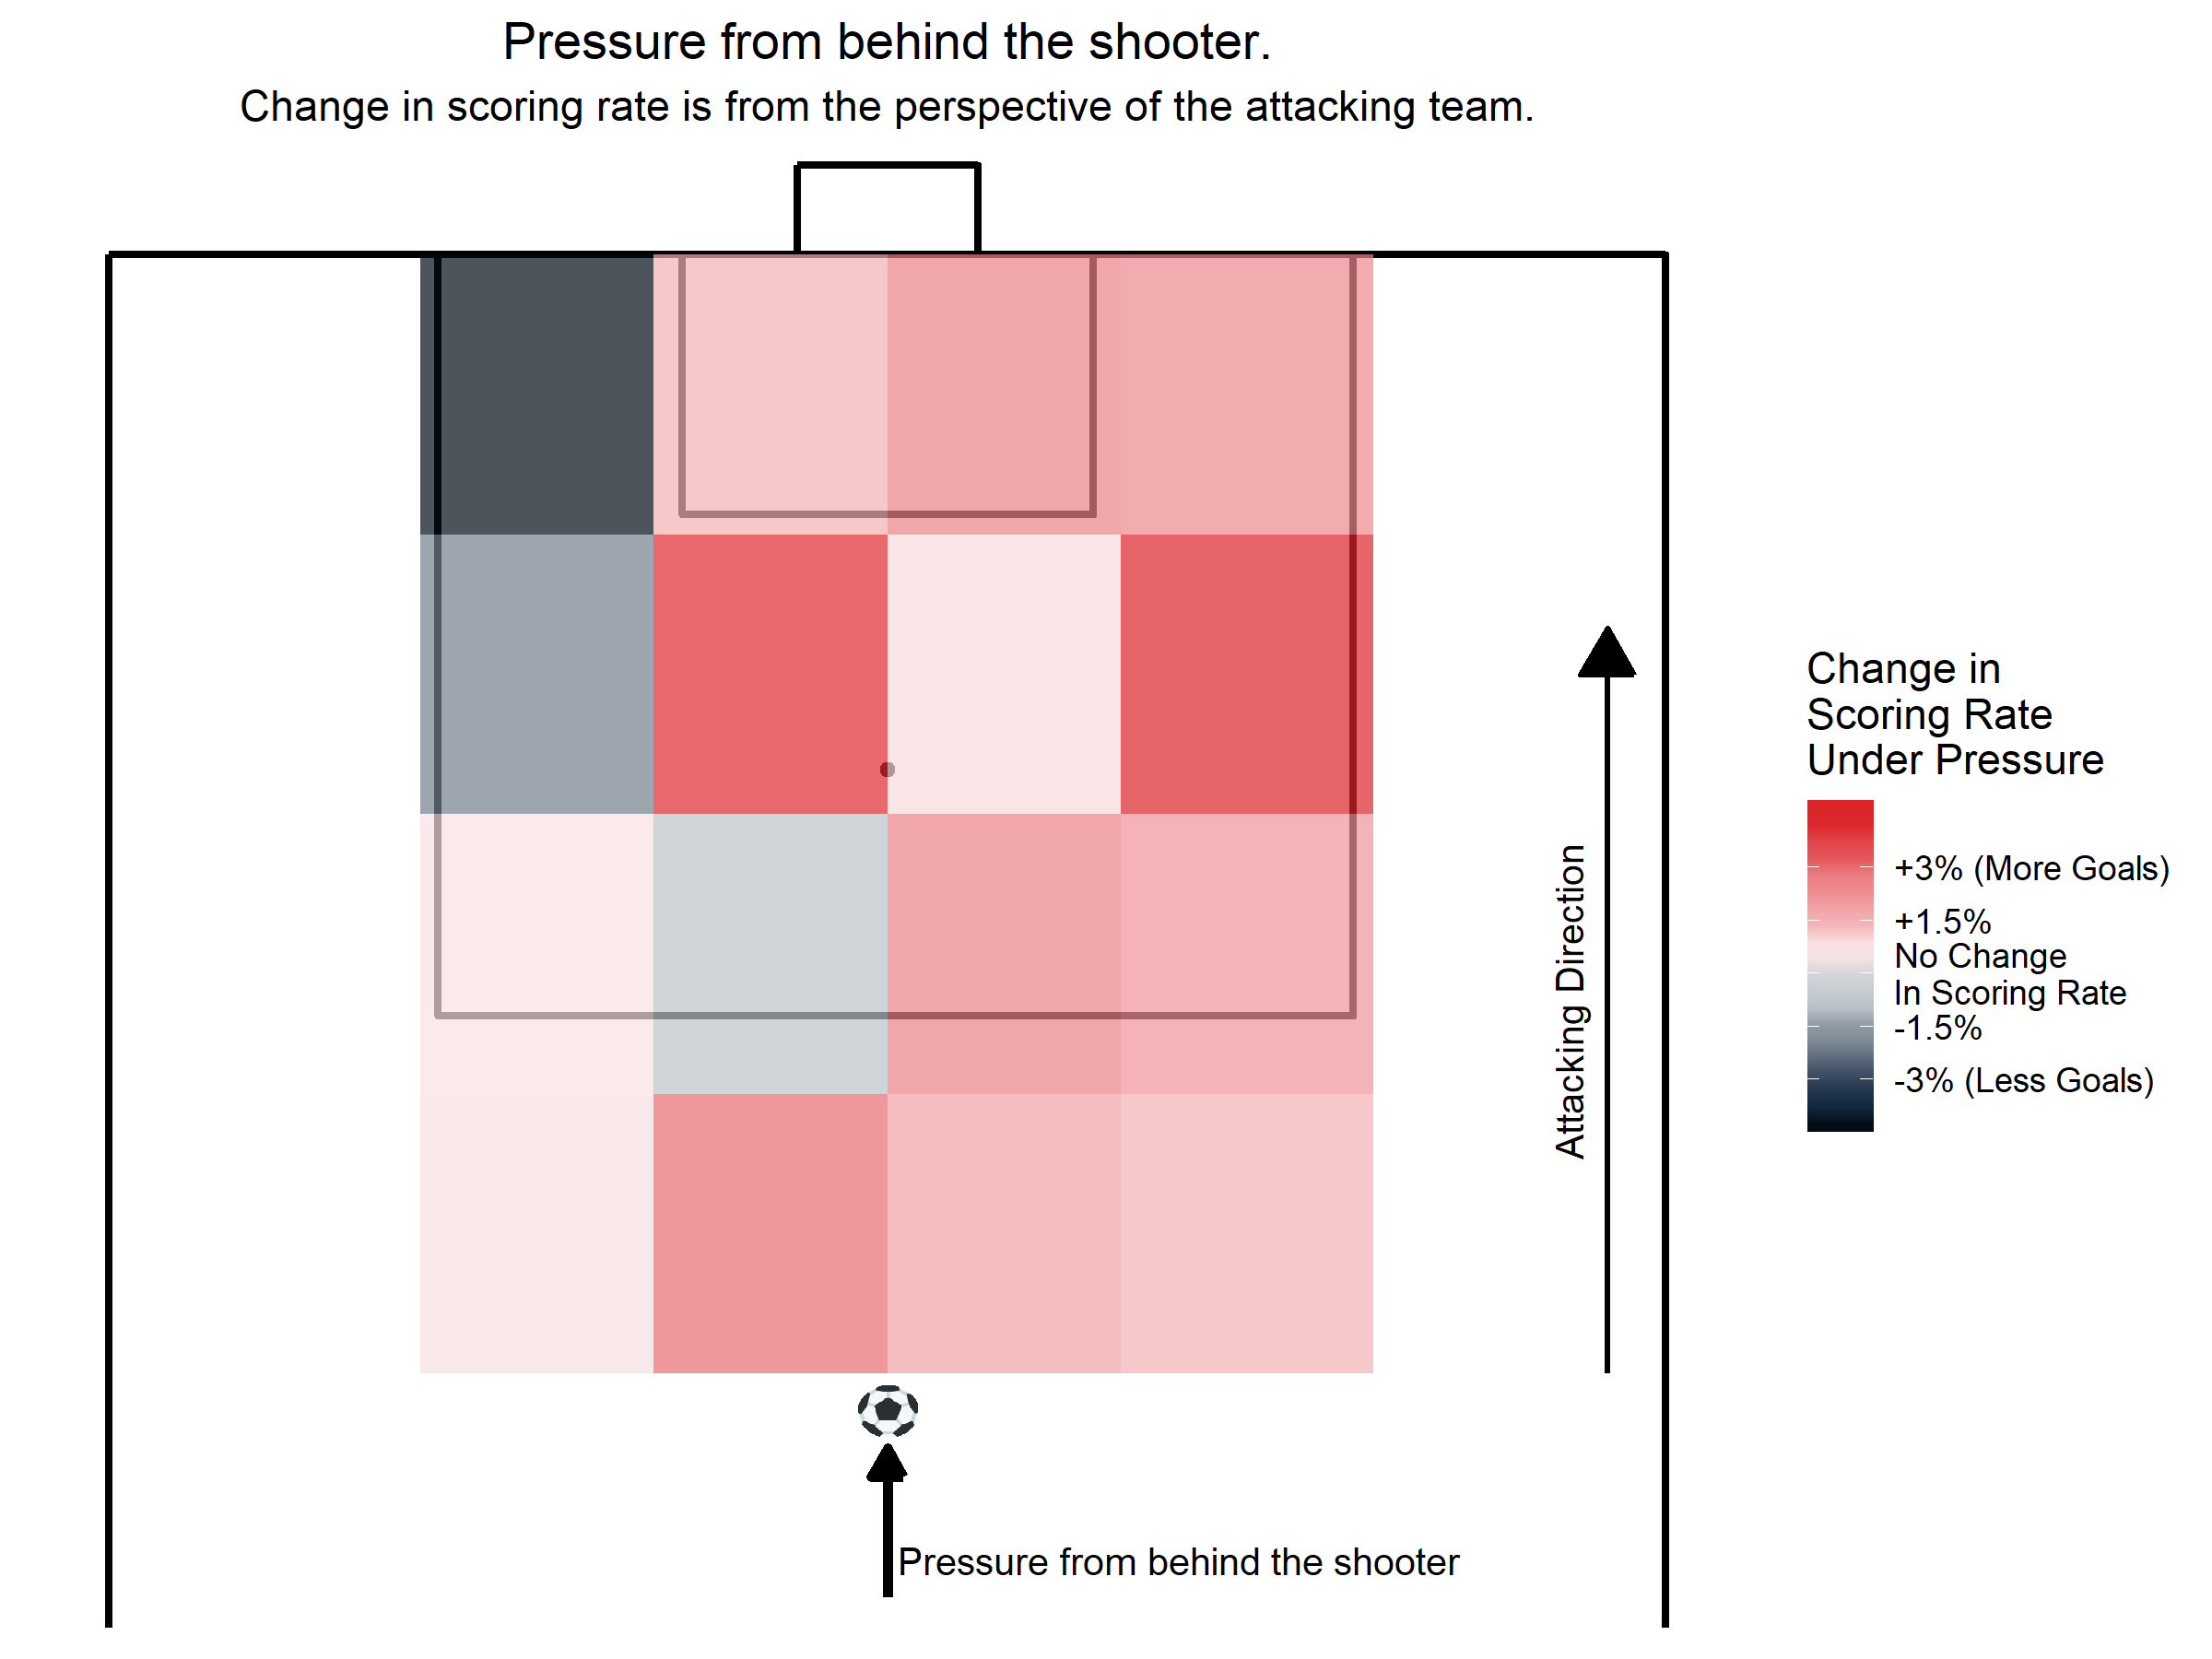
In a completely converse effect from pressure from the front of a shooter, pressure from behind a shooter hardly ever reduces the scoring rate. Almost everywhere on the pitch, the scoring rate increases when the pressure is coming from behing the shooter. There's a reason that defenders harassing players from behind is a method of last resort, it's because it generally has little impact on the shot the attacker ends up taking.
Pressure forcing the shooter outside
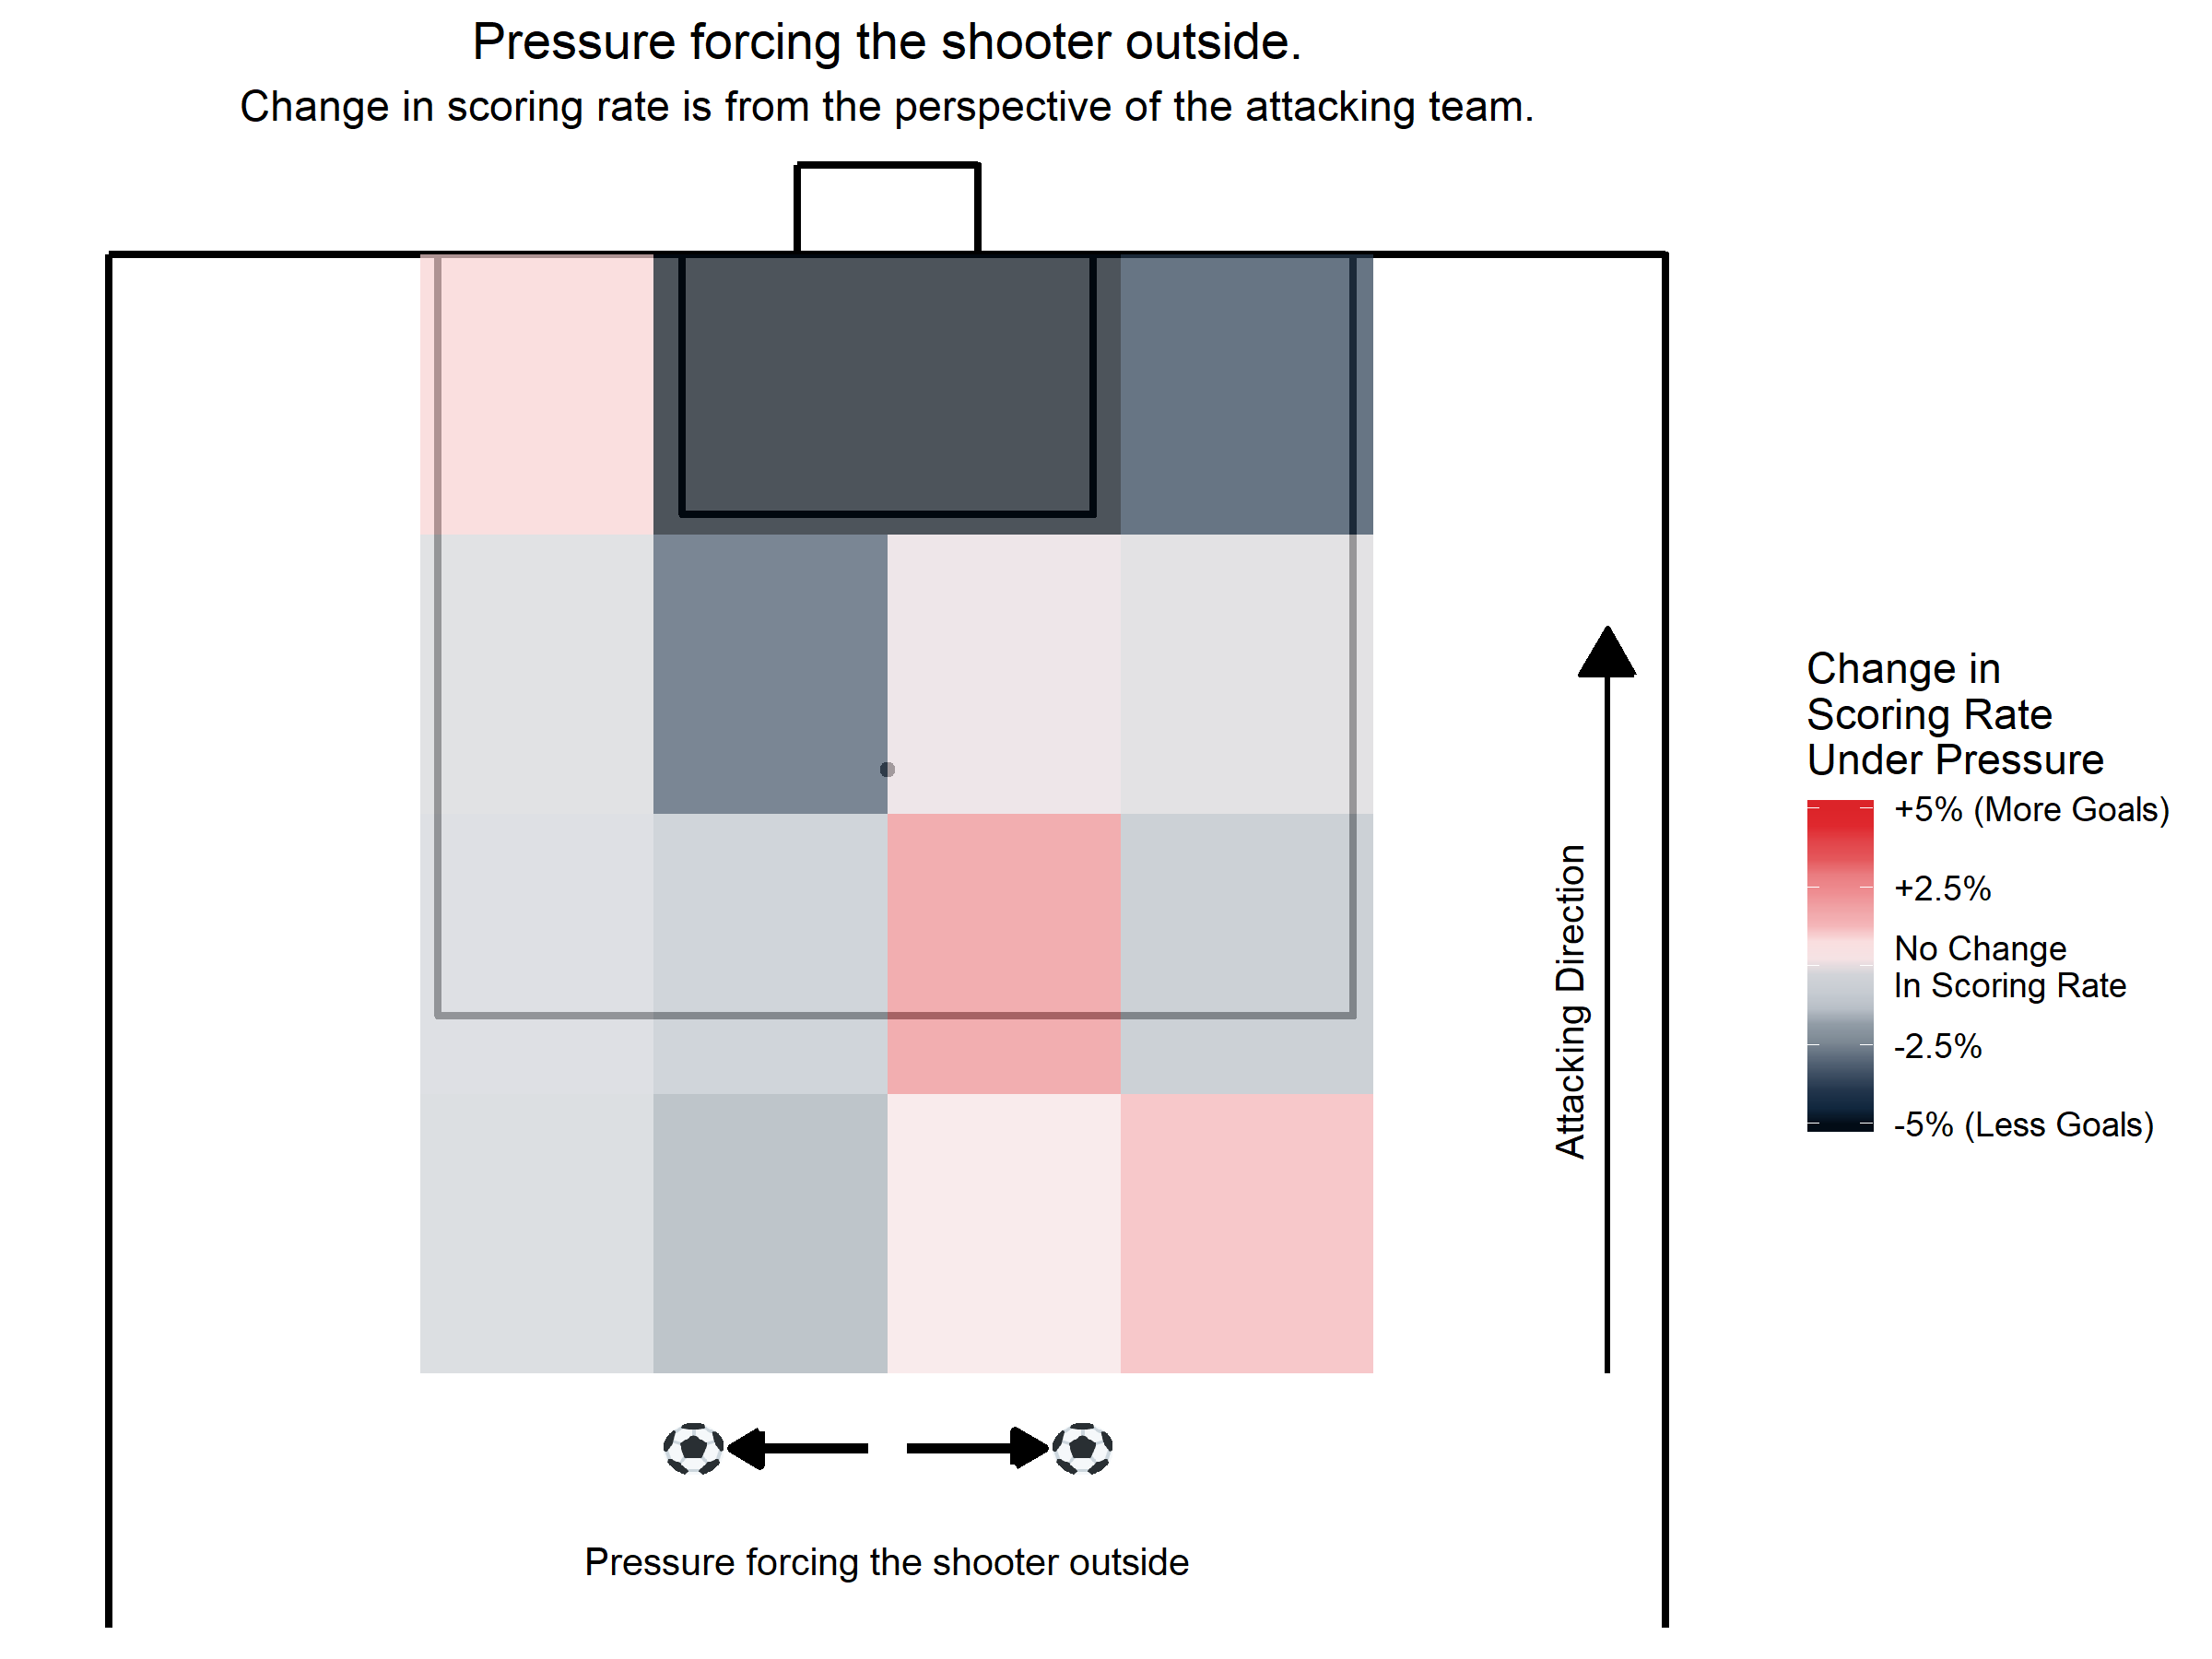
When we looked at pressure from the left and right above, we alluded to defenders forcing shooters outside and away from goal. We tried to tackle that idea by looking at when a defender forces a shooter outside by defining pressure pushing outside as more pressure from the right when the shooter is on the left side of the pitch and more pressure on the right when the shooter is on the left side of the pitch.
This is essentially the left half of the pressure from the right being greater than the pressure from the left plot, and the right half of the pressure from the left being greater than the pressure from the left plot. It is largely unknown, whether or not pressing a shooter towards the touch line effects the probability of scoring. It's worth noting that defensive positioning aimed at forcing players wide may not be an adequate defensive system, and specifically on the right side, where it forces many players onto their stronger foot, could be detrimental. We look forward to investigating this further, especially to figure out the big differences between the right and left sides.
Take Aways.
We made these figures to illustrate some of the raw numbers we saw in part 1 and present them in a manner that is easier to digest. Most conclusively, we have reaffirmed the importance of pressing a shooter backwards, away from goal and identified some key distinctions on each side of the pitch. Shot pressure can be defined in a number of ways and we are by no means claiming we have cracked the code, but there is indisputable football insight to take away from these analyses.
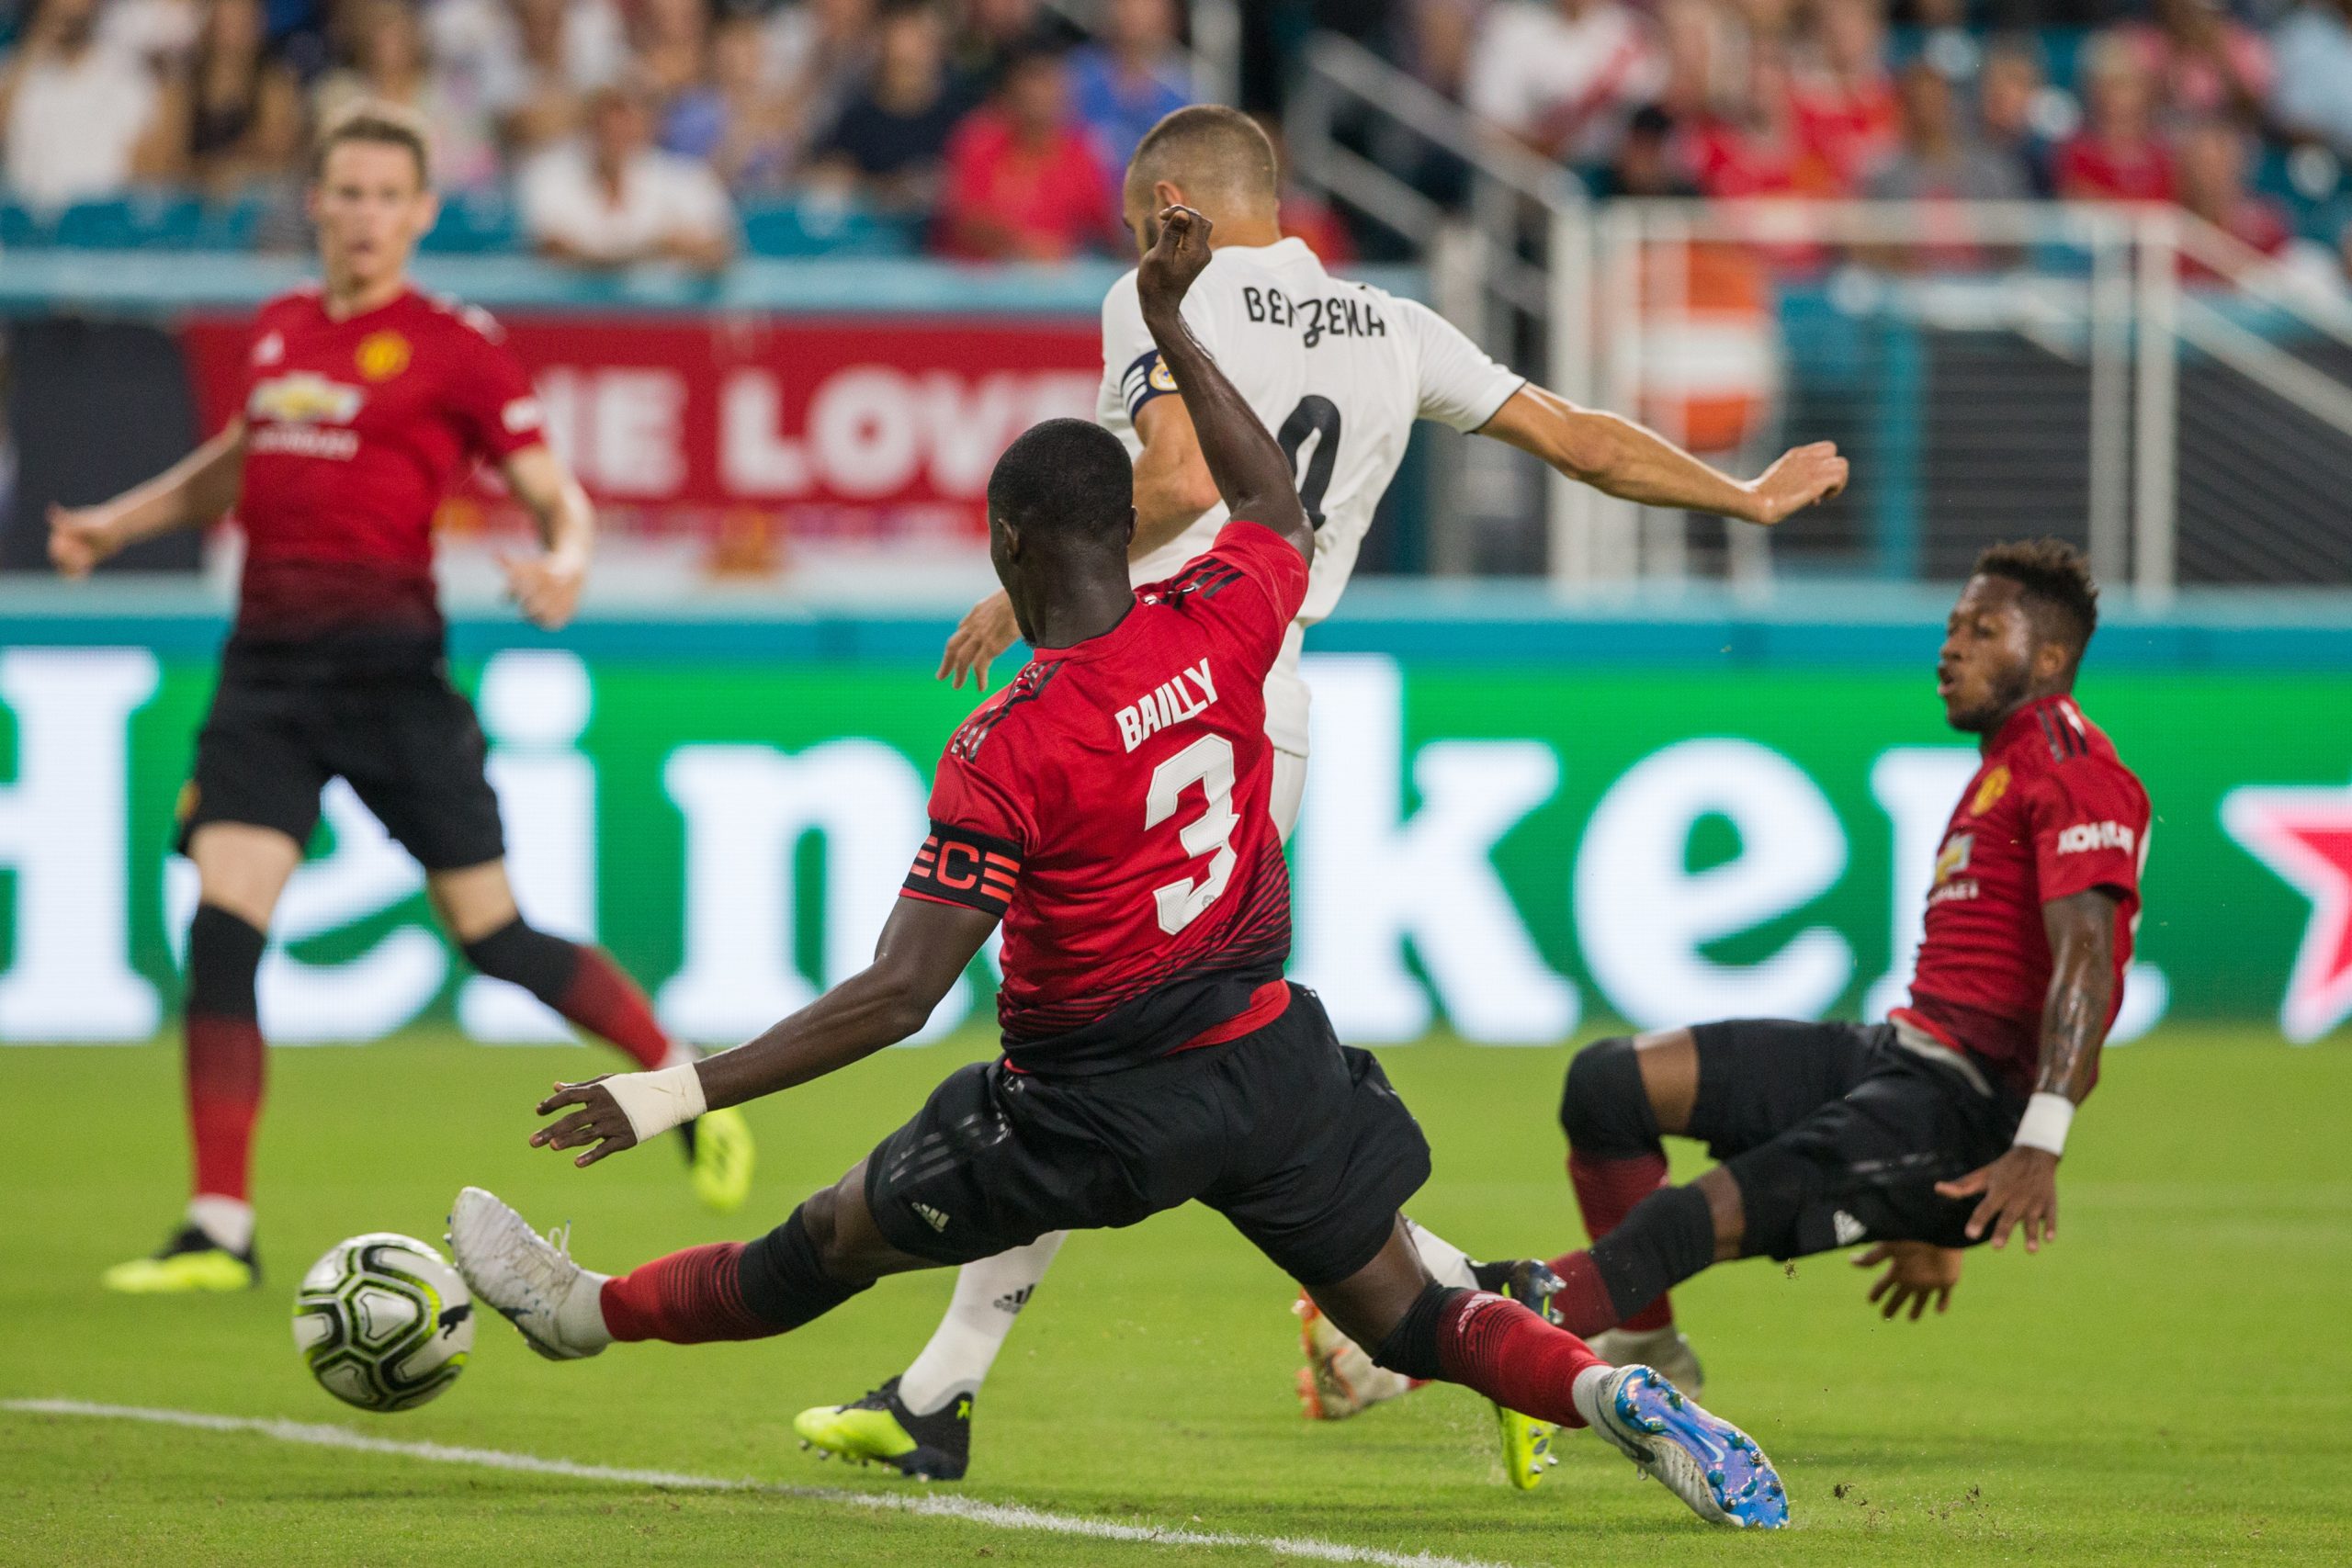
Header image courtesy of the Press Association