Do you find yourself with time on your hands these days? Suddenly staying in on a Saturday night for the good of humanity? And just to top it all off, you have to seclude yourself with no sports to watch. Separately, have you noticed an explosion of numbers in football? A sudden rash of xGs springing up all over the place? Suddenly everybody seems to be spouting off about stats and you’ve got only the vaguest notion of what they’re on about?
Well, you’re in luck. StatsBomb copy-editor and general woman about town Kirsten Schlewitz is just like you! While she’s an expert at correcting the incredibly sloppy copy you’ve all come to know and love from me, she also came in as a relative novice at this whole stat thing. So, I roped her into asking me every question she could think of that she might have otherwise been afraid to ask. So, let’s get started.
K: First of all, let’s get the elephant out of the room. What is xG?
M: xG is short for expected goals. It’s a statistic that attempts to measure how likely any given shot is to become a goal. It’s really good at predicting the future. That is, xG is better at telling you which teams will score and concede goals going forward than any other statistic we have. That’s the most basic barebones definition I can think of.
K: If you already have xG to predict who will score and who won’t, why are so many other numbers needed? I see a great deal of figures and maps when I edit pieces, and sometimes I don’t understand what their purpose is. For example, when comparing two players, you can’t rely on xG for a team. So what numbers would be used there?
M: The answer to your first question is that knowing who is more likely to score goals going forward isn’t a particularly interesting thing to know (unless all you care about is betting, which, fair enough). The interesting questions are the hows and the whys. A single number like xG doesn’t help you very much with that. I like to think of xG as being a statistic that makes sure the conversation starts in the right place, as opposed to one that tells us anything remotely close to what we need to know.
So after the conversation gets started that’s why we need all the other stuff, to examine how teams play, what individual players are doing, basically what’s going on on the pitch that leads to the xG number at the end. And when those numbers come to particular players things can get very complicated very quickly. That’s because while xG works fine for players (specifically it can tell us when a player is on a hot or cold streak that’s unlikely to continue), shots are only a relatively small part of what’s happening. And, quite frankly, the further we get away from the actual shot, the less definitive our numbers become about what’s good and what’s bad, and the more we rely on them to try and accurately describe the game, as opposed to predict outcomes.
K: So you’re saying there are more or less two sets of numbers that a StatsBomb article could use: ones to predict which team will play better going forward, and ones that tell us what happened in a previous game (games?) in a way that dives deeper than simple match reports. If someone wants to write an article about, say, how they think the Champions League would have panned out this year, would they only use the prediction numbers, or would they also examine numbers that show what happened in previous matches?
Or am I way off base here and all the StatsBomb stats are used in conjunction with one another, rather than existing as two separate sets that focus on past and future?
M: So this is exactly right conceptually. The problem is that the numbers often overlap in ways which make the divide not particularly clear cut. For example, xG is an excellent stat for predicting the future, but it’s also a pretty ok one for explaining what happened. We know more about a match if we say that Arsenal had 1.5 xG than if we said Arsenal had 15 shots. Using the xG from a single game is kind of a quick and dirty way to describe what happened, albeit one with plenty of faults.
The best use of numbers though will always combine prediction and explanation. If I wanted to look at upcoming, now cancelled, Champions League matches, I would use general xG numbers as a starting place and say, “Here’s what I think will happen based on these numbers” and then use everything else to say, “And here’s why.” Now that also doesn’t mean xG is perfect. Doing good work in stats means trying to understand the limitations of the numbers as well so that we can understand when they might be missing something. So, in theory, it might be possible to analyze all the whys and hows and decide beforehand that even though a team like Liverpool might seem much better based on xG, they would struggle against Atléti (that’s not a conclusion I would have come to, but it’s not like completely beyond the pale to suggest).
K: We keep talking about “the rest of these numbers.” For someone who’s completely intimidated by stats, to the point they’re afraid to even click on a StatsBomb link, much less pitch you an idea, what other types of numbers would you anticipate they’d need to understand?
M: From a writing perspective, understanding the numbers is somewhat less important than understanding the game. If a writer is making accurate assertions about the game then those claims are going to be reflected in the numbers and in the editing process we can work together so that your friendly neighborhood StatsBomb editor (me) can help give you the appropriate statistical support you need.
So, if a writer wanted to write about how a team relied on a midfielder for a lot of their buildup play, they wouldn’t need to know the ins and outs of StatsBombs numbers. But I’d be able to call upon stats of ours like “deep progressions” to look at how frequently they move the ball up the field, or at passing percentages when they’re pressured and not pressured to explain how they’re cool in the face of a defense, or information and graphics on pass length, etc. etc. etc.
Now, if the numbers don’t match a writer’s argument that makes for an interesting challenge. The question of why a writer perceives the game a certain way while the numbers don’t capture it is generally a really exciting place to do analysis. Figuring out why there’s a disconnect between what the numbers capture and what the eye might see is usually an interesting endeavor for everybody involved.
K: I’m here editing and writing articles, and I fully admit I don’t comprehend exactly what half of these numbers mean. But if I wanted to submit an article that showed I do understand a few of the statistics, which do you think would be most important to understand?
M: You do need to understand the basic mechanics of xG and why it works so well. It’s important to understand that a player having more goals than xG expects he “should” is likely to start scoring less. Beyond that I’m looking less for knowledge of a specific stat than for a way of thinking about questions. Questions like, “Do you have a statistic that measures XYZ” are good, questions like, “How do you go about measuring ABC” are even better.
K: From xG and its variations (non-penalty xG, open play xG etc), it’s relatively easy to assess the offensive strength, or lack thereof, of a side, even if you’re new to stats — and I can attest to this, believing I had no ability to comprehend sports statistics before I took this job. But what still tends to confuse me is the defensive measurements . . . I see the maps and figures, but even those don’t help me quite get it.
M: Yeah. Defense is hard. We can look at xG conceded, or shots conceded, or any number of other things, but those are still fundamentally measurements about what the other team’s attack is doing. And that makes sense, because on some level all defense is is preventing the other side from attacking. But it’s also unsatisfying because defenders are obviously doing SOMETHING and it would be nice to describe what those things are.
The traditional measures are things like tackles, interceptions and blocks, and while those are useful numbers, they have some major problems. The biggest is that you can’t commit those defensive actions while you have the ball, so players on bad teams tend to have more defensive actions than players on good ones that keep the ball all the time. One thing we do is adjust all of those numbers for possession, to try and give a better picture of what’s going on.
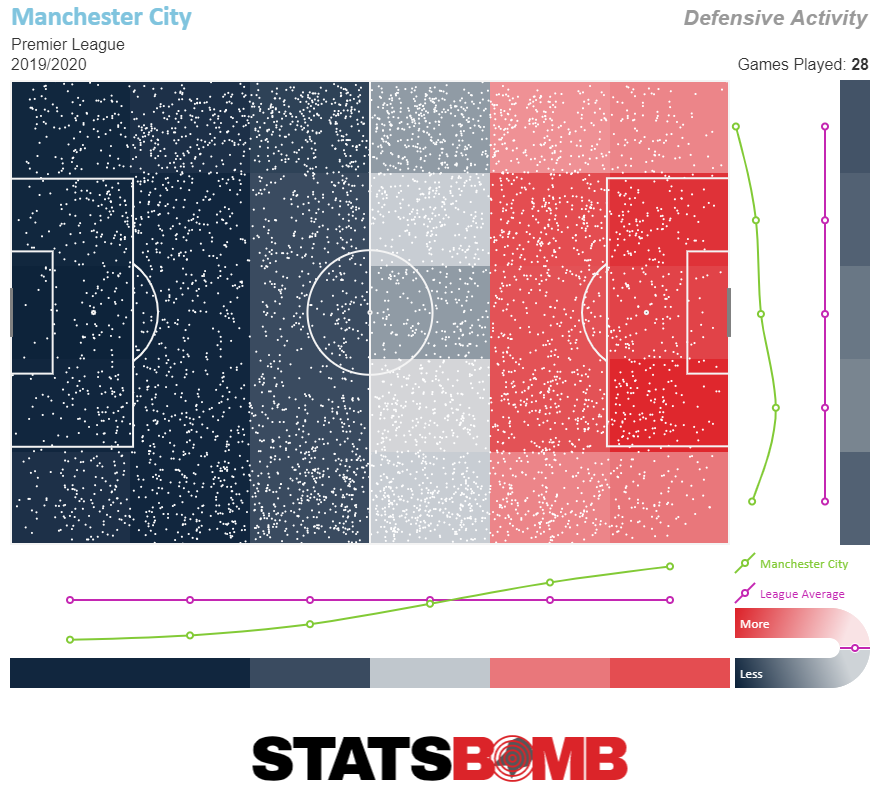
On top of that we track pressures. That is, we track every time a defender is close to an attacker with the ball and impacting him in some way. This gives us a lot of information — adding pressures into the mix demonstrates where on the field a team is making defensive actions.That gives us the ability to look at a heatmap of a team’s activity and really get a picture of where on the pitch they like to defend (the redder the square the further above average the number of defensive actions are in the zone, the bluer the square, the further below). Manchester City defend basically in their opponents penalty area, for example.
All of that’s a long winded way of saying that it’s really really hard to evaluate defenses!
K: So we know how offense is evaluated, and we know how defense is judged — somewhat, anyway. With these two necessary halves of the game described, I have one final question: What would you like to see a writer be able to demonstrate with the numbers, keeping in mind that the StatsBomb blog is there to both educate readers and show potential purchasers what they can do with the data?
M: The major thing I want to see isn’t a specific proficiency with data, but rather a framework for thinking about issues. Think about a question you want to answer, and how can you use data to answer that question. That’s what we’re all trying to do, whether it’s determining if a potential signing will be worth it, or why a player is having a career year, or if a keeper's yips will pass, everybody is fundamentally doing the same thing. Whether it’s analysts with teams, or fans in the stands, or writers for StatsBomb, they’re looking at the game, developing a question and then trying to answer it.