We recently introduced our new On-Ball Value model, a possession value model that objectively and quantitatively measures the value of each event on the pitch. In the introductory piece, we explained the concept and some of the methodology behind the OBV model; in this piece, we’ll demonstrate how it can be utilised in team and player evaluation.
A fuller explanation of On-Ball Value was included in the introductory piece but, in short, it’s a model that looks to assign a value to each action that takes place on the football pitch based on the positive (or negative) impact the action has on the team’s likelihood of scoring (and conceding). Rather than simply observe that they took place, we can now start to measure the effect of these actions.
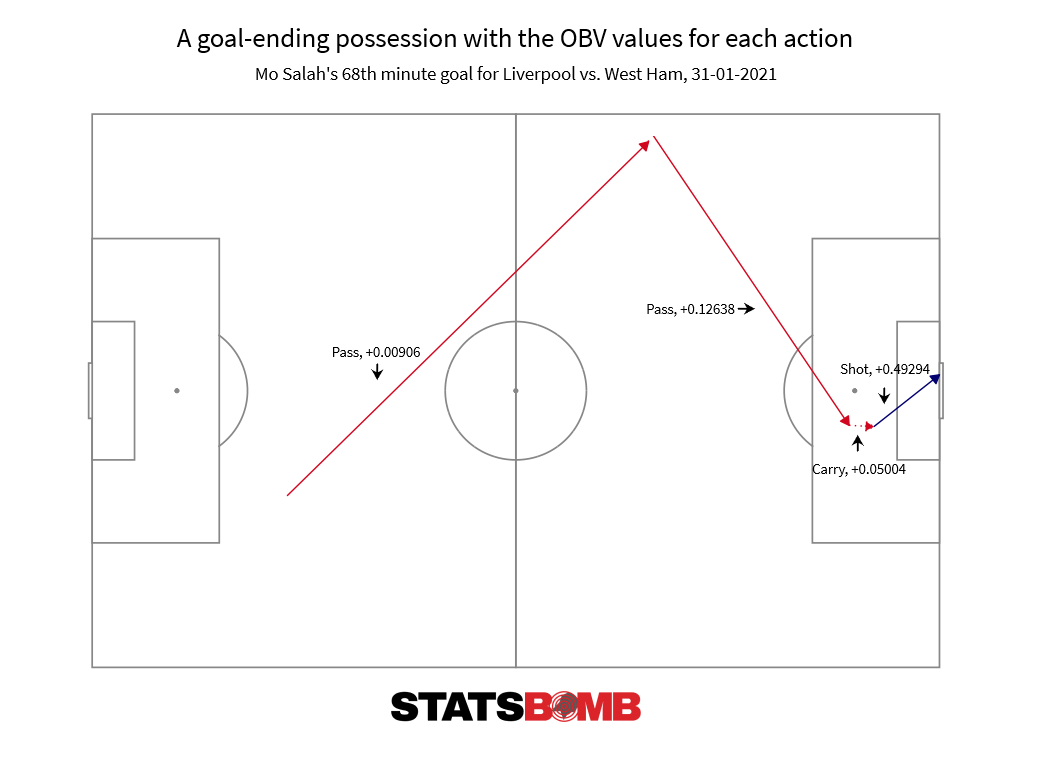
For the visual learners among you, let’s see what this looks like on a football pitch. Cast your minds back to last season when Mo Salah put Liverpool 2-0 up away at West Ham.
The initial pass from Trent Alexander-Arnold gains a small value for moving Liverpool towards the West Ham goal. Xherdan Shaqiri picks the ball up in space, and he makes a pass that has a significant impact on Liverpool’s chances of scoring within the possession. Salah receives, carries it a couple of strides, before finishing well past Łukasz Fabiański. Salah’s carry adds value by moving the chance to closer range, as does his actual shot which was both on-target and placed in a high-probability area of the goal. Both actions increased the likelihood of Liverpool scoring from the position Salah was in. Had he missed the target, he would’ve seen his shot action assigned a negative OBV value as punishment for squandering a high-value possession for Liverpool.
We can demonstrate this further by looking at what high-value passes look like versus low-value passes. In this case, we’ve filtered to passes that directly led to an assist or key pass – sometimes known as secondary assists or pre-assists – to capture passes that mostly took place closer to goal. On the left, you have the 30 most valuable pre-assists in the Premier League last season by OBV. On the right, you have the ten least valuable pre-assists. These passes actually had a negative value attached to them as they were deemed to reduce the likelihood of their team’s scoring in that possession.
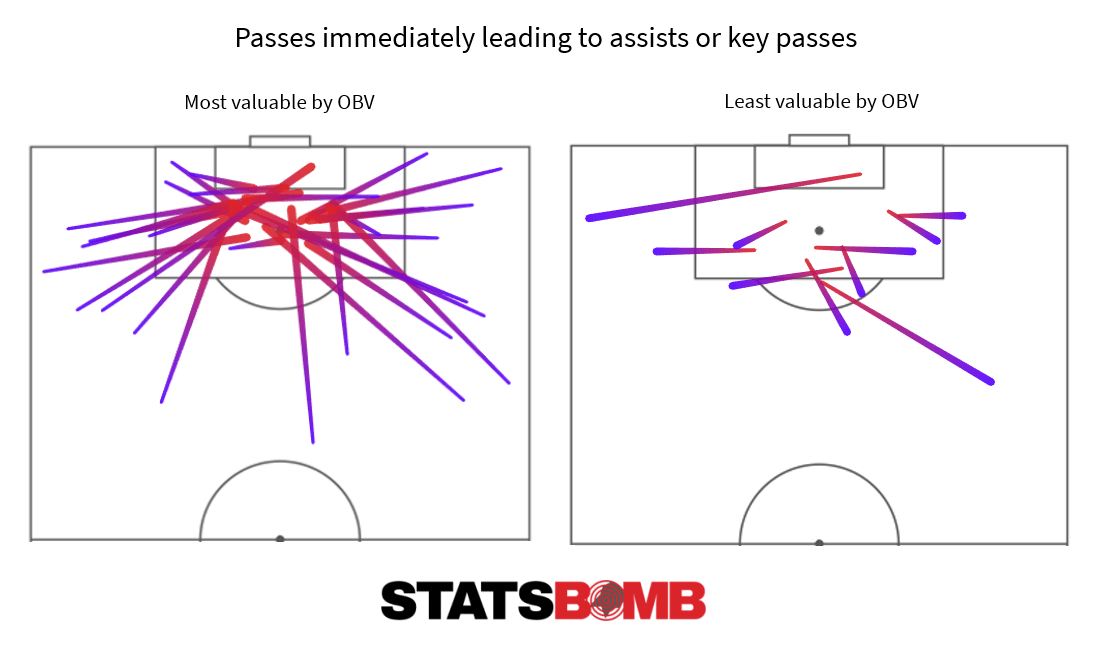
And herein lies the utility of OBV: we can now assign a value to these passes rather than just counting them. We’ve long had expected goals to rate the quality of shots; we now have OBV to rate the quality of aaaaaall the other actions on the pitch in between both boxes. After all, shots make up less than 1% of actions on the football field. It’s now time to get a clearer picture of the game.
Let’s look into how OBV can be used in player analysis. Sample sizes aren’t big enough to cast a fair assessment on this 2021/22 season just yet, but don’t worry–there’ll be plenty of OBV content throughout the season soon. For now, let’s look back on last season’s top performers by OBV
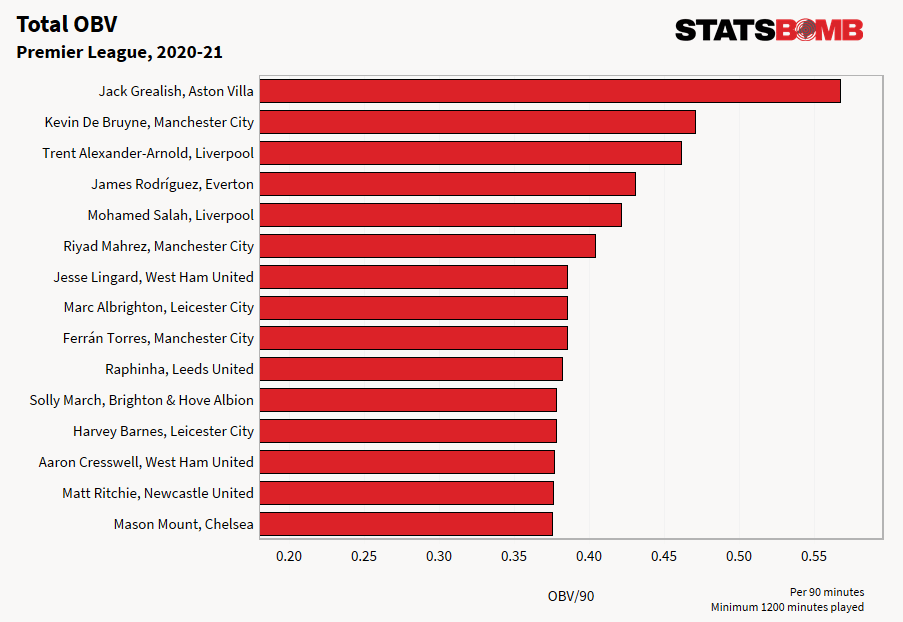
Few surprises here and further justification for Manchester City’s determination to secure Jack Grealish in the summer.
The list itself is slightly attacker-heavy in its current format, but that’s fine – the most valuable actions tend to take place closer to the opponent’s goal, after all – so let’s filter out shots, assists, and key passes from the events to see if we can highlight some players contributing more in the earlier stages of buildup, or through defensive or goalkeeping actions.
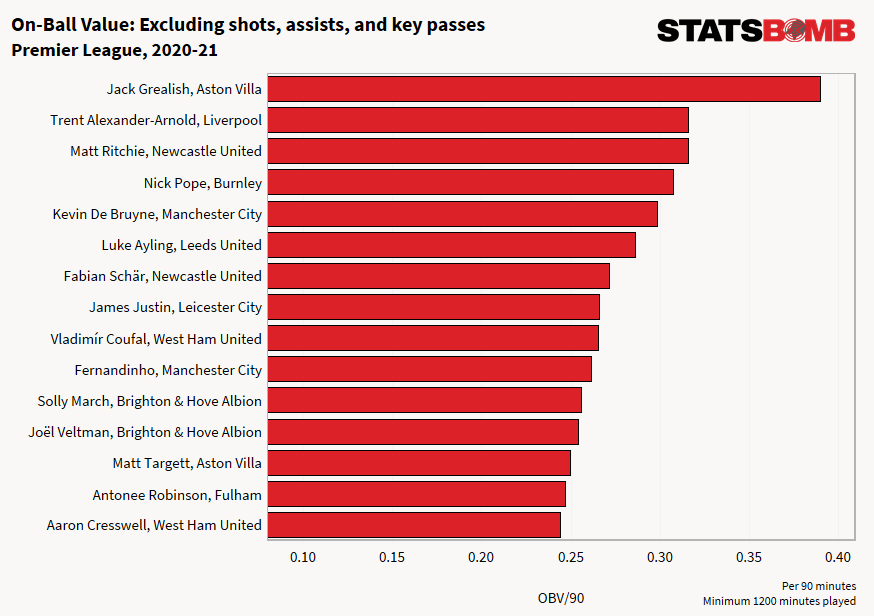
*rolls eyes* That kid at the top again. We’ll come back to him in a minute.
By removing actions that occur and the end of shot-creating possession chains – high-value actions if completed successfully – we’ve managed to pick up Nick Pope’s goalkeeping performances for Burnley, Luke Ayling’s all-around game for Leeds, as well as Fabian Schär’s net-positive contributions for Newcastle.
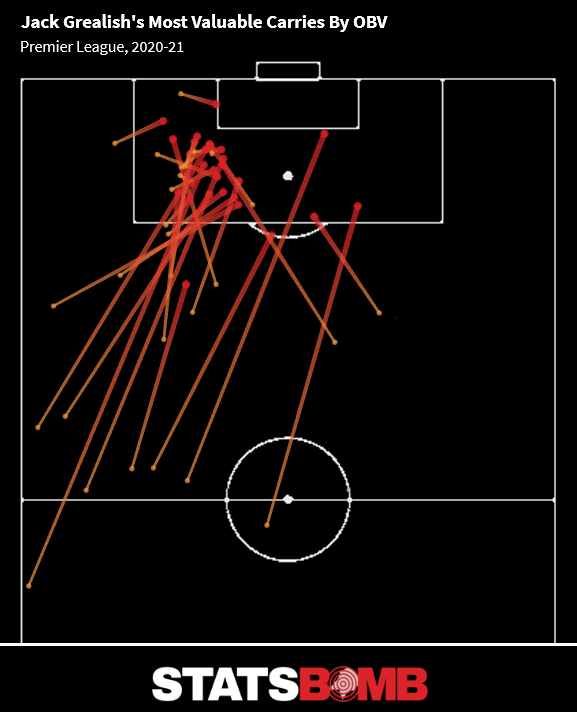
There’s no escaping Grealish, so we won’t try to. Contributor of 16 non-penalty goals and assists last season, the other standout quality was his ball-carrying ability: accumulating far and away the most OBV from Carries in the Premier League despite playing ~two-thirds of minutes. Looking at his 30 most valuable carries by OBV in 2020/21, you get a feel for why they added so much value–there’s some serious territory gained in those searching probes into opposition territory.
Sink further into the data and we can garner even more specific insight if we want and need to. Let’s look solely at centre-backs and the value added through passes and carries last season.
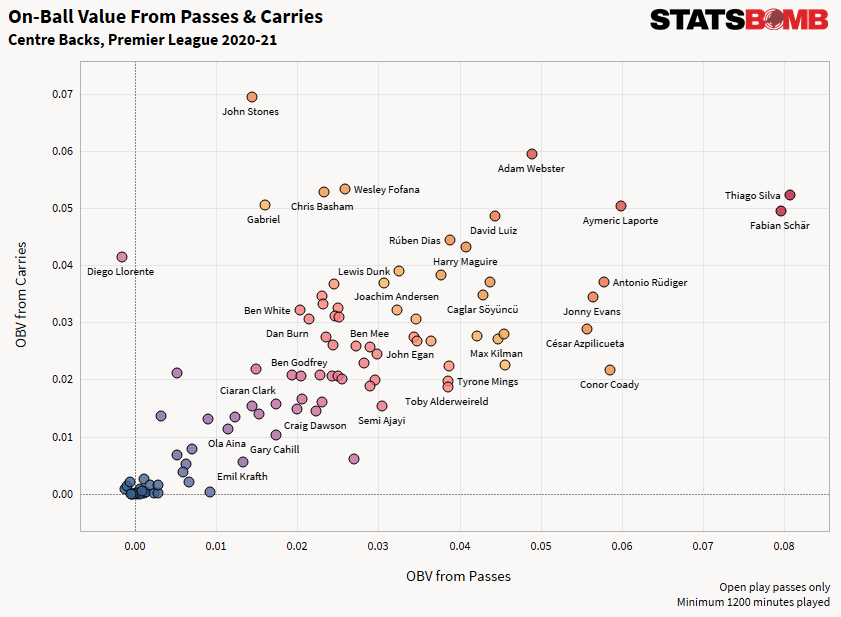
This largely checks out–there aren’t many that have referred to Gary Cahill as a noticeably progressive centre-back during his career. OBV identifies the carries of John Stones and Adam Webster as well as the passing of Thiago Silva and Conor Coady, among others. It’s worth drawing attention to Diego Llorente of Leeds, who added value with his ball carrying but was actually a net-negative on the team with his passing. Perhaps Leeds’ opponents might look to let him have more time on the ball and focus on blocking off the available passing lanes when they come to play against them in the future?
We can also look at actions that took place in specific areas of the pitch. One thing OBV does well that other, more rudimentary metrics may miss is capture high-risk/high-reward players–so long as they are a net-positive contributor with their actions overall. These players are typically found in the final third, so by looking at passes that originated in that zone, we can assess players’ contribution based on their pass accuracy and value added per pass.
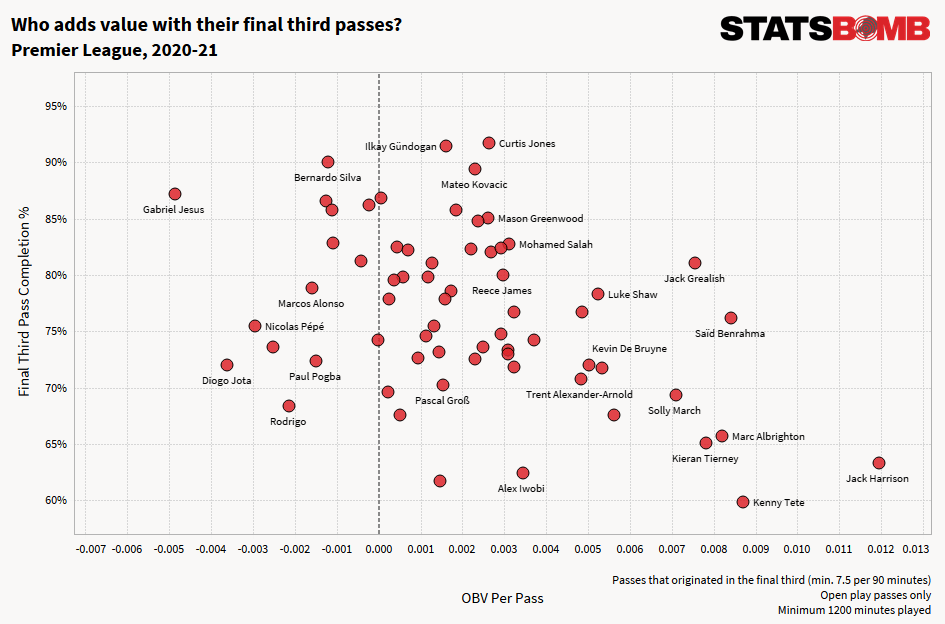
Let’s start with the good. You’ve got the cluster of players in the upper section of the graph–İlkay Gündoğan, Mateo Kovačić, and Curtis Jones. These players add only a small amount of value with their passes but complete ~90% of them in the opponent’s territory. These are your low-risk, medium-reward players–players you can give the ball to and trust not to reduce your team’s chances of scoring if not dramatically increase it.
Then you have Gabriel Jesus in the top-left: your low-risk, low-reward player. Jesus had the lowest rate of forward passes from his final third passes in the entire Premier League last season: just 5% of his final third passes were attempted forwards, with 30% directed backward (4th-highest in the league). We’re all thinking it–this adds further context to City’s summer interest in Harry Kane, a player who can be an elite goal threat AND create and link play in the final third, a skill Jesus struggled with last season.
But at least Jesus retains possession well, which can’t be said of the cluster of Diogo Jota, Rodrigo, and Paul Pogba below him: your high-risk, low-reward players. Whether the problem was with the choice of passes attempted or with the execution of them, these players detracted from their team’s final third play with their passing in 2020/21.
The highly-coveted low-risk, high-reward player? Jack Grealish. Yes, we’ve found yet another metric to demonstrate his elite performances last season. This is the zone you want to be in–players who reliably add value in the final third by attempting higher-value actions but completing them consistently as well. It’s notable that Kevin De Bruyne and Trent Alexander-Arnold are reasonably close by, perhaps falling into a riskier category, as it’s these types of players that can really make a difference to a team’s creative output with their final third passing. Speaking of which, are we sleeping on Saïd Benrahma?
Perhaps the most interesting of all is Jack Harrison of Leeds–maybe the player you could consider to be the highest-risk, highest-reward player, last season at least. There’s something to be said for the volume of passes attempted, of course: Harrison attempted 8.5 final third passes per 90 to De Bruyne’s 14.8, for example, so the rewards are limited by the frequency with which he attempts passes in the attacking third. But despite completing just 63% of them, Harrison was a big net-positive to Leeds with his final third passing overall thanks to an aggressive passing style that greatly increased the likelihood of Leeds scoring when his passes did connect.
There’s also a place for OBV as part of the opposition analysis workflow. We can plot where teams create danger through their passes and carries–the actions most commonly associated with chance creation.
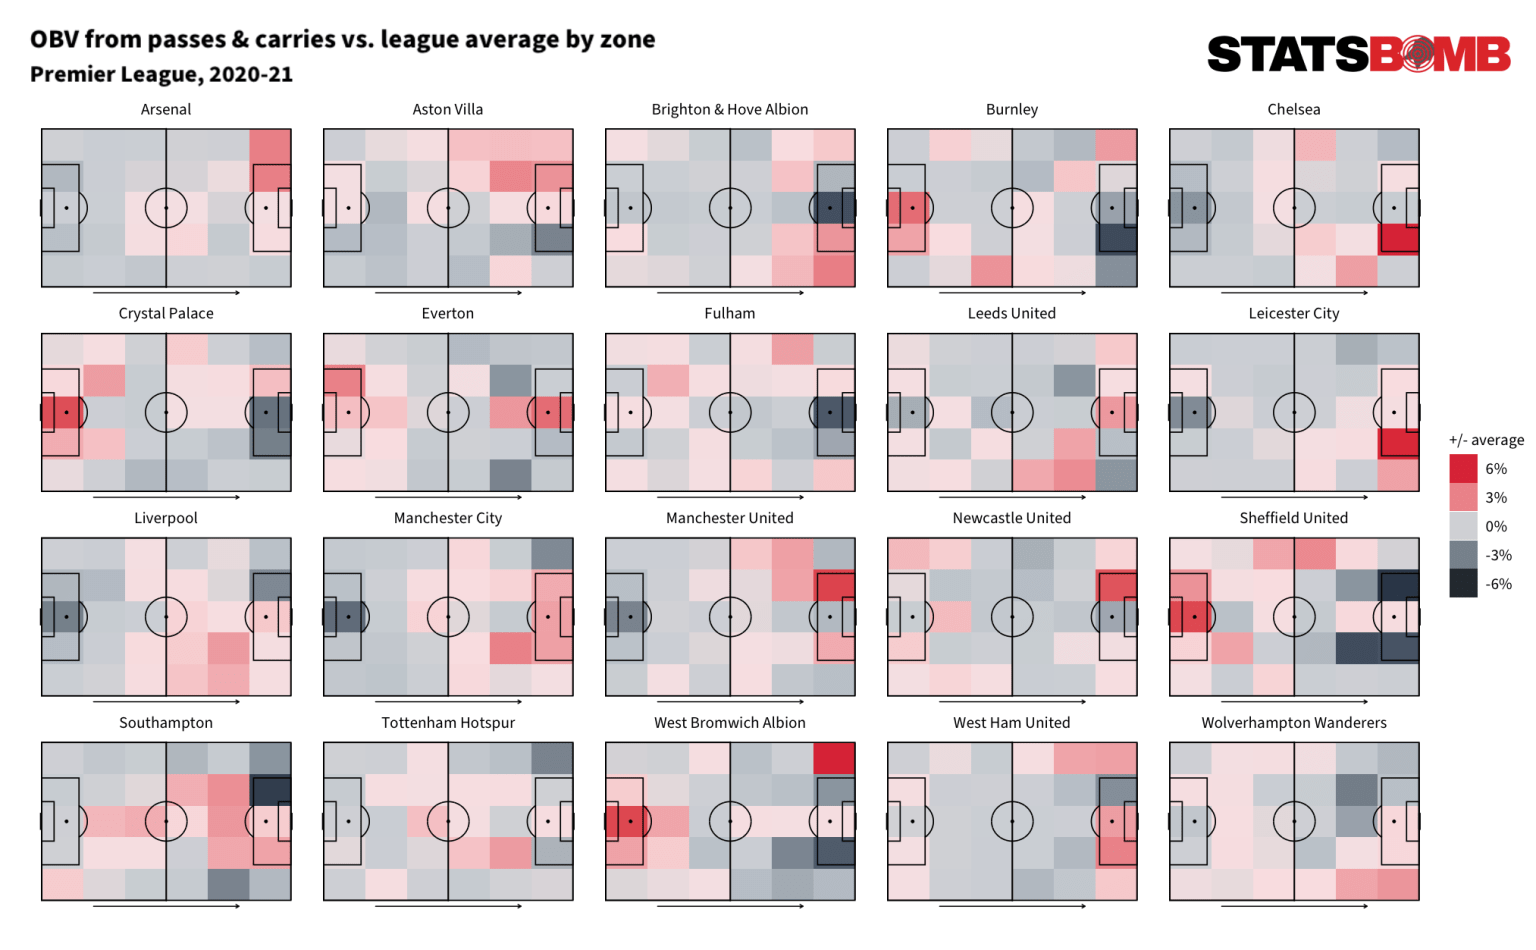
We can quickly see the “Grealish zone” on Aston Villa’s left-hand side, the “Trent zone” on Liverpool’s right, and the “Pep zone” in the Manchester City half-spaces just outside the penalty area. Not every team has the notoriety of those teams, though, and having a tool that can quickly tell you where your next opponents create their danger in possession is a quick and easy win when scouting your upcoming fixtures.
A more simple analysis would be to aggregate the OBV values by event type to evaluate from which actions a team typically creates their threat. Here’s a select few from last season’s Premier League:
- High Passes: Burnley
- Ground Passes: Liverpool
- Carries: Manchester City
- Defensive Actions*: Leeds United
- Headed Shots: Crystal Palace
- Footed Shots: Manchester City
*Defensive Actions in this case are Tackles, Interceptions, and Ball Recoveries.
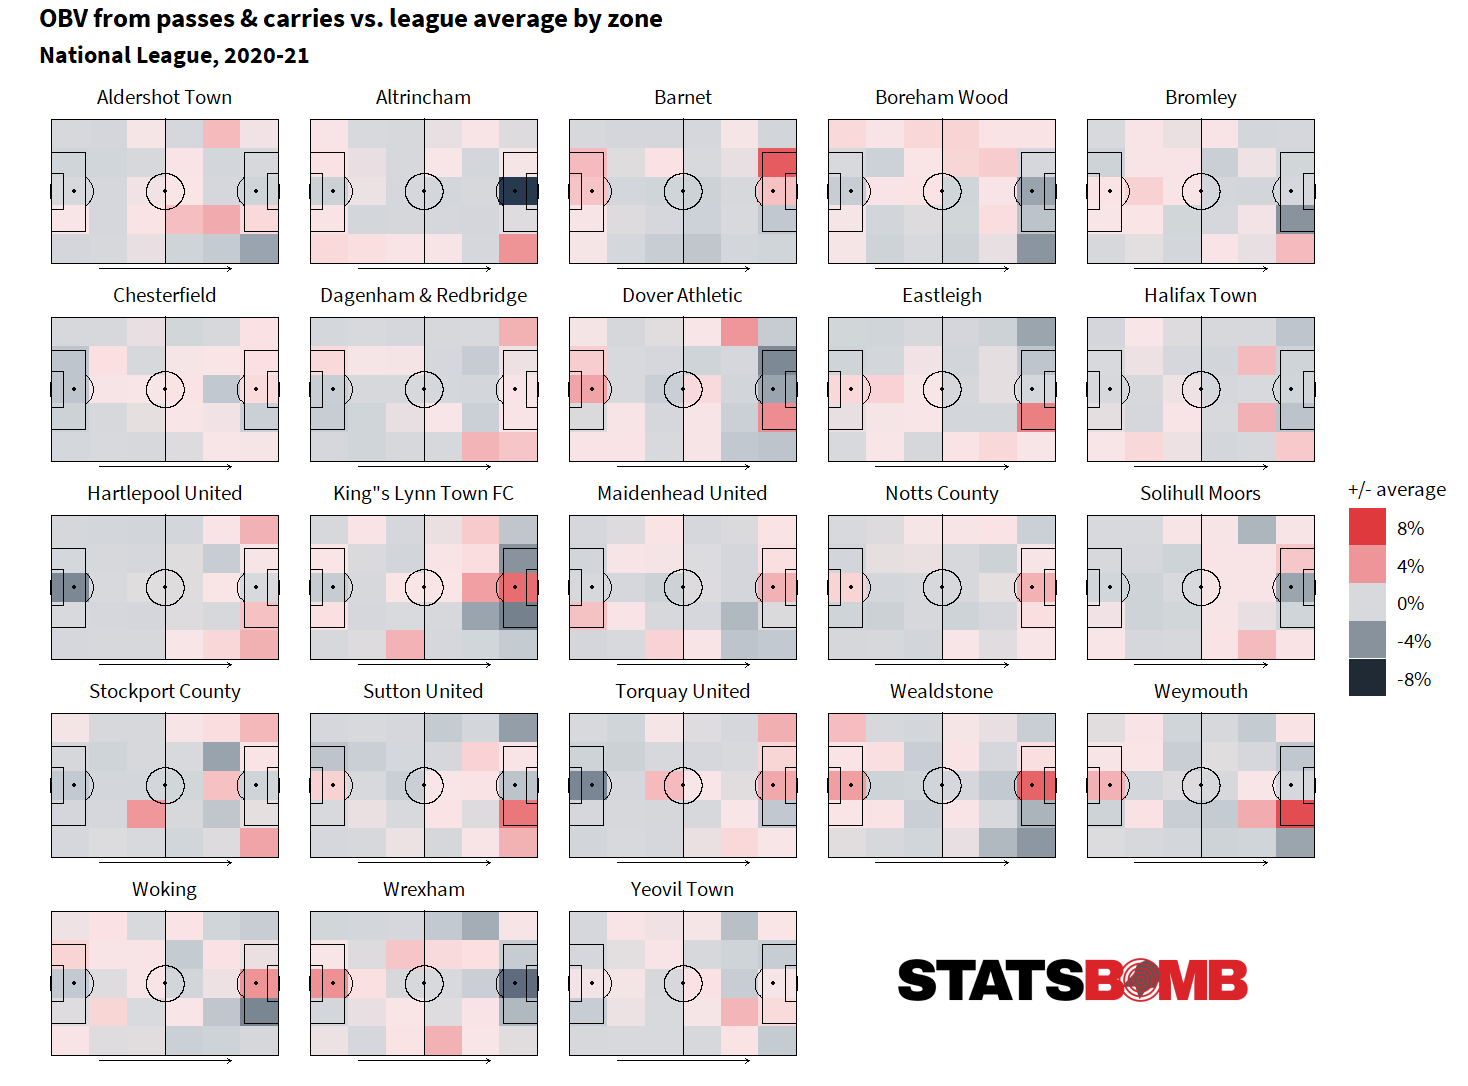
The good news is that On-Ball Value isn’t limited to the elite competitions or the highest-paying customers. We’ve released the model into the data for every one of the 80+ competitions we cover worldwide, so the same cutting-edge tools utilised in the Premier League can also be used throughout the English Football League and even in the fifth-tier National League…
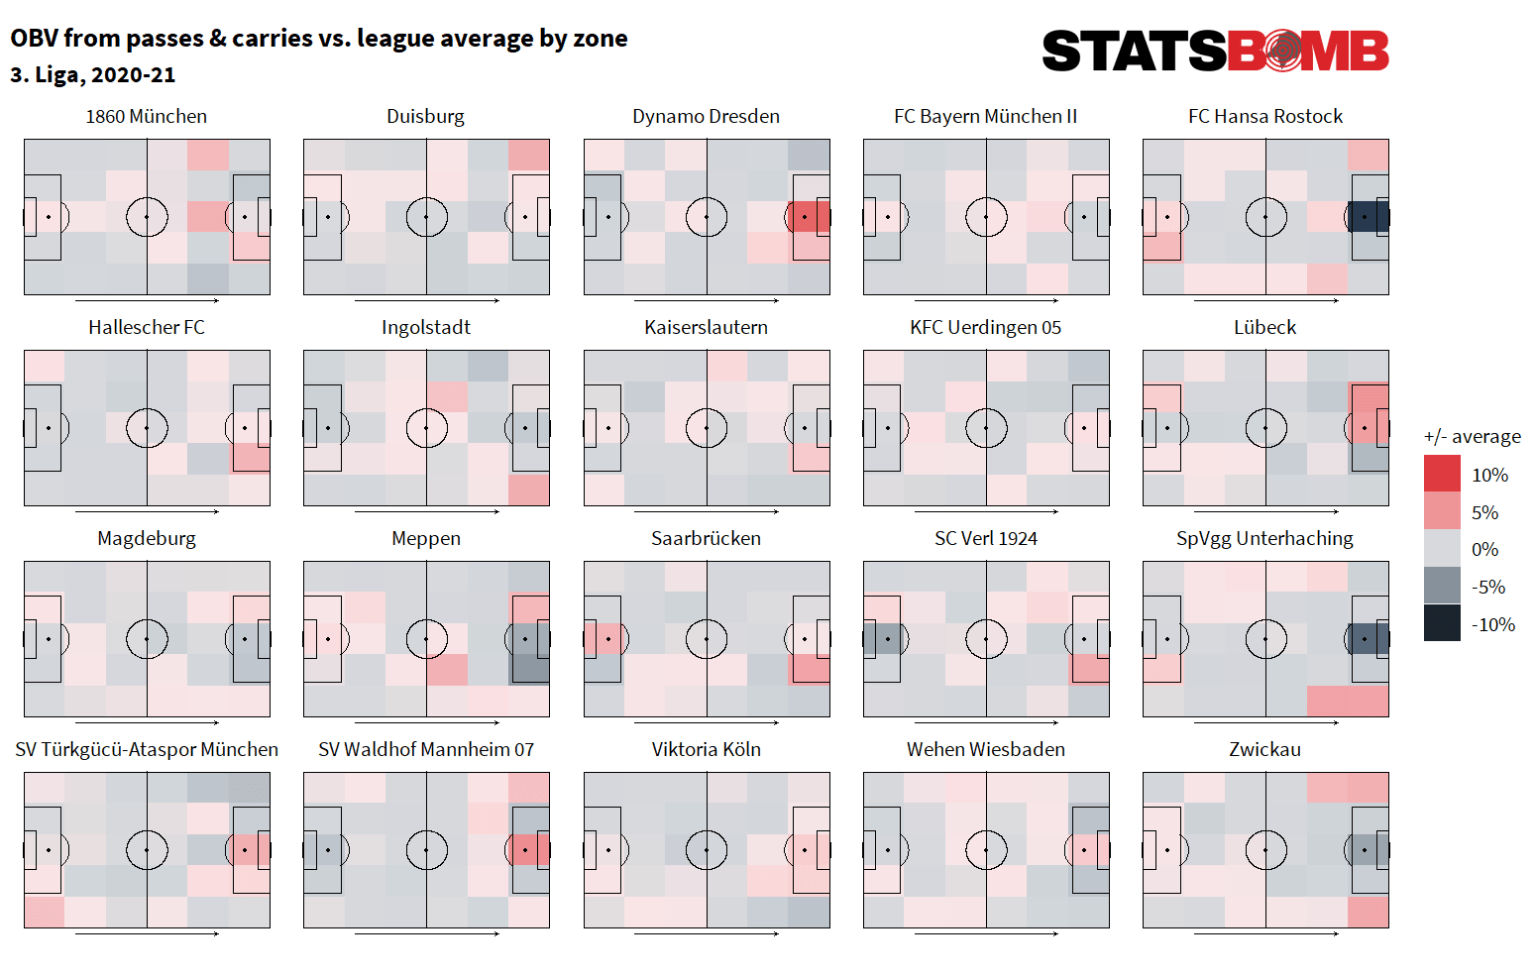
…*throws dart at map* or the 3. Liga third-tier in Germany…
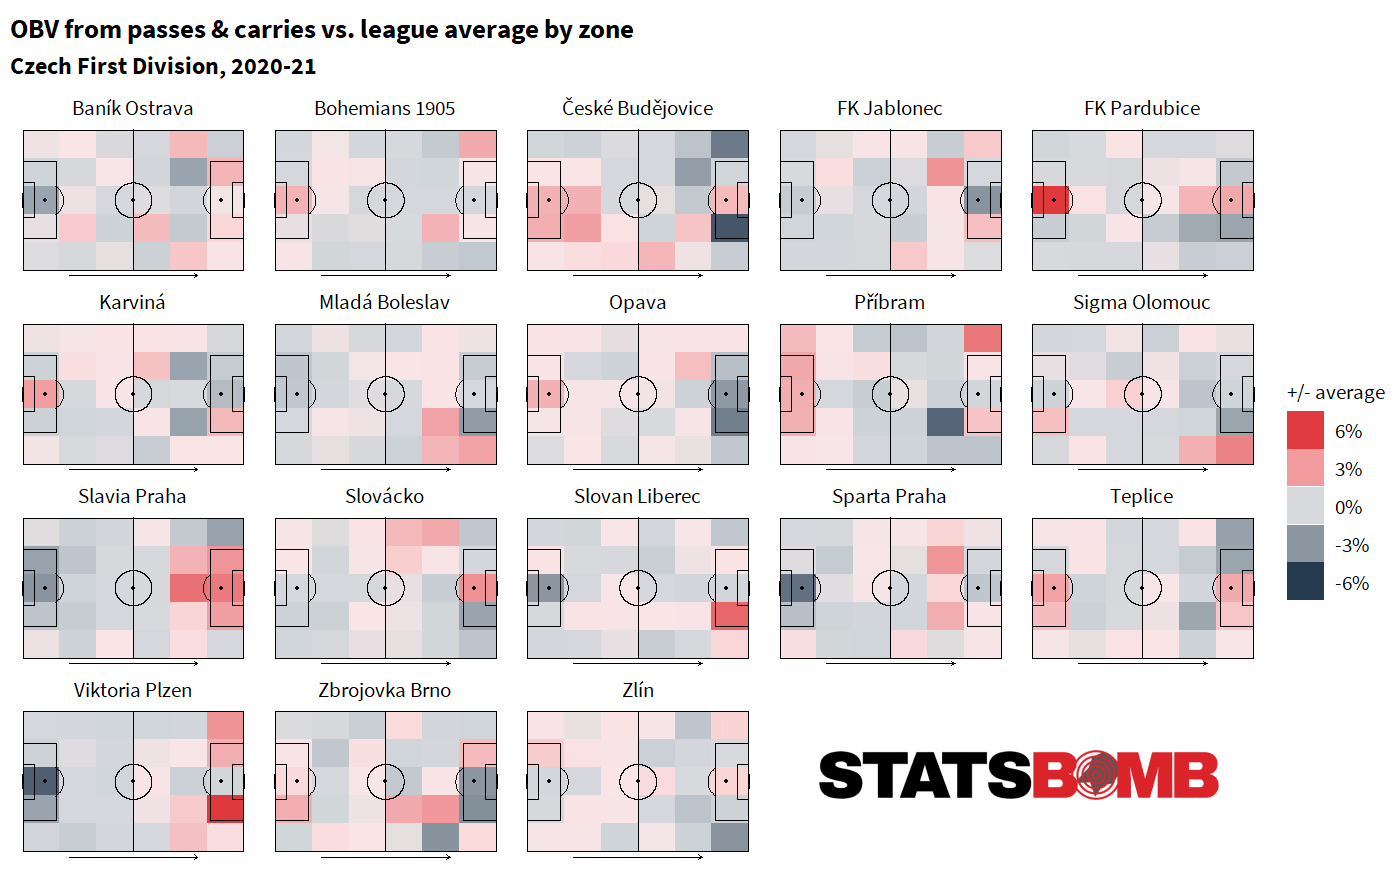
…*closes eyes, spins globe, jabs finger into central Europe* or EVEN the Czech First Division:
Our customer’s success is central to what we do at StatsBomb and we want to support them in any way we can. Weaponising our expertise to provide state-of-the-art analytics tools, such as On-Ball Value, can help them achieve their objectives.
OBV is the first of many upgrades in the latest round of developments to the StatsBomb toolkit. Stay tuned for more.
