It is often portrayed that there is a battle taking place in sports organizations between Analytics and Scouting. In high functioning organizations, that is not actually the case. Analytics, and scouting as well, are tools that help give organizations more information to make better decisions.
Ben Alamar had this to say about analytics in his seminal book Sports Analytics: A Guide for Coaches, Managers, and Other Decision Makers.
“That is, in many ways, the value of analytics (in sports and otherwise): they force you to ask more and more refined questions. Those questions do not improve results just for the sports-analytics expert - they can help everyone in the organization find better and better ways to play The Game.”
One area that analytics and scouting are different though is language. Analytics uses stats and acronyms like EPA, CPOE, and RYOE. Whereas scouting uses terms like “Good build”, “Heavy Hands”, and “Moves feet well”. One of my favorite ways to use analytics is to bridge gaps, and help people (who may not be predisposed to math and numbers) understand the numerical things a little bit better. For today’s article I wanted to touch on a common scouting refrain for each main position group, and show how analytics can help quantify some of the old scouting terms or phrases.
Quarterbacks
“This quarterback has a cannon”
“Can throw the ball a country mile”
“Strong arm”
If you’ve seen a pro day over the past few years for the top QB’s in the country, you probably have noticed something. One, it’s much easier to throw the ball when there is no defense, no concepts to read, and no shoulder pads/helmet interfering with delivery. But number two is the throw set that each quarterback is doing. These performances are like a band’s setlist, with throws specifically ordered and set up to show off the quarterback’s individual skills. If the quarterback has a “cannon”, this throw list usually builds to some throw showing off the ridiculous arm strength the quarterback has. Something that will leave the scouts and twitter talking for days.
But how hard do quarterbacks actually throw the ball in the game? Let’s take a look at the top four quarterbacks in the NFL Draft (C.J. Stroud, Bryce Young, Anthony Richardson, and Will Levis).
Which of these quarterbacks had the strongest in game throws this past season? Using throws that went between 25 and 45 yards (not just yards downfield, actual distance the ball is traveling) we can get a feel for arm strength by measuring the time it takes to get from the quarterback's hand to the receiver. C.J. Stroud and Anthony Richardson make up 13 of the top 15 hardest throws this past season with Stroud having 7, and Richardson 6. Will Levis and Bryce Young have 1 each.
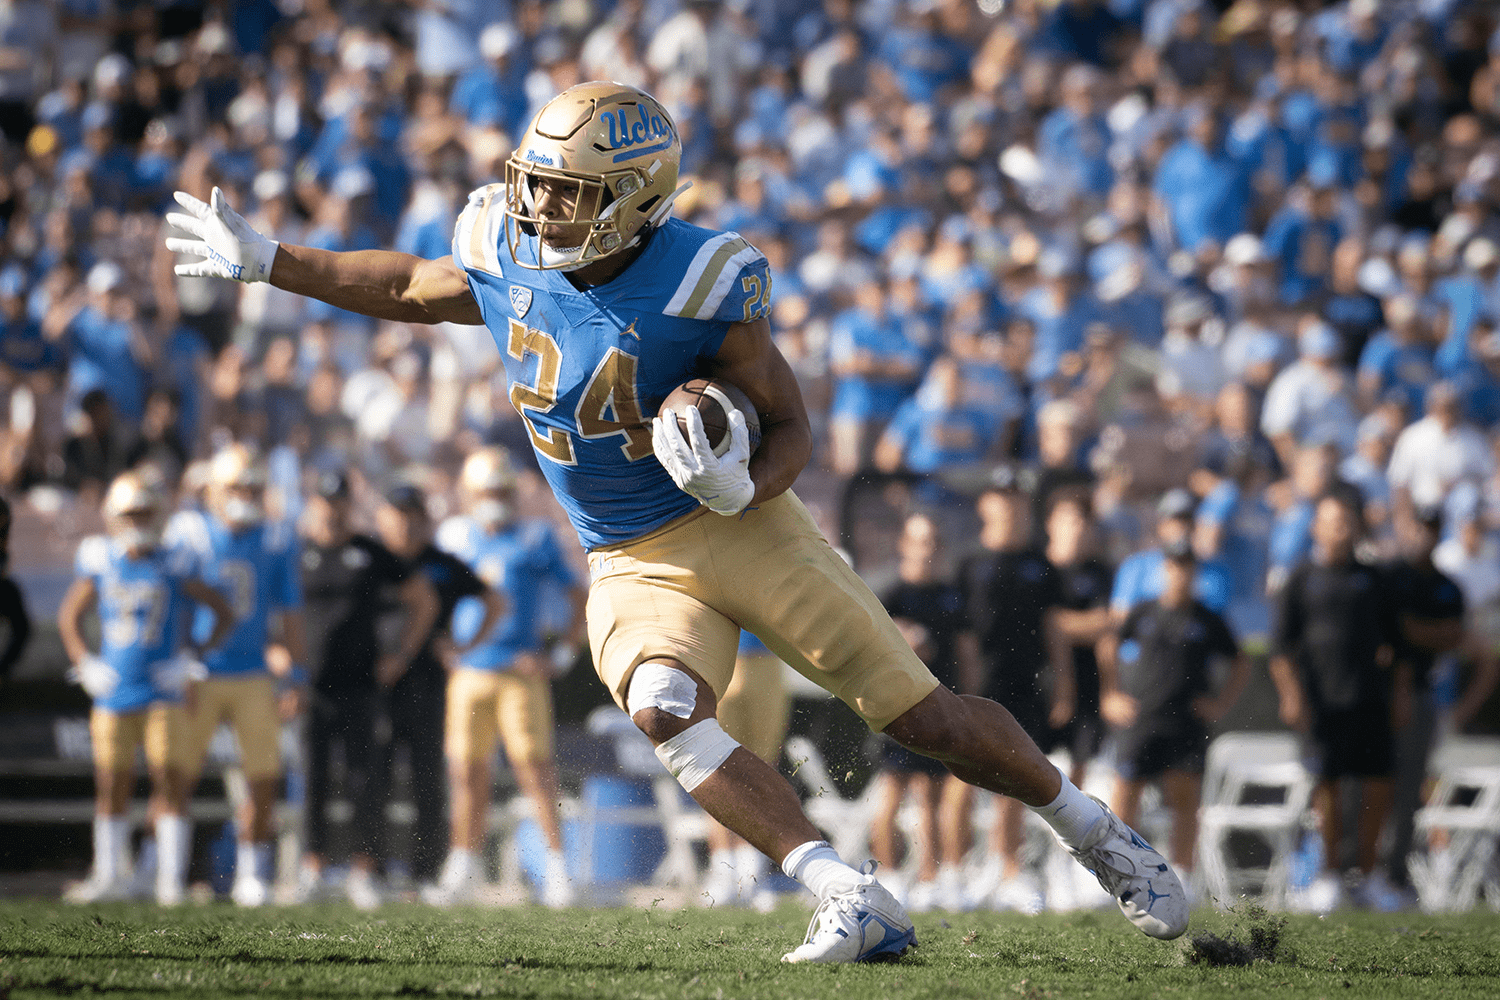
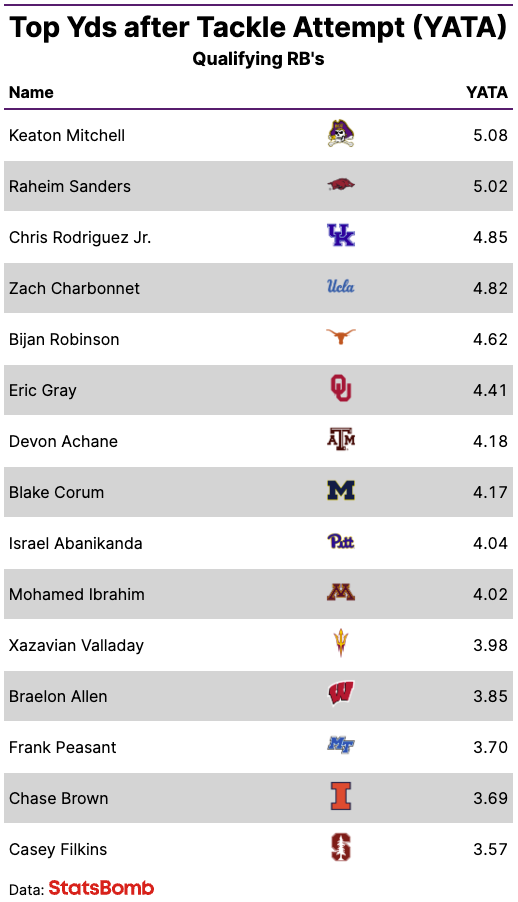
Running Back
“Runs through defenders”
“Has great contact balance”
At StatsBomb we collect every tackle attempt, who is involved, where on the field it happens, and the outcome of the tackle, including how the tackle was broken (spin, stiff arm, juke, etc). We also collect if contact was actually made. Using this data we can analyze not just yards after contact, but yards after any tackle attempt was made. Running Backs like Barry Sanders and Reggie Bush were penalized using yards after contact instead of a more accurate stat like yards after tackle attempt! Imagine being so good at not allowing someone to tackle you that it hurt your YAC numbers because they weren’t able to even get a hand on you!
The top Running Backs from 2022 are listed below. Draft darling Bijan Robinson shows up high on this list, but some other potential later selections do as well including ECU’s Keaton Mitchell, and Zach Charbonnet from UCLA.
Wide Receiver
“Catches anything thrown his way”
“Has a great catch radius”
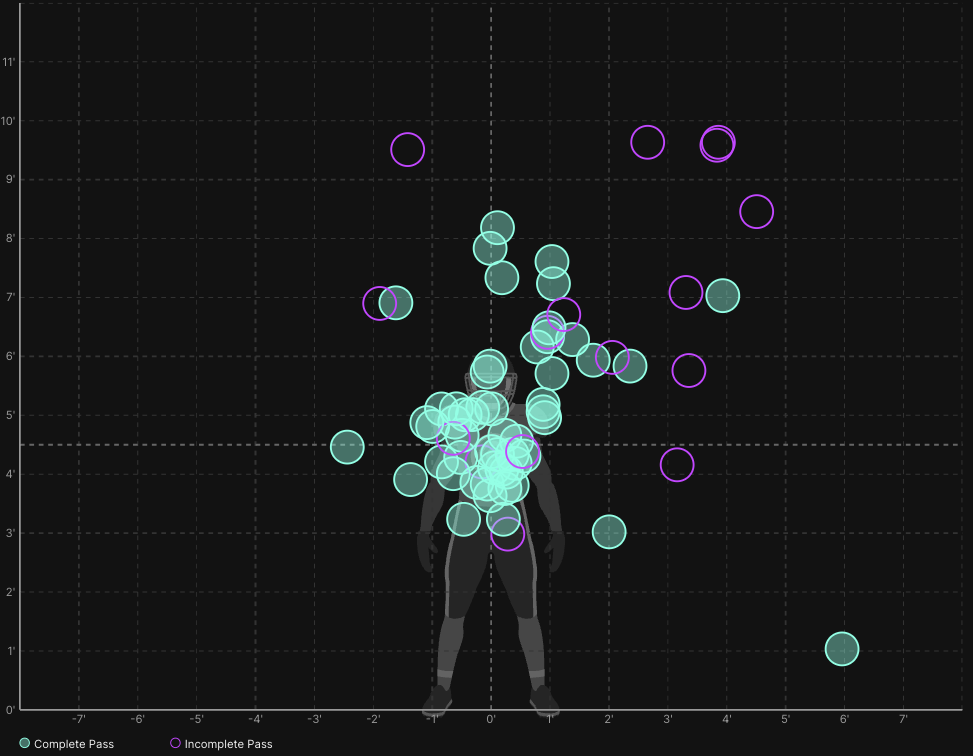
One of my favorite pieces of data that we collect at StatsBomb is the pass placement for every possible catch attempt. Some throws are either batted at the line, are throwaways, or are otherwise so off target it is hard to know who the ball is actually intended to be thrown to. But, anytime the ball reaches a receiver, we collect the location of that pass relative to the center mass of the receiver. We have rules for different types of catches as well, including over-the-shoulder catches. This allows us to analyze what is happening in the pass game in many ways, but one of my favorites is to look at how well receivers catch their targets.
Using the great resource Grinding the Mocks from Ben Robinson (@GrindingMocks), there are four WR who are likely 1st round picks: Jaxson Smith-Njigba, Zay Flowers, Jordan Addison, and Quentin Johnston.

Zay Flowers was thrown some rough passes this past season, but did really well on ones that were close to his center mass. He does a really good job catching passes that are low as well.
First off, it’s easy to see why people are so high on Caleb Williams. Look at all those passes right at the hands of Jordan Addison! Addison lined up almost exclusively on the right hand side of the formation, and it makes sense that he would have a lot of passes that are in that upper right hand quadrant. These are likely passes that are high and away from defenders on out routes, corners, fades, etc. Addison does a good job corralling passes that are thrown to him.
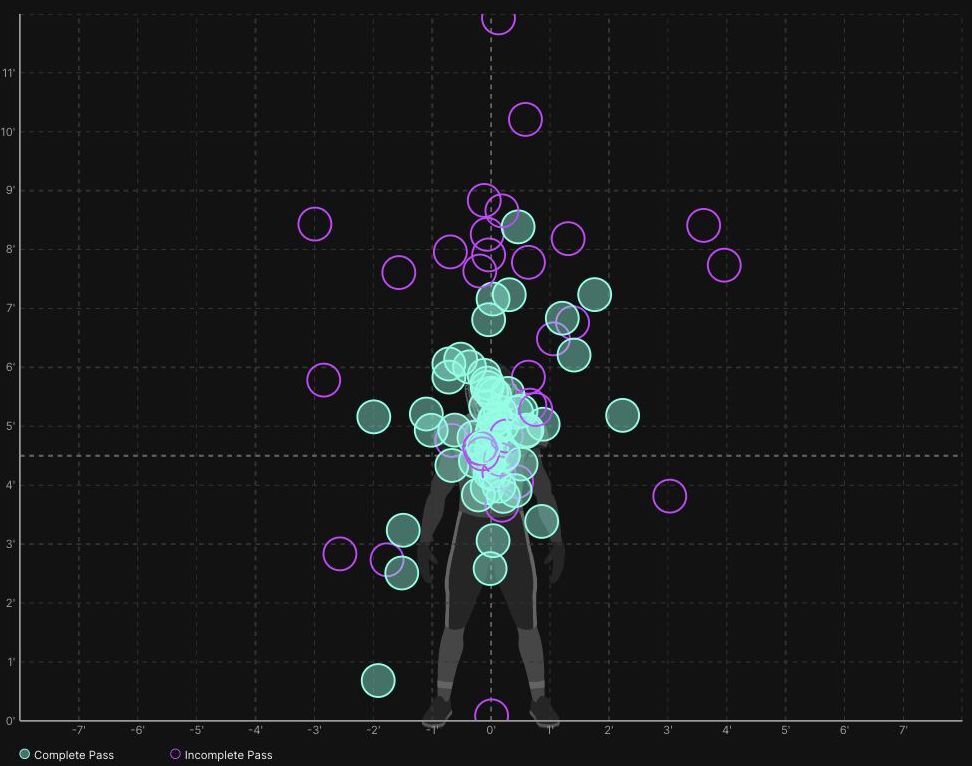
Quentin Johnston has the measurables that make teams salivate. 6’3” 210 pounds, 40.5 inch vertical, 11’2” broad jump, and 4.5 speed in the 40. His pass placement chart shows many throws up high, with quite a few incompletions. You would like to see someone with Johnston’s size complete more of those jump ball type catches.
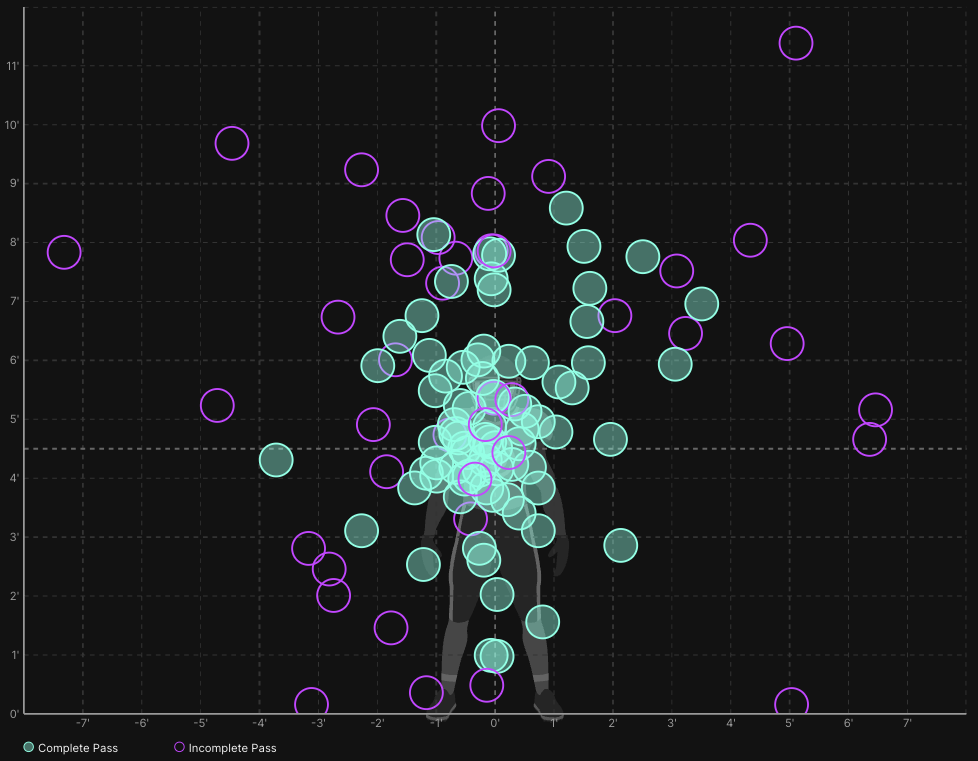
Jaxon Smith-Njigba didn’t play much this past season due to injury, so I don’t have a pass placement chart for him, but now seems as good a time as any to include the chart for his teammate, and future 1st round pick, Marvin Harrison Jr. He has the widest catch radius of all these receivers, and has shown the ability to catch the ball anywhere it is thrown to him.
Offensive Line
“Really athletic in pass pro”
“Has great feet”
NFL Teams want the most athletic players at all positions, but one position where being athletic stands out more than any other, is offensive line. Maybe it’s because offensive lineman are 300+ pounds, and are not asked to show their athleticism often. Maybe it’s because people don’t consider it “athletic” to move in short bursts. Whatever the reason, the athletic tag holds more weight (pun intended) for offensive lineman than any other position.
When thinking about data that can support the idea of athletic offensive lineman, it is important to look at what aspect of their game shows athleticism. Something that shows athleticism to such a degree that it became part of a viral TikTok trend, is the pass set. Moving as quickly as possible to a specified point and then transitioning to be in position to block a defensive rusher is very difficult. At tackle, you want to get as much distance as you can to make the pocket as big as possible, but still be in control enough to actually block the defender when you get there. With our line engagements data, we can look at how far offensive tackles move before making first contact in all their pass sets.
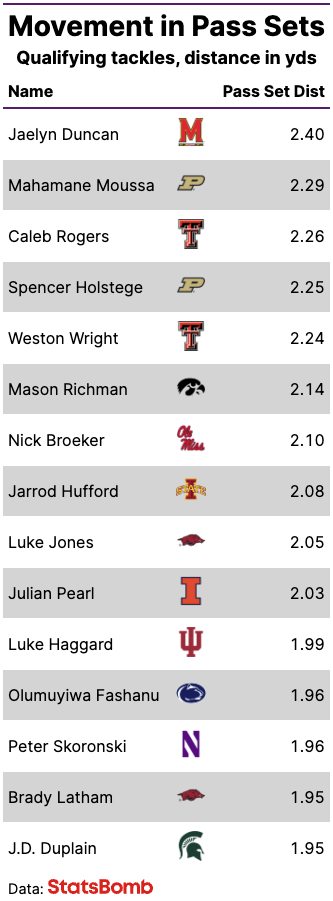
First let’s start at the top. Jaelyn Duncan has the most movement in his pass sets, and taking a look at what scouts are saying that matches up. “It’s easy to love the athletic flashes”, “Good quick lateral agility”, and “Easy, fluid mover with light feet out of his stance, gliding to set points and landmarks in pass-protection” sound like things you would hear about the type of player that moves the most in his pass set. Peter Skoronski is a projected first round tackle, and also was one of the top movers at offensive tackle.
Defensive Lineman
“Great get off”
“Quick off the ball”
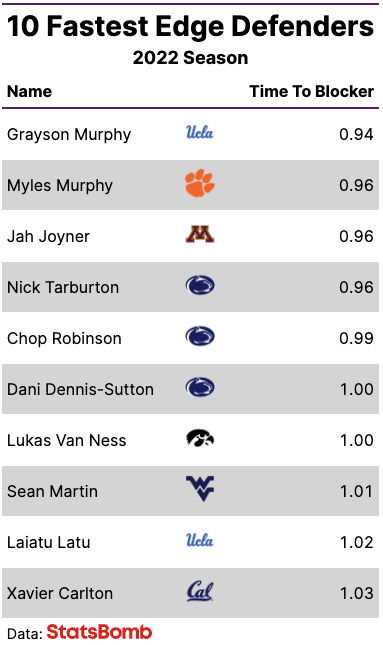
I wrote a whole article on this (which was what got me thinking about this piece as a whole) last week. Check it out for more in depth analysis, but I will post the chart with the top edge rushers off the ball here for reference.
Linebackers
“Tough, run stopping player”
“Brings players down with force”
Similar to the discussion on yards after tackle attempt (YATA) for running backs, we can use the same stat to look at linebackers. This time though, I wanted to show off another tool from our IQ platform, our tackle map.
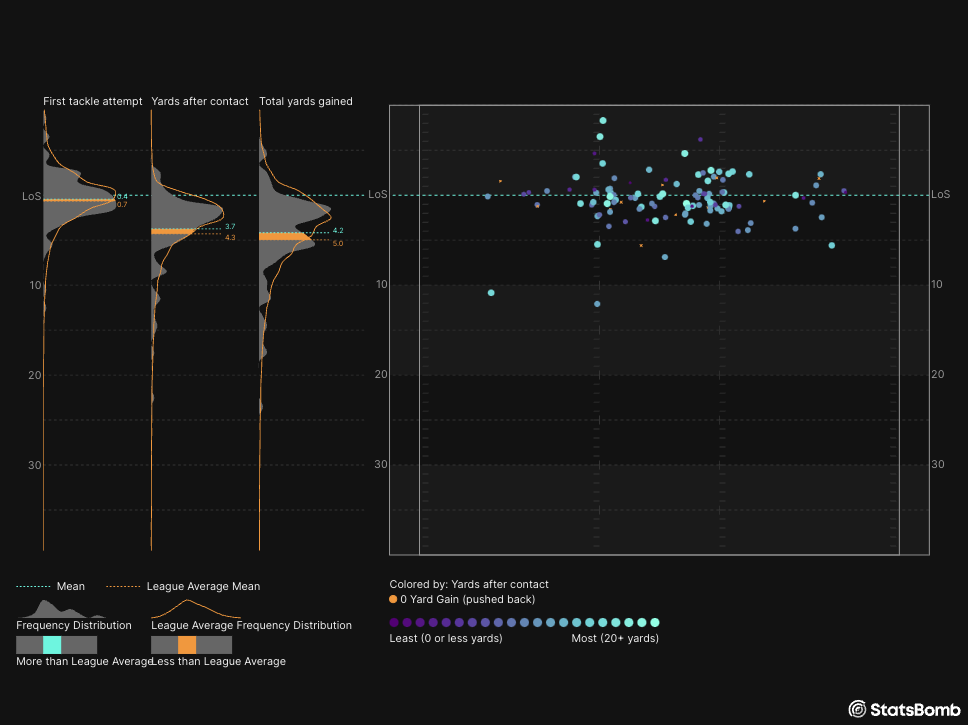
From the distribution on the left hand side, we see that Jack Campbell is better than average in yards after contact. And we can see from the visual where those tackles are happening. The orange dots represent tackles where the runner either gained 0 yards or moved backwards on impact. He has the range to make tackles all over the field, but also has the ability to be a run stuffer inside the box.
Defensive Back
“The most physical rerouter in this year’s draft.”
Many of the quotes for these positions are made up, or are a mixture of common tropes. This quote is an actual quote from nfl.com’s strengths profile of Joey Porter Jr. Using tracking data, we not only can track movement, but also the ability to keep someone from moving. In plays where the corner was in press coverage, and looking at the change in depth 1 second after the snap, we can see how little ground each corner gave up. Joey Porter Jr was 4th in the country in least distance moved, and averaged only .131 yards in depth on all his press plays. .131 yards! I’d say that counts as physicality at the line of scrimmage.
Summary
Each position on the football field is so unique, and requires a lot of expertise to properly evaluate. Analytics and scouting should work hand-in-hand to deliver the most information possible to decision makers so they can make better informed decisions on draft day. I can’t wait to see how round 1 plays out tonight and get a better feeling for which teams have unified front offices with scouting and analytics working together.
