In the initial announcement of StatsBomb’s Football data last week, CEO Ted Knutson gave an overview of the datapoints and insights being unearthed for the first time. Then, Head of Football Analysis Matthew Edwards broke down what can be learned pre-snap from personnel groups, formations and pre-snap movement. Today, we introduce some of our tools for examining the passing game.
The passing game has never been more important than it has become in this era of high tempo and spread formations. Traditional counting stats such as yards, touchdowns and completion percentage have gone through the roof as coaches find more innovative ways to get the ball downfield to receivers in space.
In this environment, figuring out the approach a team or player takes to move the ball through the air is far more important than simply measuring the yardage gained or even per-play efficiency of those gains. The “what” is already well accounted for and some information is available on “when” and “where.” But the more important aspects - “why” and “how” - have been hard to discern. Until now.
StatsBomb’s highly granular data is designed to allow for evaluating the passing game, whether for scouting an upcoming opponent or analyzing a QB as a draft prospect or transfer portal target.
For example, Virginia’s Brennan Armstrong is projected to be picked in the middle rounds of the 2023 draft. A lefty with a quick release and an arm befitting his name. His statistics are impressive as measured by standard metrics, but more important for the scout, analyst or personnel evaluator, how does he get there?
With StatsBomb’s football data, where he looked to throw the ball in the Cavaliers’ offense is readily visible:
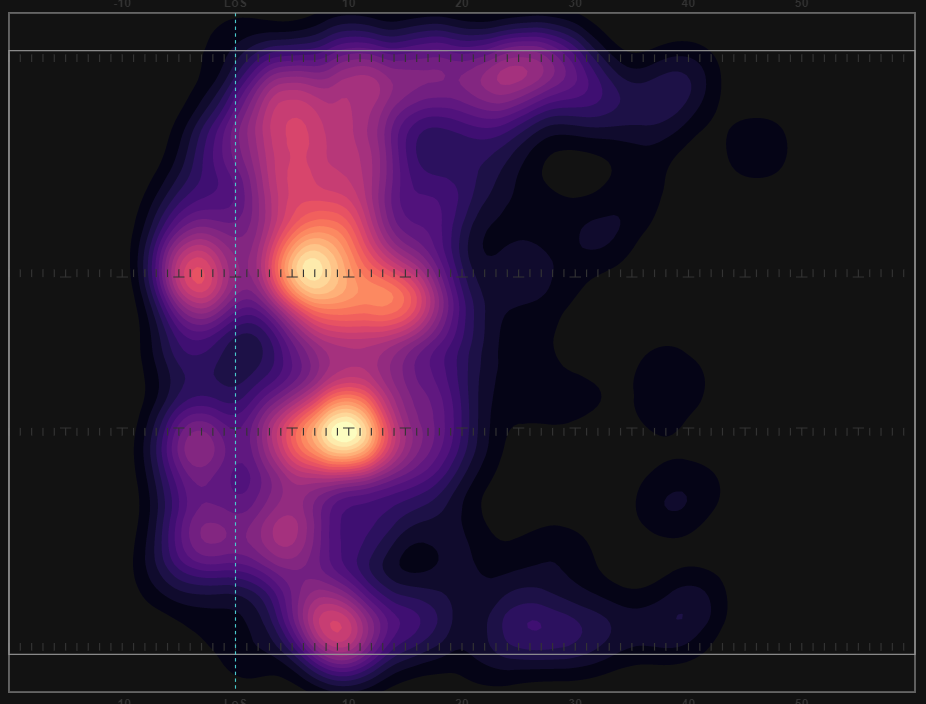
As a southpaw, it shouldn’t be a surprise to see that he used the left side of the field and especially the left sideline more than the right.
Aggregates are interesting, but if there’s one thing we know about football is that each play is highly dependent on situation and context. So for example, we can also compare what Armstrong does with the ball on 1st or 2nd & 10:

...and with his choices on 3rd and 5 or less:
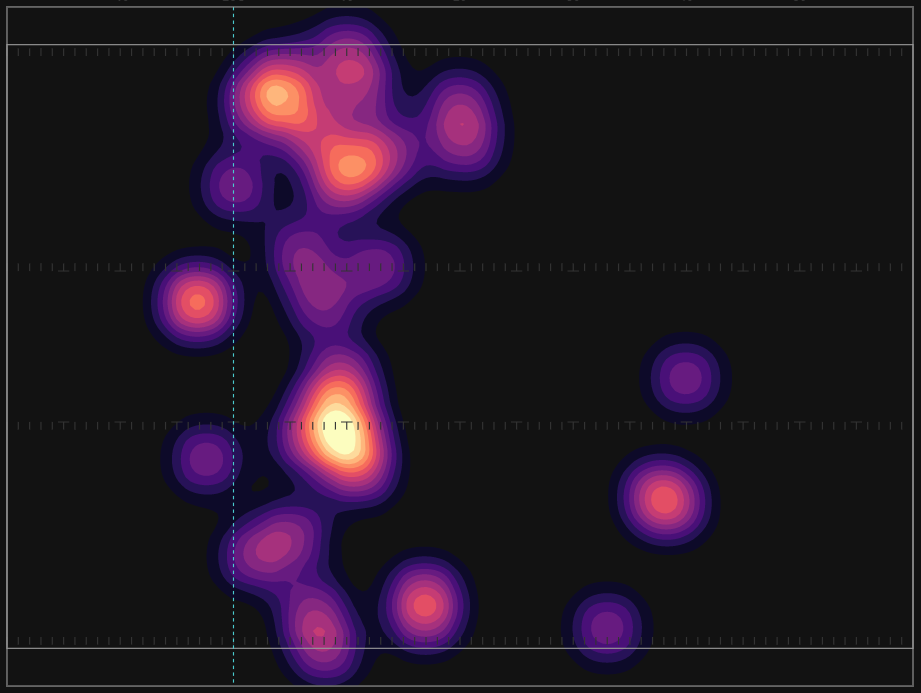
Taking into account that Armstrong had around 8 times as many attempts in the first scenario compared to the “third and manageable,” it appears Armstrong was more willing to throw across his body to the right side of the field and even go vertical down the field to the right hash area.
But we aren’t talking just aggregates and heat maps. Detailed information about each throw means knowing
- Situational context: down & distance, time & score
- Offensive and defensive personnel packages and formations
- Pre-snap motion
- Degree to which the pocket held up or the quarterback was pressured
- The QB’s location at the time of the throw, both X,Y and relative to the snap location and line of scrimmage.
- Similar locations for the end point of the pass be it completion, incompletion or interception
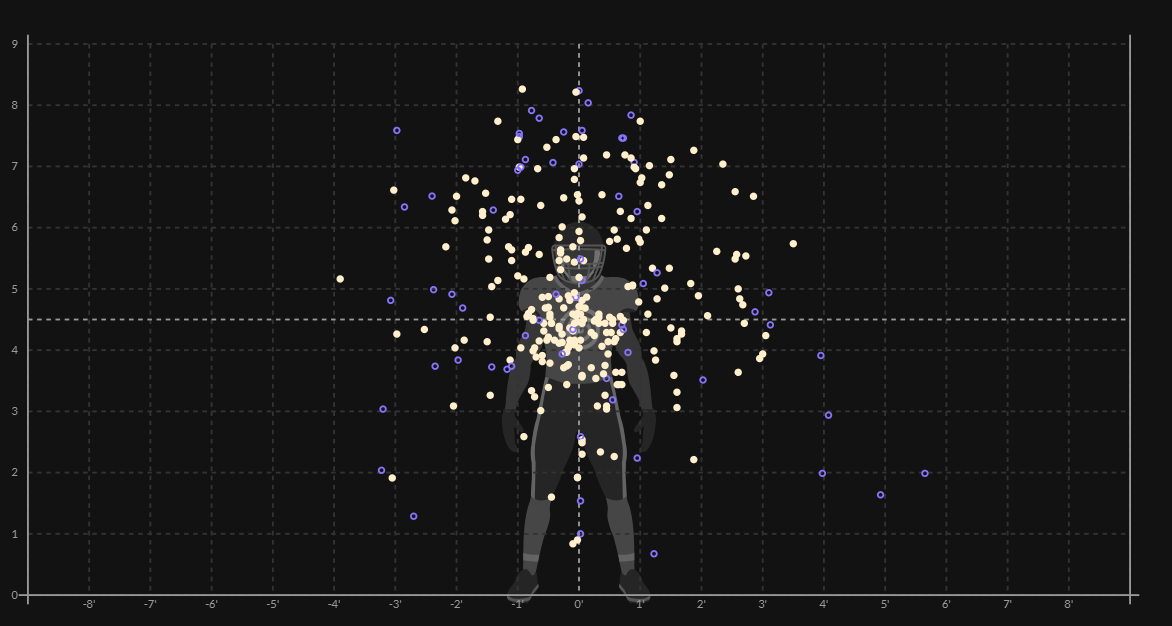
Keeping with the above, let’s take a look at the individual throws which make up Armstrong’s sample in our data:
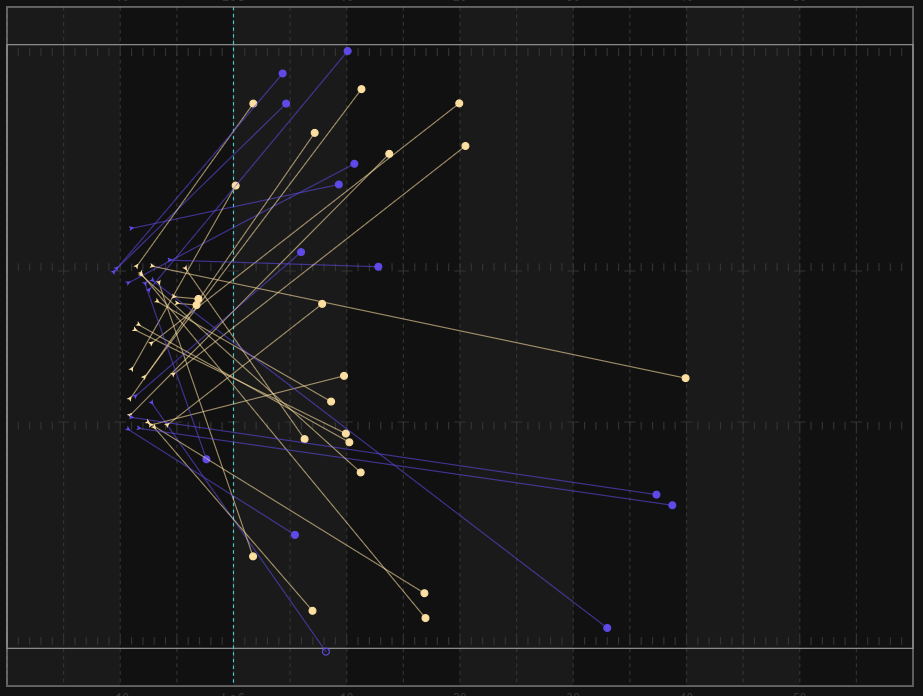
But there’s more. Especially in a draft analysis or transfer recruitment context, passer and receiver skill would be separated. Simply looking at completion rates gets you so far, but how much of that completion rate is driven by receivers either dropping the easy ones or bailing a QB out with spectacular catches on wayward tosses?
Our pass placement tool helps provide an answer, turning a passer’s intended target into, well, a target:
And finally, since we have the routes of all eligible receivers on a play and know the locations of all 11 defenders, we can isolate the moment the ball was thrown and look at who was open. Is a QB conservative, rarely trying to fit passes into tight coverage, or is he prone to take big chances, trusting his arm and his target to keep the ball away from defenders and the chains moving forward?
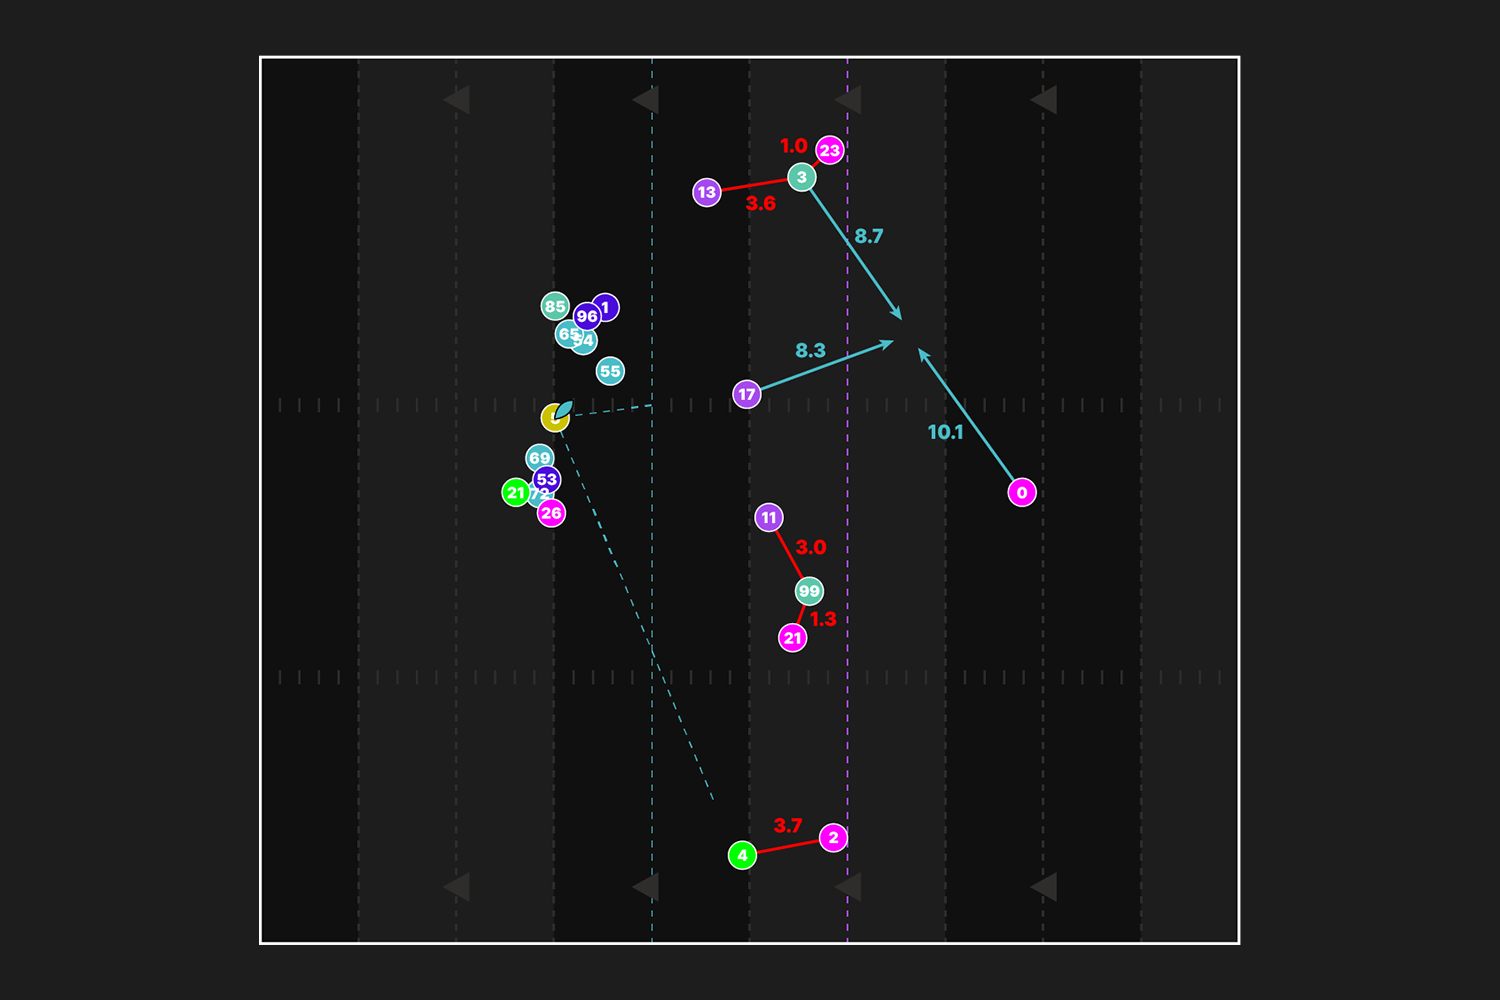
On the play above, the quarterback chose to throw to #4 near the right sideline. With 3.7 yards of separation from the nearest defender (#2), he was the most open player even before accounting for the double teams on the other two potential downfield targets. Of course, separation isn’t just about static distances. Players are moving very quickly and identifying whether a receiver will be open where they are going to be when the ball gets there requires accounting for that movement.
Receiver #3 in the example was in the process of running a slant across the left hash. Our data can account for both the positioning and movement of both the linebacker underneath (#17) and the safety covering over the top (#0). There might have been a window for a possible throw, but if so we can see it would be only narrowly open. While the computation of that window and the probability of a completion to that area is complex, our data provides the raw information necessary to perform this analysis.
This is all just the start. Next up, Matt will be back to get into even greater depth on analyzing the passing game using StatsBomb data.
Seth Partnow
Advisor to the CEO & Director of Basketball - StatsBomb
seth.partnow@statsbomb.com
@SethPartnow on Twitter
