In May of 2018, StatsBomb introduced StatsBomb Data and fundamentally changed how the world of soccer operates. By the time May 2022 rolled around, we were working with over 100 soccer teams around the world. Our customers won 17 domestic league titles in 21-22 alone, along with myriad cups, promotions, and playoff places.
It’s June 2022, and today we’re officially launching American Football. It’s my job to tell the world why a soccer company is sinking their teeth into America’s favorite sport, why you should care about it, and why it’s going to change how football is coached and analyzed.
Why Bother?
Normally these introduction posts dazzle you with the “what” of a thing, but I’m going to switch it up and answer the obvious question in the room: Why is StatsBomb doing American football? Data in this sport already exists - why enter a highly competitive market?
First of all, I think that the data companies already in football produce good media products. Their content is good, and the information they deliver is excellent at starting arguments on a weekly basis, which is really what you want in the media space.
However, when it comes to what actually happens on the field? It’s not good enough. If you talk to smart NFL teams, they don’t use grades… “Too subjective.” “They don’t deliver enough information about what players do on the field, both good and bad.” Listening to feedback from professionals who actually use data in this sport - and there are now quite a few of them - there was clearly space for someone to deliver a better, more objective product.
Enter StatsBomb.
One thing that makes us different is that we design new data products to be the best in the market at the point we enter them. Which is today. But the product journey for us started ages ago.
We spent six months just talking to people who work in football to find out where the problems were. Once we understood that, we produced the most detailed data spec for this sport that we could imagine. Then we assigned developers to create the collection software alongside our AI group working on tracking elements. Fourteen months later, the data is now in production.
But unlike in soccer, one of the problems we had here was that we had never worked in this sport as a coach or a quant. So I moved my family across the world and spent the 21-22 season embedded with coaches to learn what their workflows look like. What problems do they tackle on a weekly basis that StatsBomb could help with?
Alongside producing great data, the question we asked over and over again was: How can we make coaches’ lives better?
What we have ended up with is a beast of a data spec that captures everything that happens on the field, for every play, and a growing toolset that will help coaches and analysts be more productive across every facet of their jobs.
What Is In the Data?
What we have produced is a hybrid data spec that combines computer vision and human collection to produce the most detailed data in the business.
That’s a lot of buzzwords, so let’s break it down to the basics. We know
- Who was on the field for every play
- Where they lined up at snap
- What each player did
*taps the roof of the data spec*
You can fit so. much. info. in this bad boy…
It really is beefy. For those familiar with our soccer product, it’s as if we combined base data, StatsBomb 360, and human growth hormone to produce more information in a base data spec than ever before.
We’re actually delivering low frequency tracking data in the new data, both for college and the NFL.
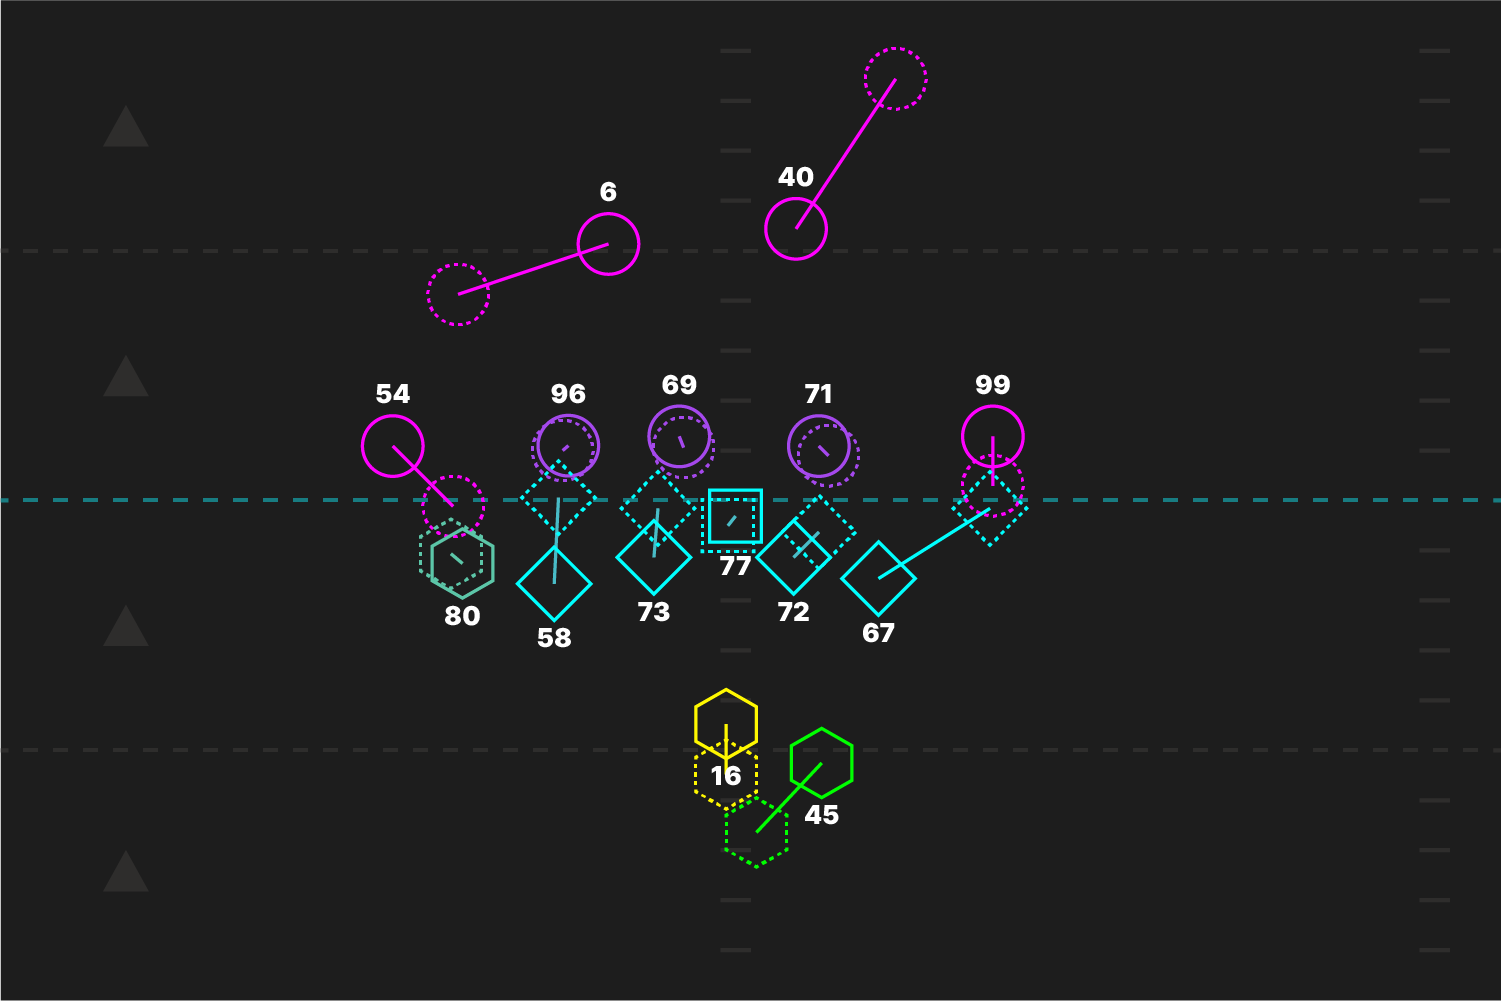
Out of this comes the distance of all players at snap and from each other, for every play on the field. Stacks and bunches are directly in the data. So is the information about press coverage. Or compressed formations. Or almost anything else that you can dream up that actually matters.
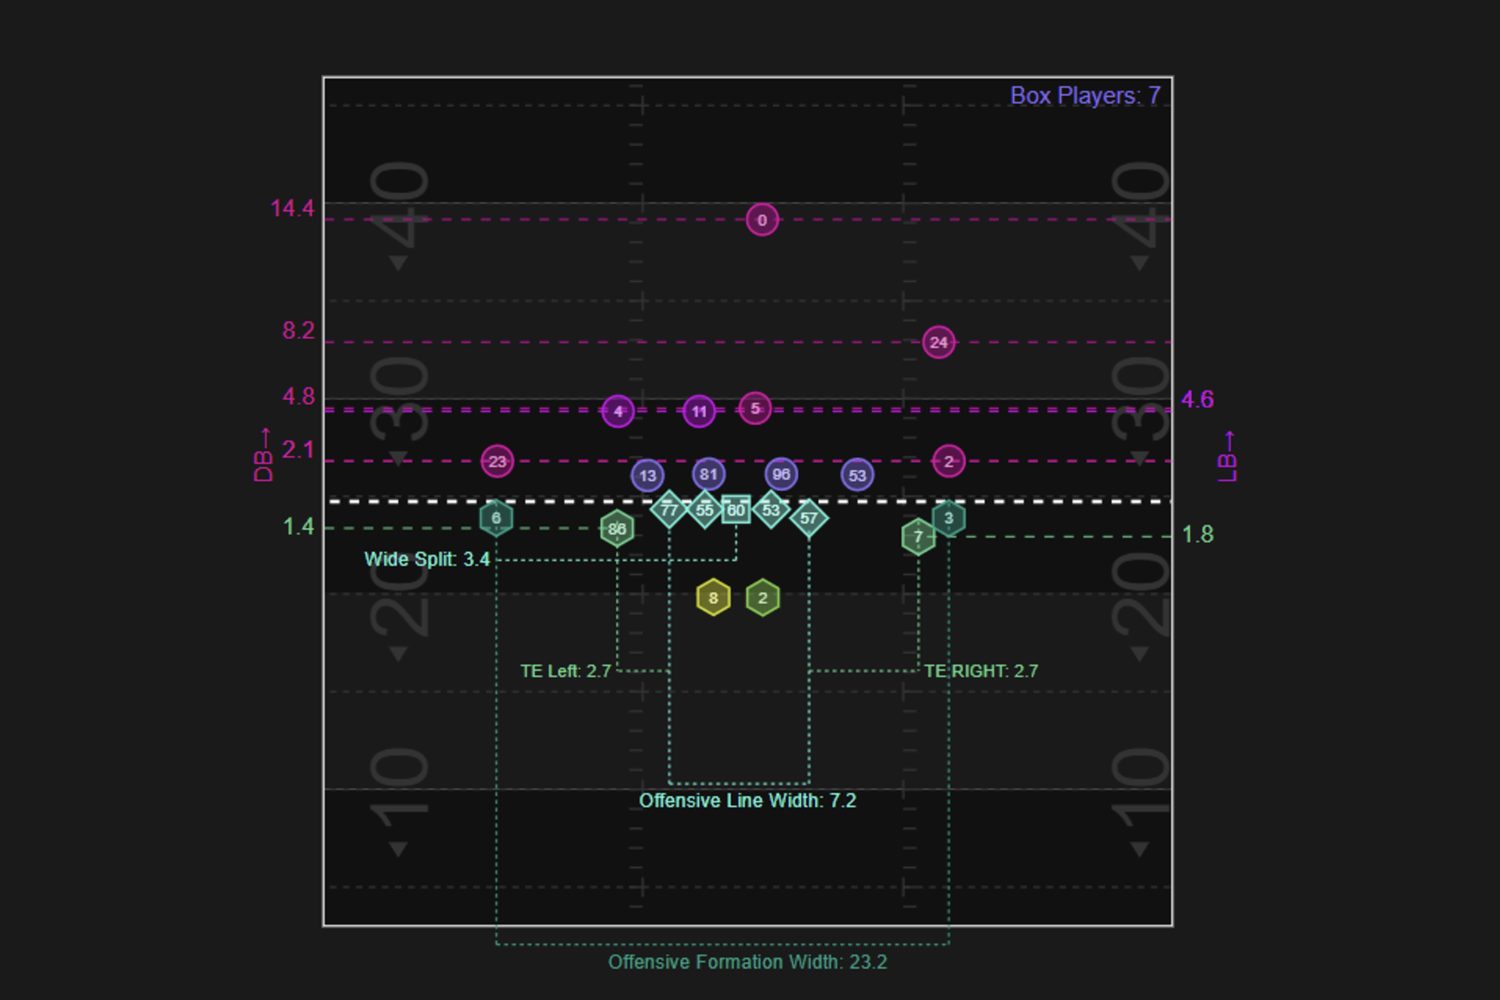
We’ve also got Freeze Frames at key points in the play like at throw and at catch.
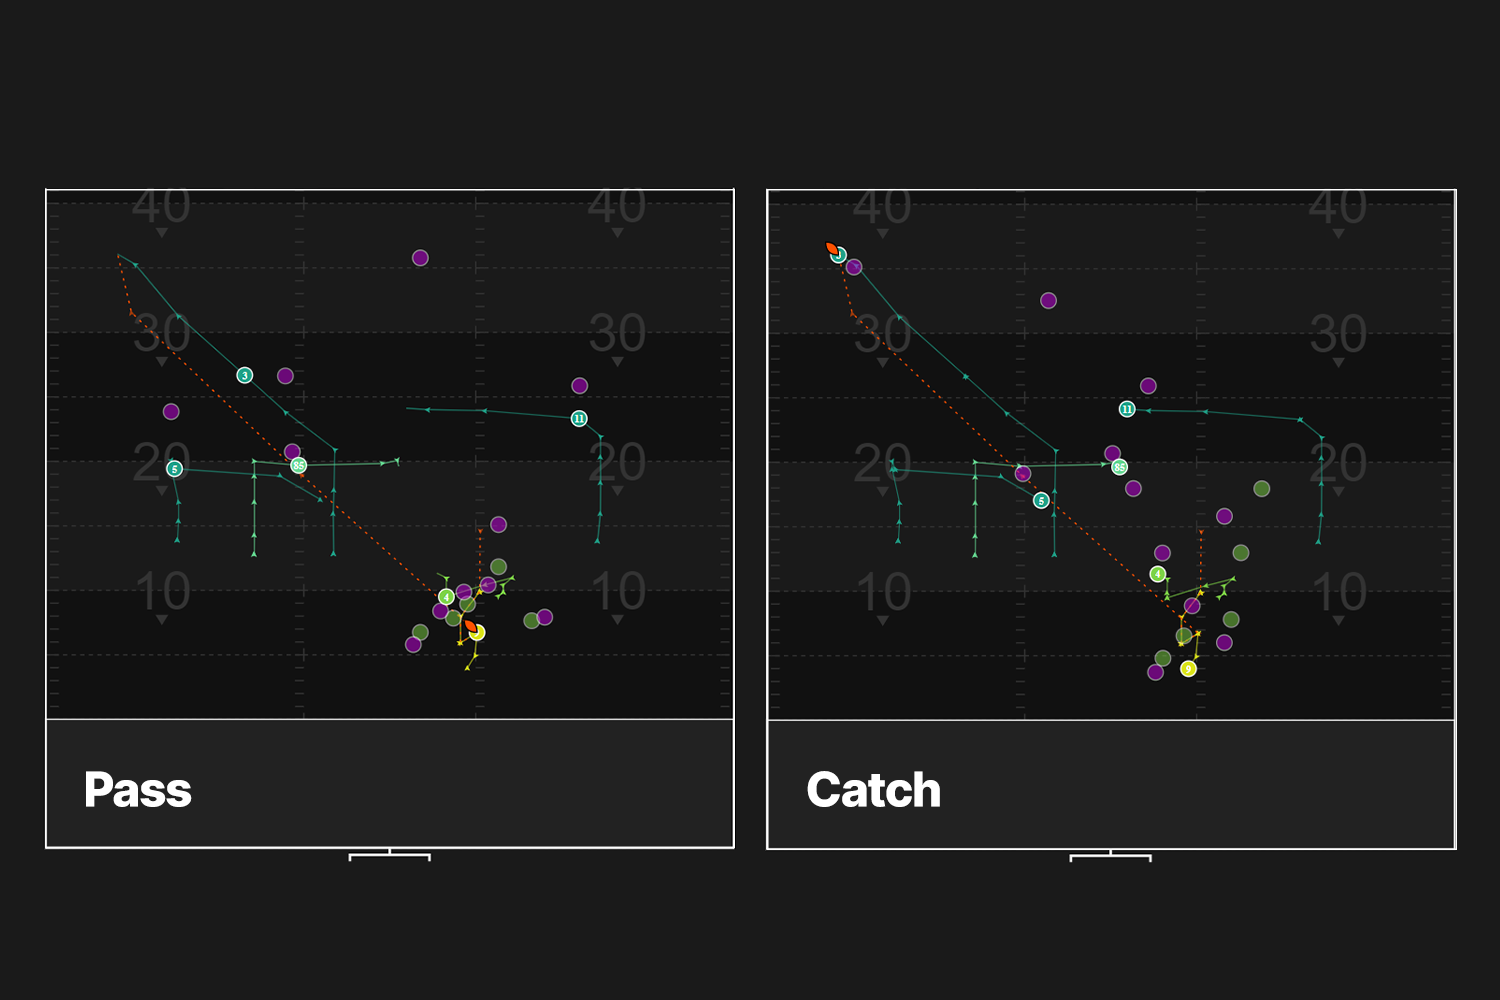
We’ve got synchronized route patterns that not only show what routes players ran, but also the timing of those routes in relation to each other.
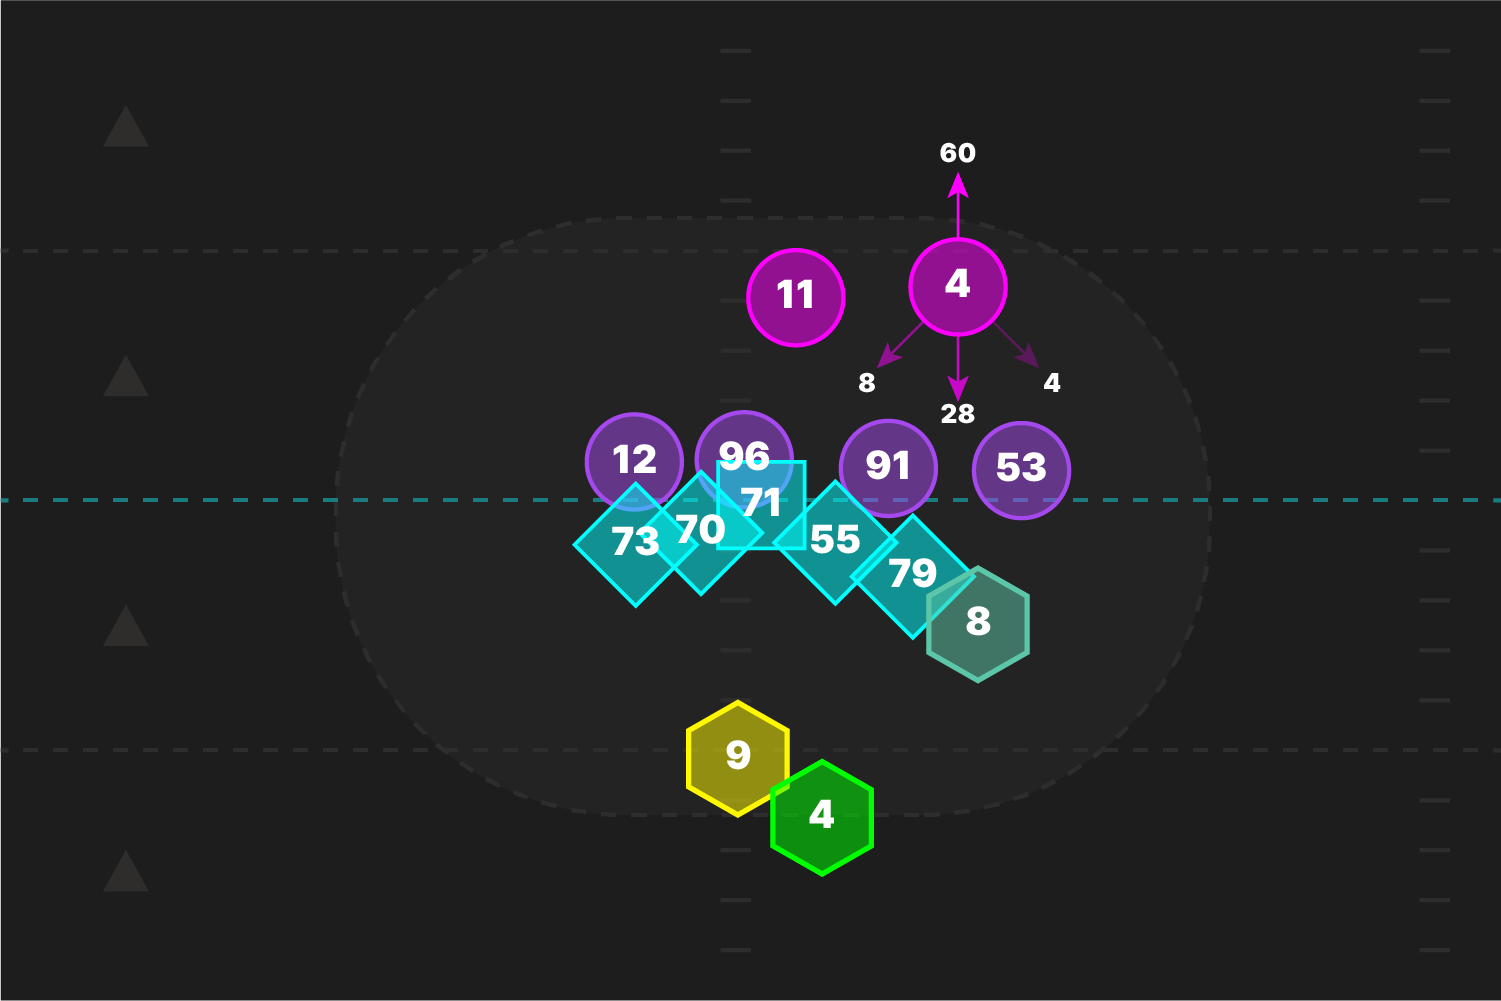
And finally, the element that is most unique to our data is something we call Line Battles. It measures who blocked who, when, where for every play. This will fundamentally change how we analyze what happens on the offensive and defensive lines.
Coaches… we will give you better data for video cutups, but most importantly, we will give you tools to drive insight on top of the data.
Something as simple as blocking engagements is already in the data.
So are combo blocks and double teams. And stunts and twists.
We know who created pressure, when it happened down to a tenth of a second, and what path defenders took to get to the QB.
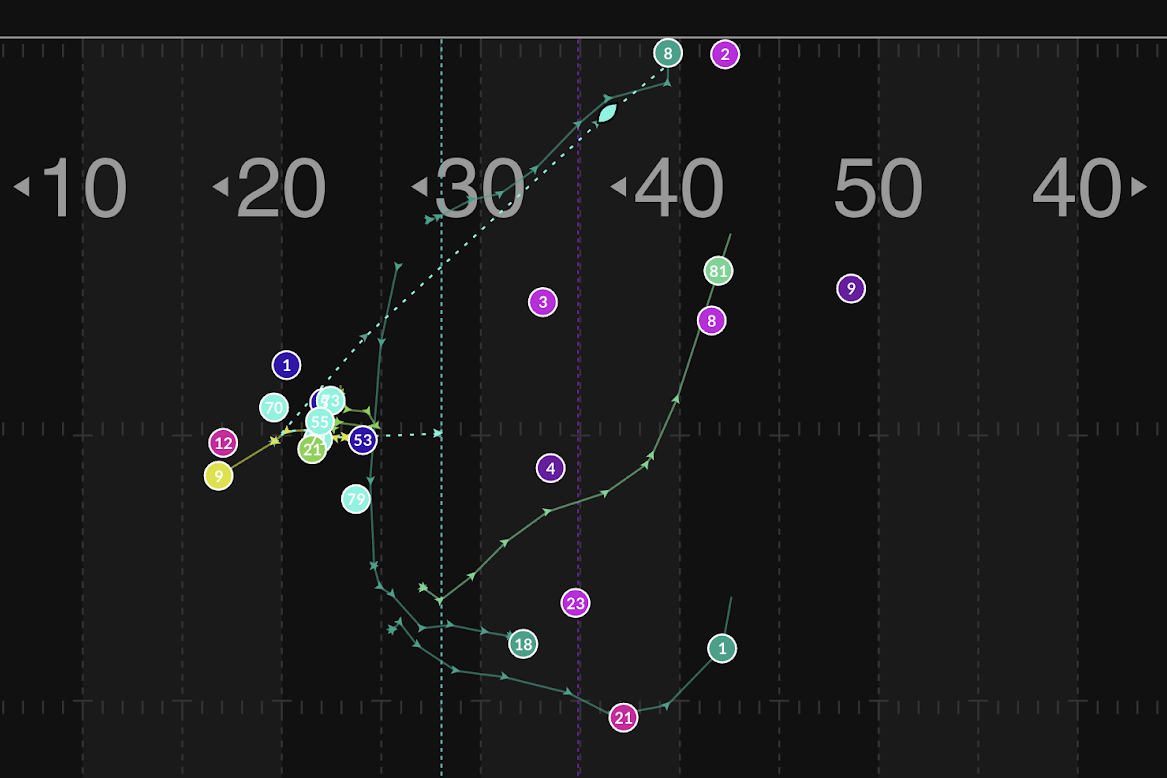
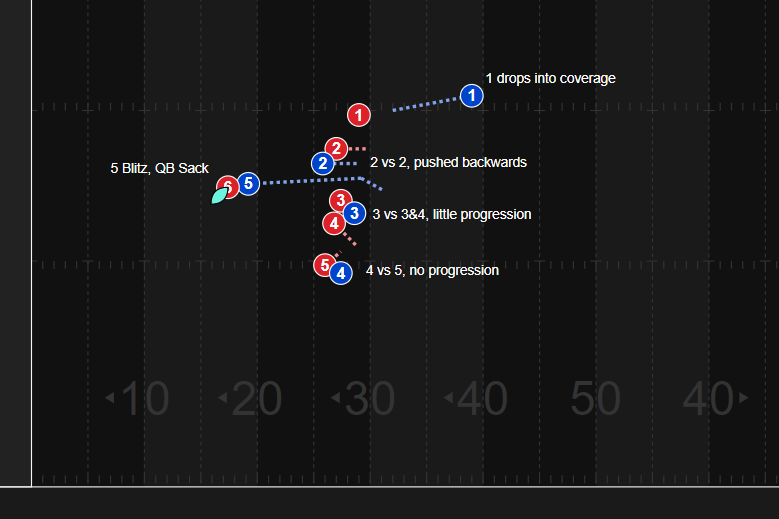
With this info, we’re able to profile the behavior of a single linebacker in a six-man front against 11 personnel (1 tight end, 1 running back).
60 percent of the time, this LB drops into coverage, and the other 40 percent he rushes the QB via the paths above.
What we will provide is unmatched insight for what happens to every player on the field for every snap. Because we have that information, recruiting and player development opens up like never before. Better data makes it so much easier to find the skill sets of players you are looking for in a particular scheme, for every position on the field.
Another (non)example:
Certain schemes need defensive tackles that are space eaters - the kind of players that can own a gap, and eat a double-team in the run game without moving. But finding these players in data used to be impossible. That’s because from a data perspective, what’s described above is a non-event. Show me a double team… where the DT doesn’t move? But with what we’ve created for line battles data, that becomes easy.
Show me defensive tackles that
a) have little backwards movement from the line of scrimmage
b) while being double-teamed.
And then you rank the average backwards movement on run plays per player when facing double-teams, and produce a simple list. You’ll be able to use IQ Scout to find these guys in the transfer portal or to assign to the scouts when draft season rolls around. And you’ll be able to pull up the video for all of the plays where the DT was double-teamed to see for yourselves. Scouting and recruitment will see incredible productivity gains.
The details above just scratch the surface for what StatsBomb Data and IQ will deliver for American Football. Over the next month, we’ll delve much deeper into all of these elements, and show exactly how we’re going to change the game for the NFL, college football, and eventually high school.
Oh, and for you college football coaches, we will give you your data for this season and last, loaded into StatsBomb IQ… FOR FREE. Just send us your all-22. It’s that easy.
Stay tuned.
Ted Knutson
CEO, StatsBomb
ted@statsbomb.com
@mixedknuts on Twitter
