Throughout this season, our StatsBomb IQ Live product has been in the hands of some of our football and media customers, delivering StatsBomb data insights live and in real-time. Now we want to bring those insights to you.
IQ Live is our matchday analytics platform that packages live StatsBomb data into digestible and insightful visualisations and tables. We’ve been working closely with a handful of customers on an ongoing basis to continue developing the product and, thanks to this period of feedback and development, the platform has moved rapidly from Beta, through version 1.0 and now into a product that excites us as much as it does our customers. Many have already incorporated it into their matchday analysis workflows, as well as the raw data that is also available through the Live API for those who need to pipe it directly into their systems.
Even before we’d collected our first match of live data, part of the decision to go down the route of developing a live product was to be able to bring live StatsBomb insights to you, the football analytics community. That starts today. Well, next Tuesday to be precise. Let’s talk about StatsBomb Matchdays.
StatsBomb Matchdays will be a regular feature on our Twitter feed for all the biggest and most significant matches going forwards. We’ll be providing data-driven insights and commentary as the game unfolds, sandwiched by pre-match scene-setting by our analytics and visualisations and post-match analysis evaluating all the key insights from the 90 minutes just played out.
We know there’s long been a desire to have detailed and intelligent analysis delivered during the game on matchday. So join us next Tuesday, April 12th, for the Champions League second leg of Chelsea vs Real Madrid and the launch of StatsBomb Matchdays.
So what do you have to look forward to?
First things first, let’s talk StatsBomb xG.
StatsBomb xG has held up as the industry-best ever since its inception in 2018. Collecting data on our brand new data spec that includes features such as defender and goalkeeper positioning on shots, pressure information, and Shot Impact Height immediately elevated our data and xG model above the competition.
Delivering this level of accuracy and depth requires several highly-skilled and meticulous data collectors — and that’s just for ONE match. Scaling this up for live data collection with several matches happening simultaneously was always going to be difficult.
But, hey. We’ve never taken the easy route.
Don’t believe it’s possible to collect the same detailed data on shots live in real-time?
Look at this.
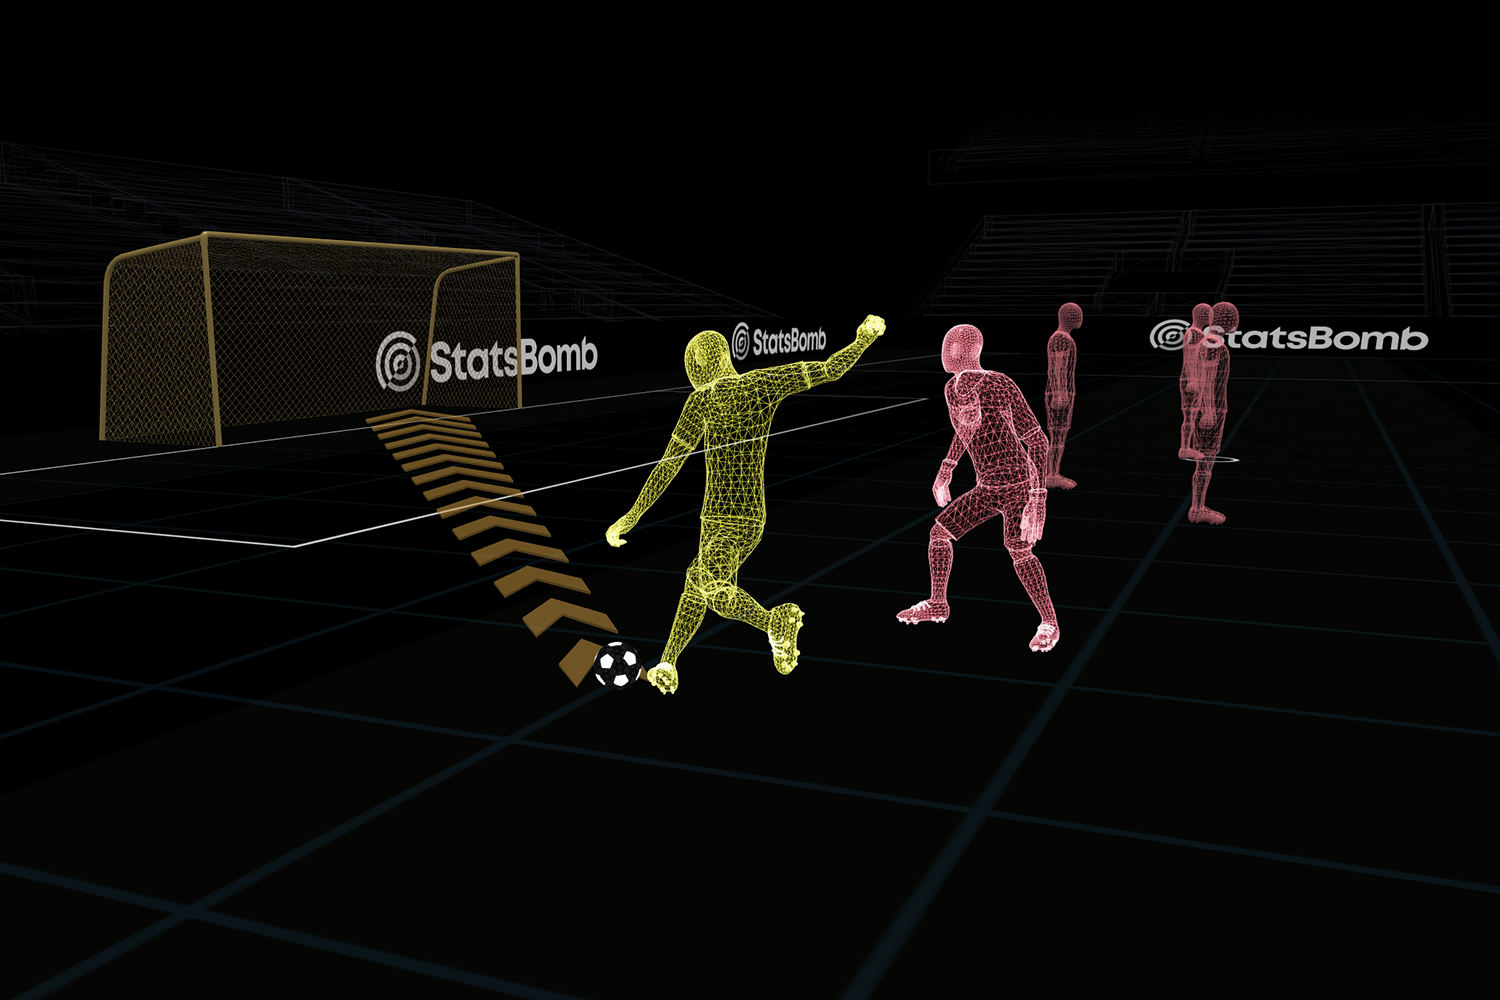
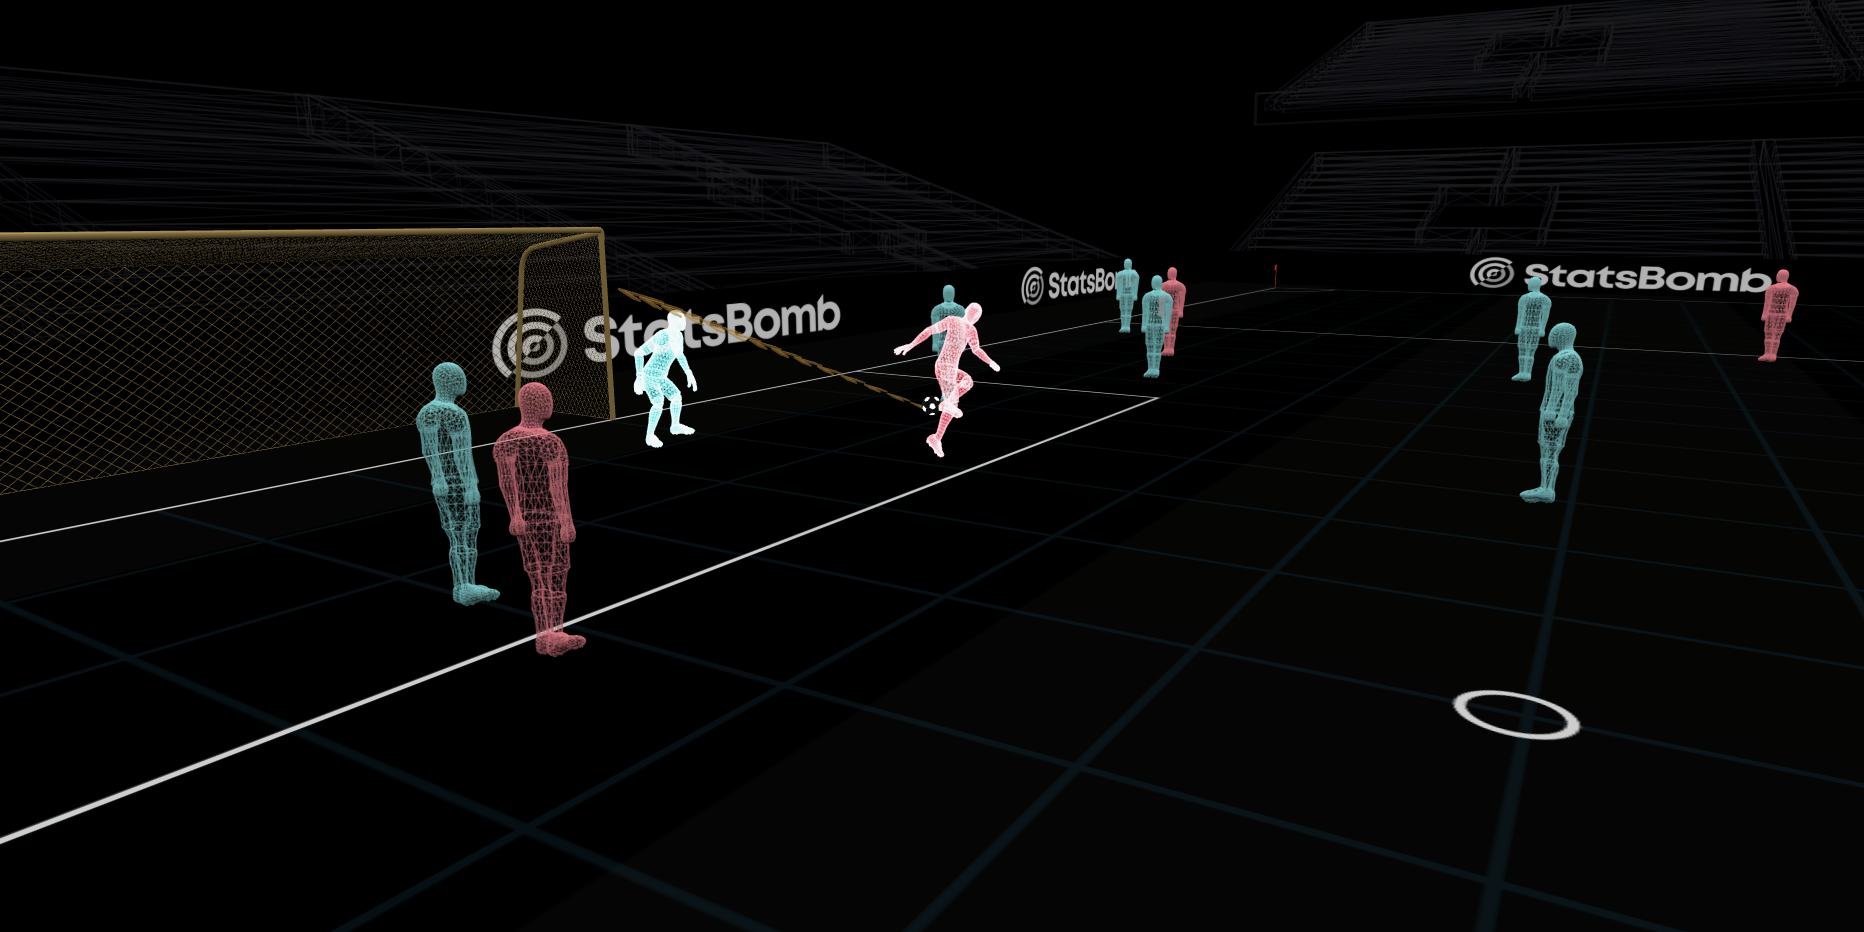
Nope, we haven’t built a portal into an alternate 3D reality. That comes next year. These are StatsBomb 3D Freeze Frames, and they’re the perfect illustration of the level of detail you’re getting in StatsBomb Live data - a level of detail that doesn’t exist anywhere else.
Customers can trust that they’re getting accurate, contextual information that will drive improvement in their performance because they can literally see the data with their own eyes. Our 3D Freeze Frames ensure every shot is represented as it occurred in reality.
Including overhead kicks.
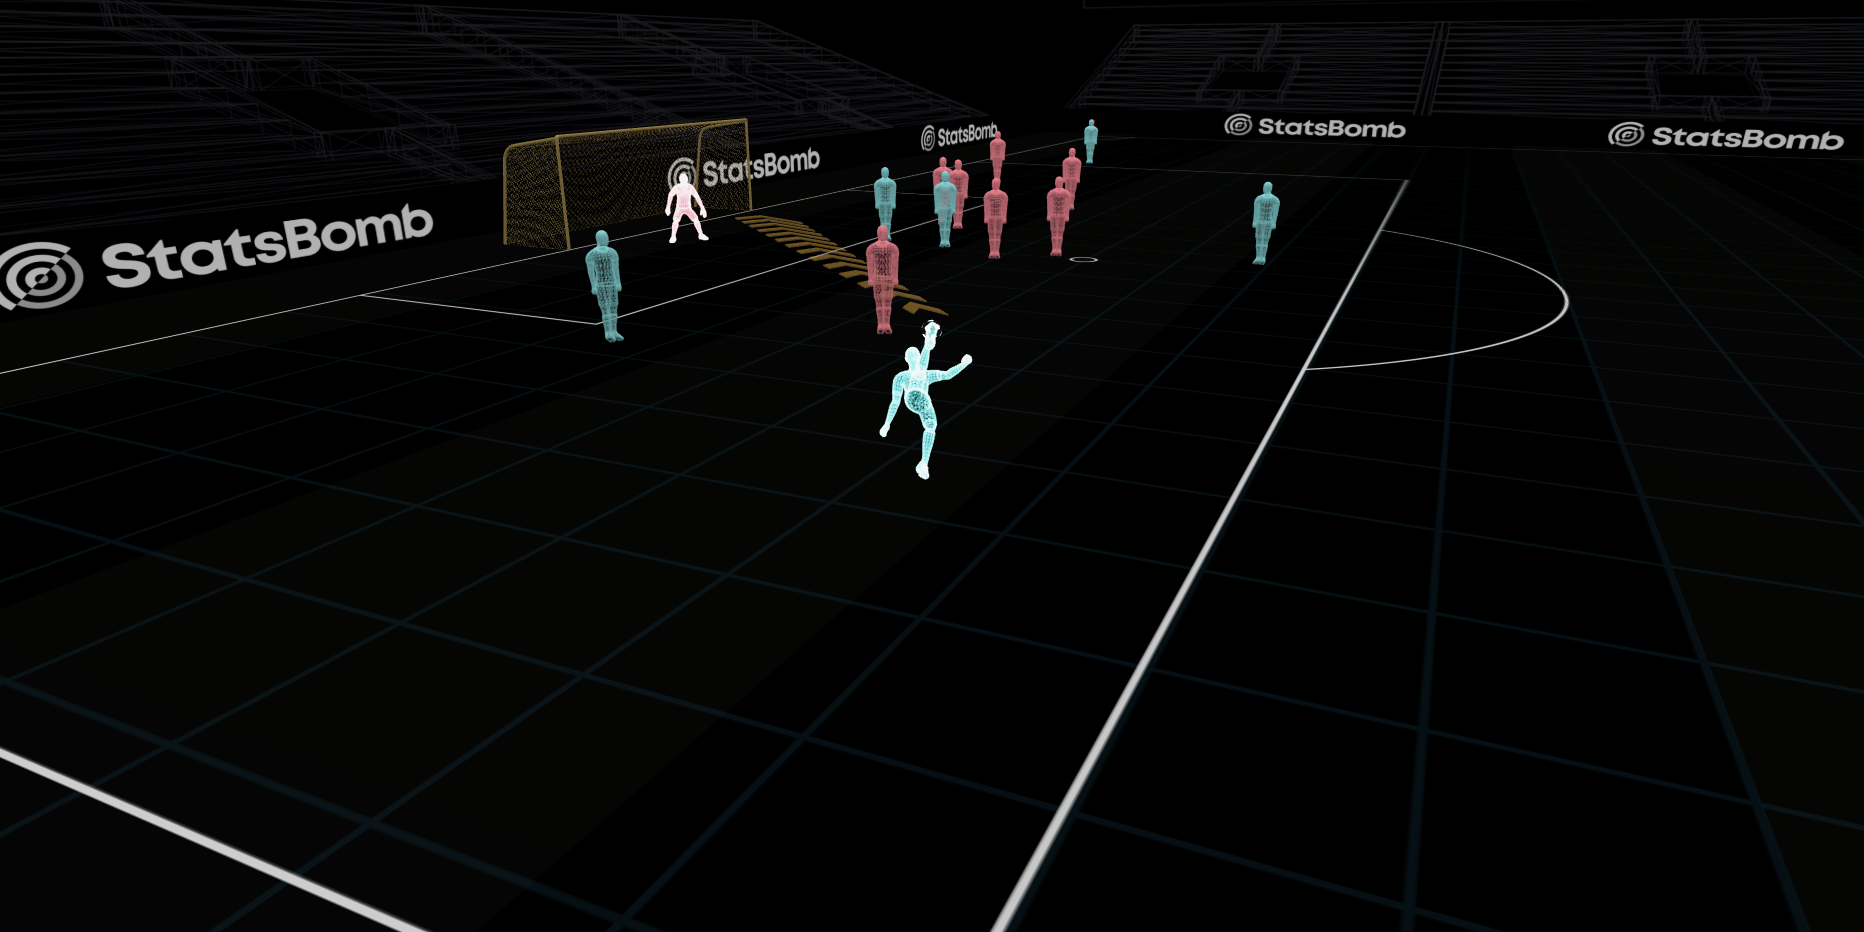
And backheels.
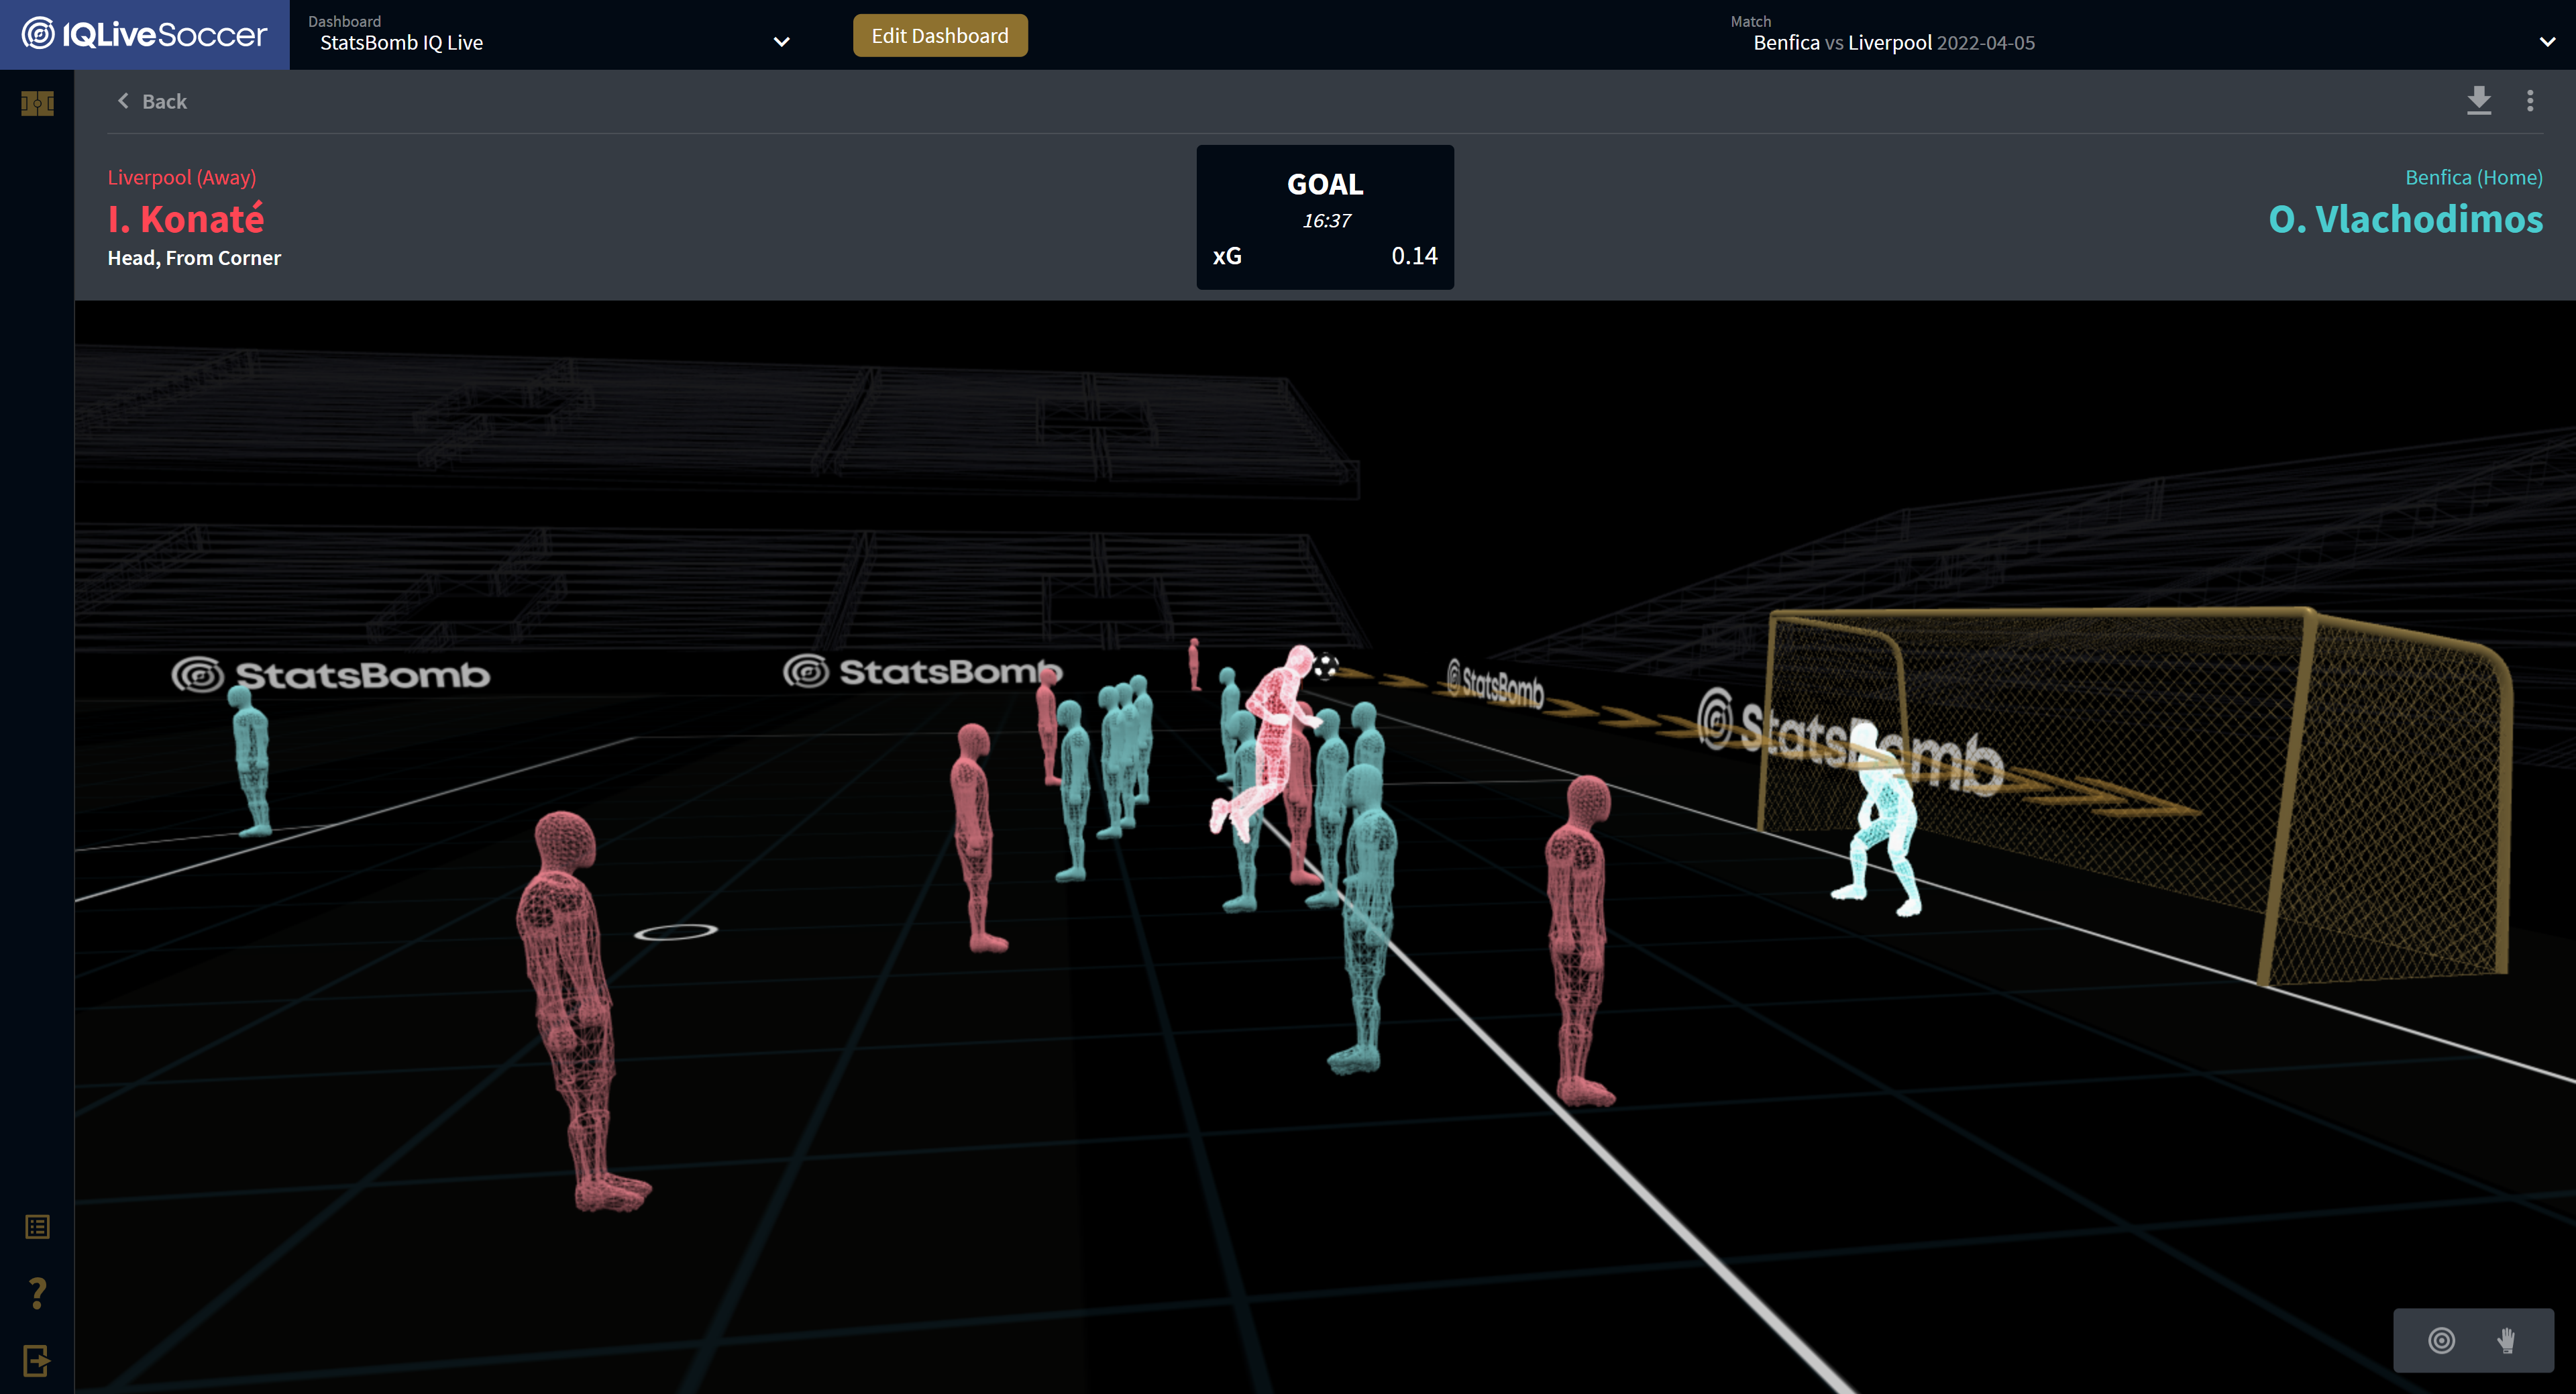
One of the cooler outcomes of developing the 3D Freeze Frames was an unexpected one: the ability to examine the goalkeeper’s view on every shot.
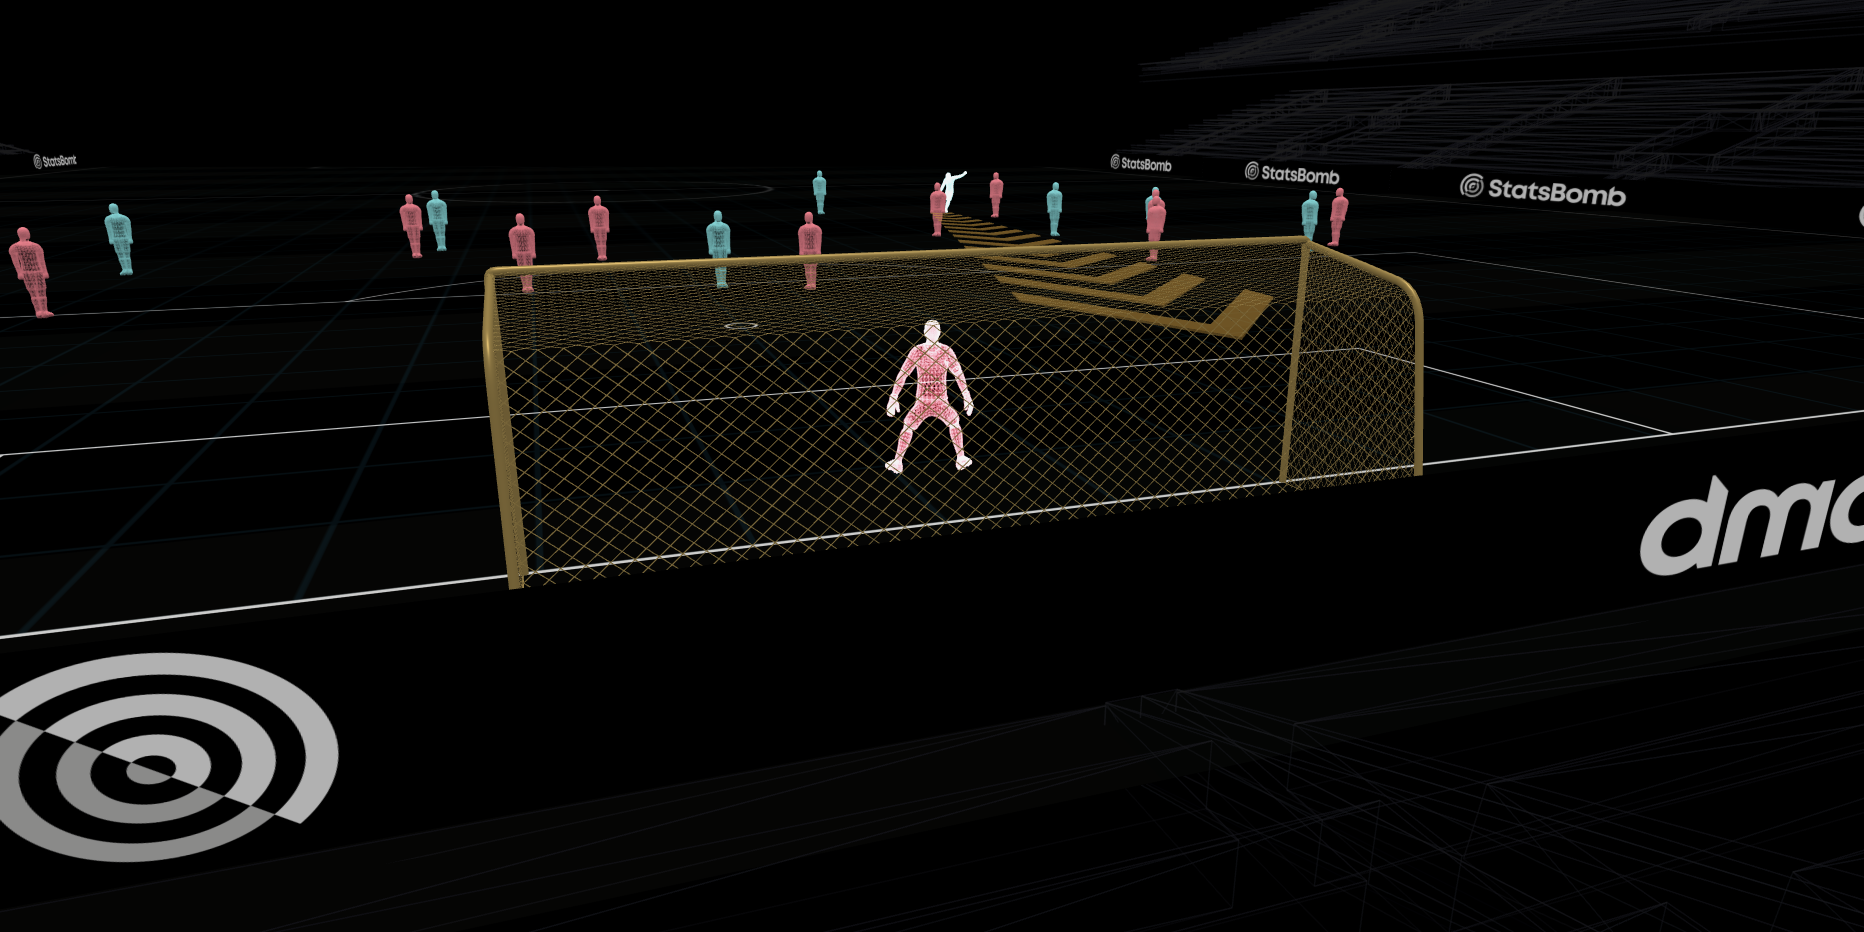

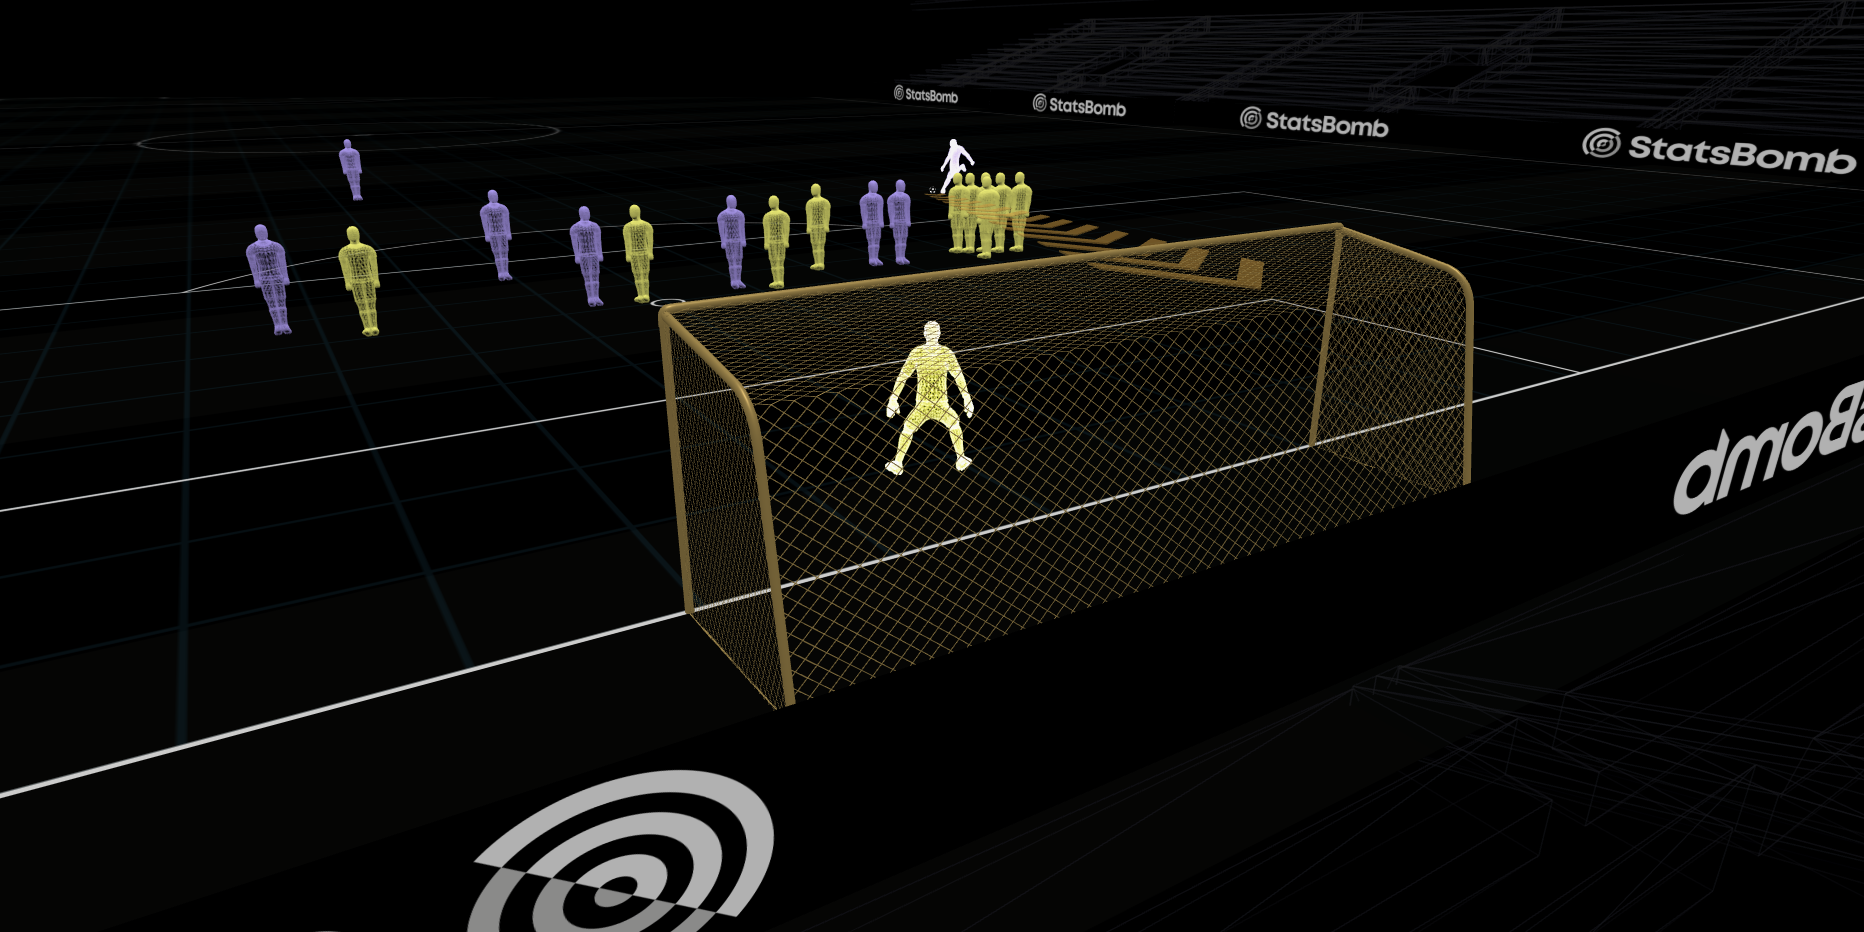
These insights are available within seconds of the actual event occurring.
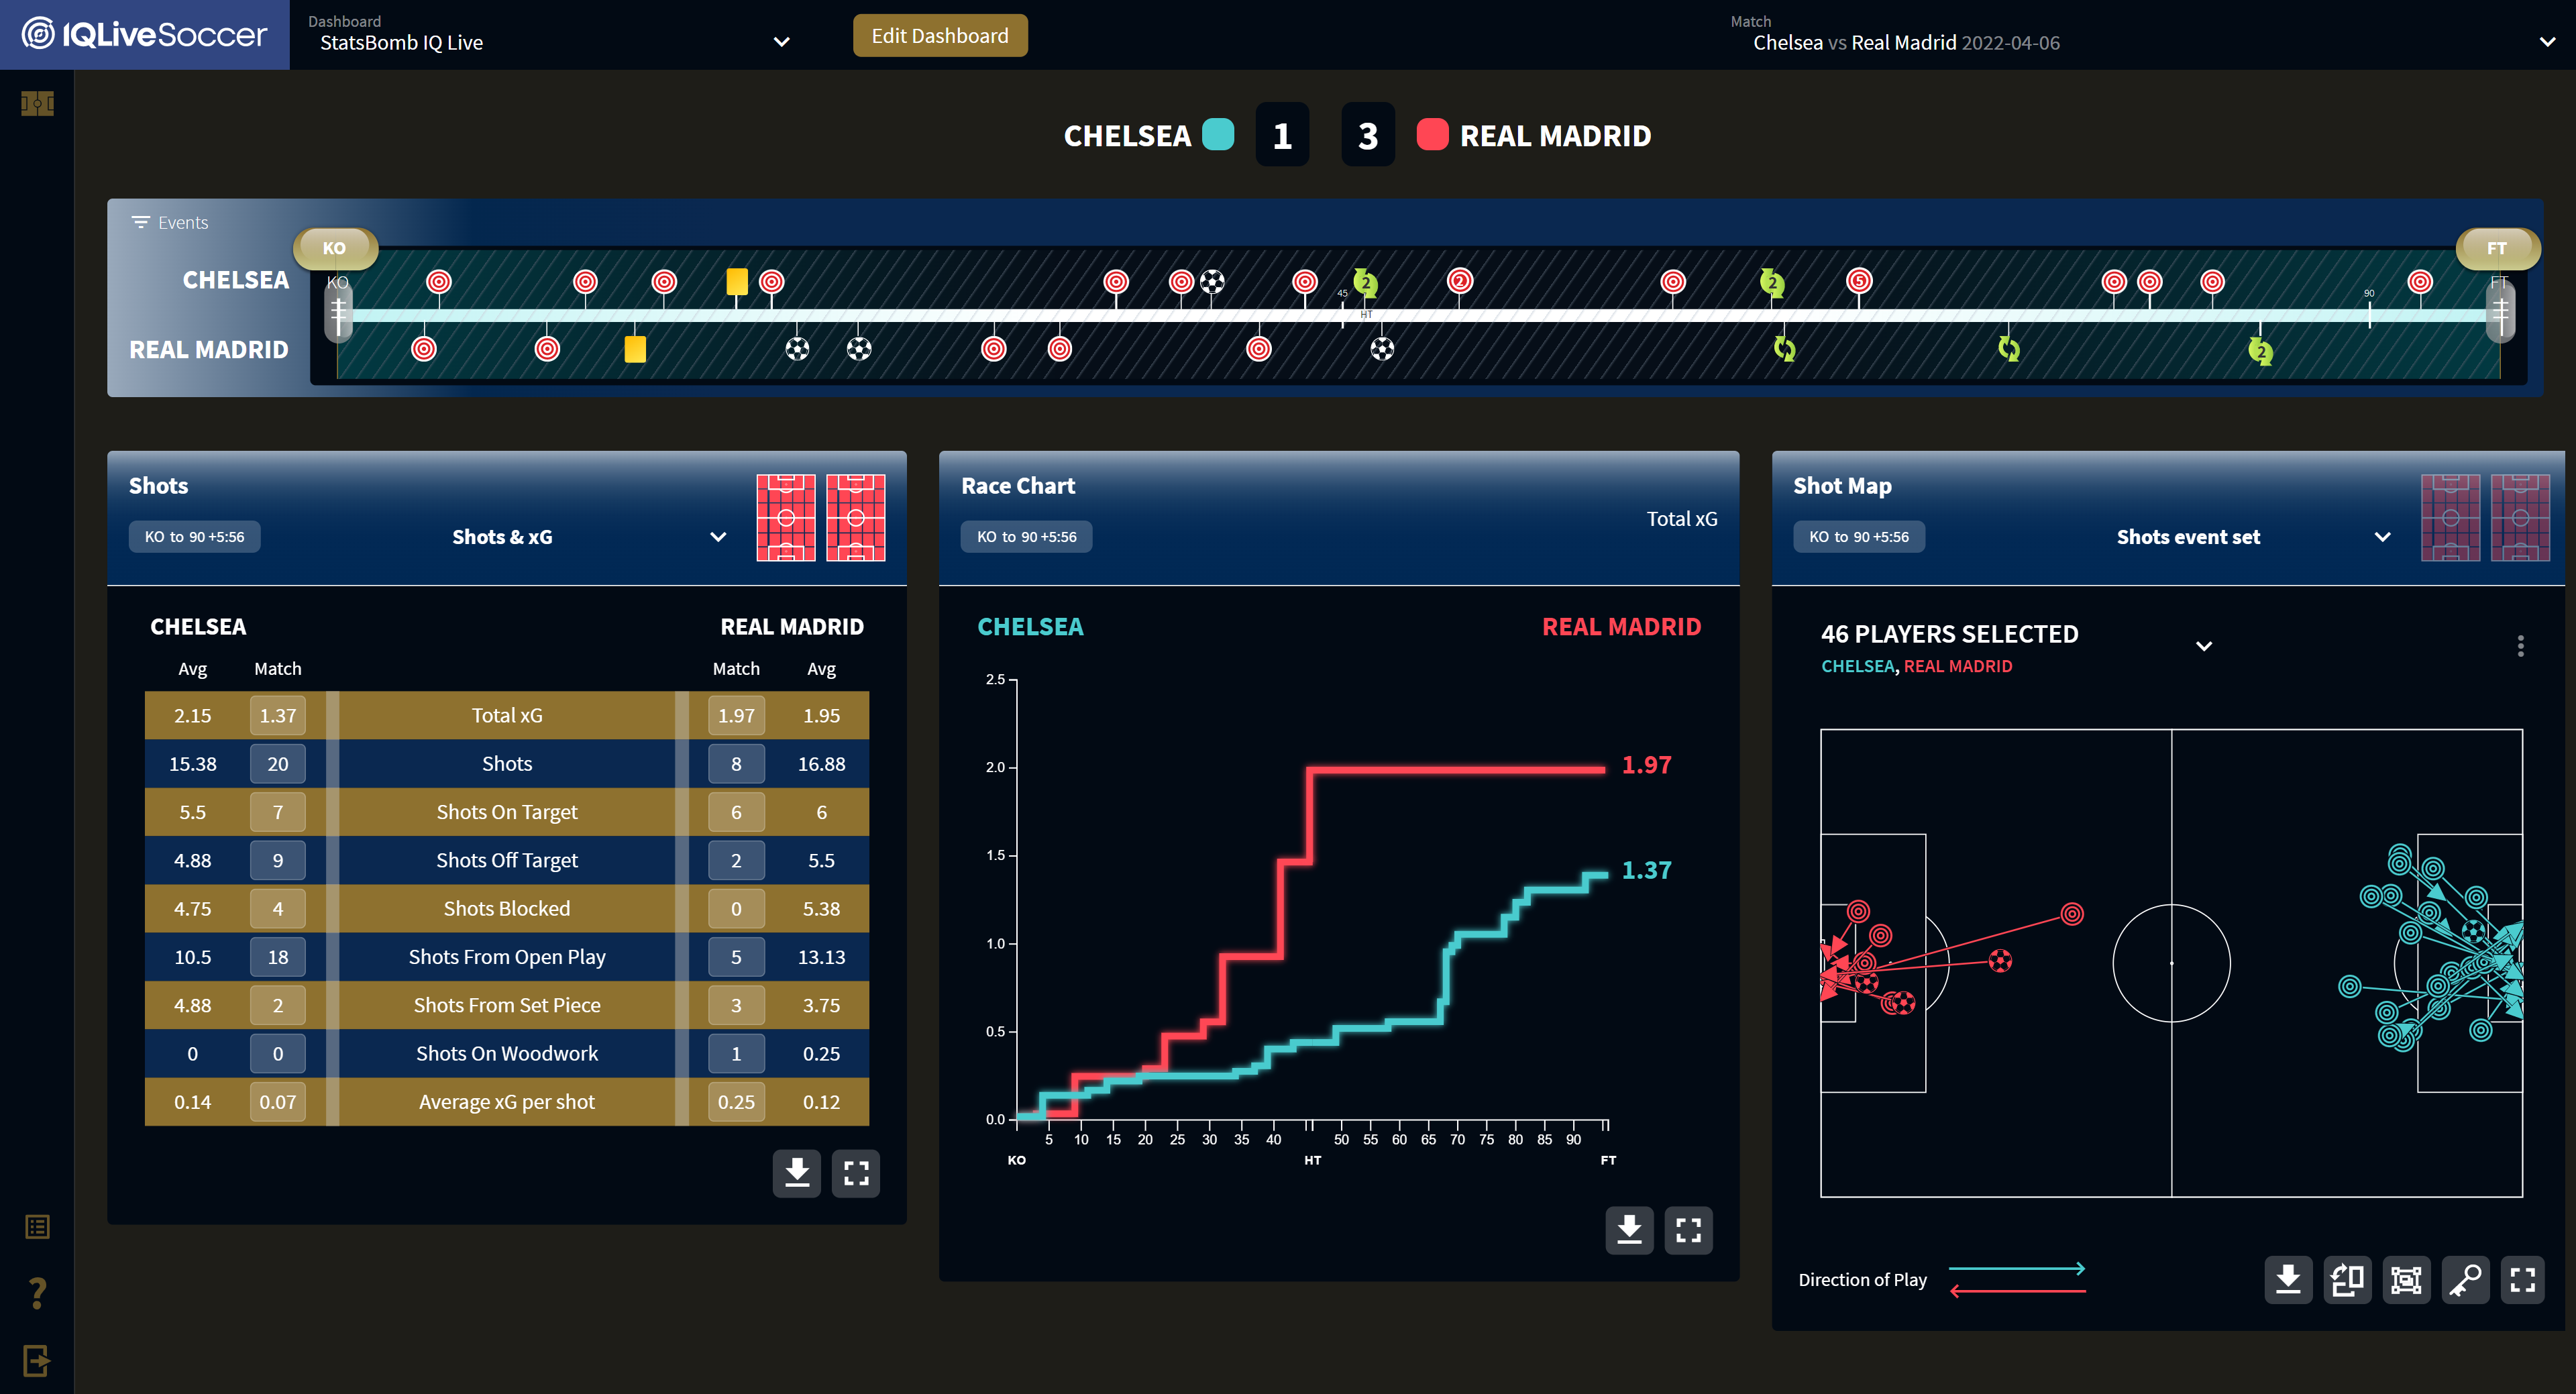
There are plenty more game-changing features within IQ Live. We designed the platform to provide data-driven insights instantly in a compelling and eye-catching way.
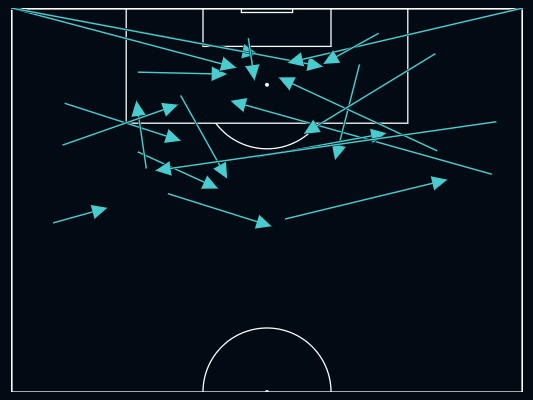
Whether it be the Event Location Maps: customisable so that users can filter by event type, pitch location, team and player to display the data and events they wish to see, before exporting the image for their audience.
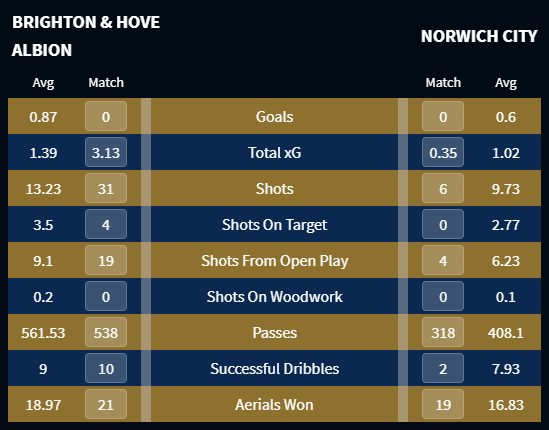
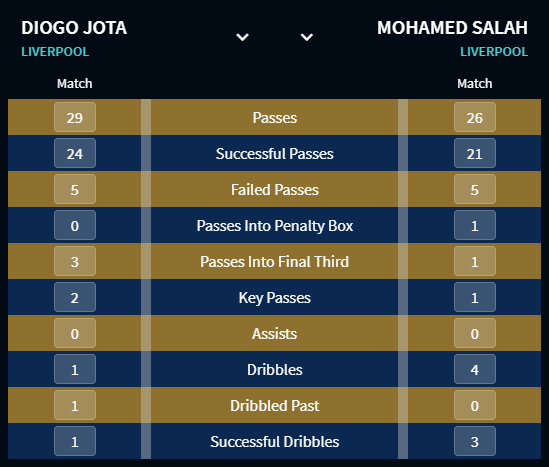
Or the Data Tables: designed so that you can keep up to speed on the cumulative totals of events that matter to you in-game. Create your own tables or use StatsBomb’s pre-set tables grouped on event types (such as Attacking metrics, Defending, Passing, Possession, Ball Progression, Team/Player, etc.)
Or the Event Timeline: which updates every second and allows you to click on key match events such as shots to get up-to-date contextual information about the event at the click of a button.
Oh. And did we mention the Team Averages that update next to each metric in the Data Tables so you can see how a team is performing compared to their season average in each one? That’s another feature we and our customers are already in love with.
We’ve seen rapid uptake in a product that we designed with our club customers and media partners in mind, consulting many of them at every step of the creation process. The platform has already received several updates and upgrades, occurring almost monthly. These will continue to happen as the platform develops even further, with customers receiving regular updates and feedback sessions on the platform’s progression.
We’re as excited as you are to start enjoying insights from StatsBomb Data in a real-time live environment for the first time, so don’t forget to join us next Tuesday for the first sightings of the product and visualisations on our Twitter feed.
Thanks
The StatsBomb Team
