
Attack-minded teams tend to commit more bodies forward when attacking, and defensive-minded teams tend to instruct more players to track back when defending.
This bears out in the data. We know teams will generally be more attacking when behind and more defensive when ahead, so, looking at game state data, here’s how many bodies teams in the Big 5 European leagues have committed to the attack and defence on average this season:
- Winning:
o 2.3 Attackers In The Box
o 4.8 Defenders In The Box - Drawing:
o 2.5 Attackers In The Box
o 5.3 Defenders In The Box - Losing:
o 2.7 Attackers In The Box
o 5.7 Defenders In The Box
The data above is on open play shots in the penalty box, and does not include the shot-taker or goalkeeper.
As expected, when losing, teams attack with more players and defend with fewer, and when winning, they attack with fewer players and defend with more.
Quantifying our collective intuition is all well and good, but there’s tons more to dig into here on a team level. Which teams tend to attack with more players? Which teams don’t?
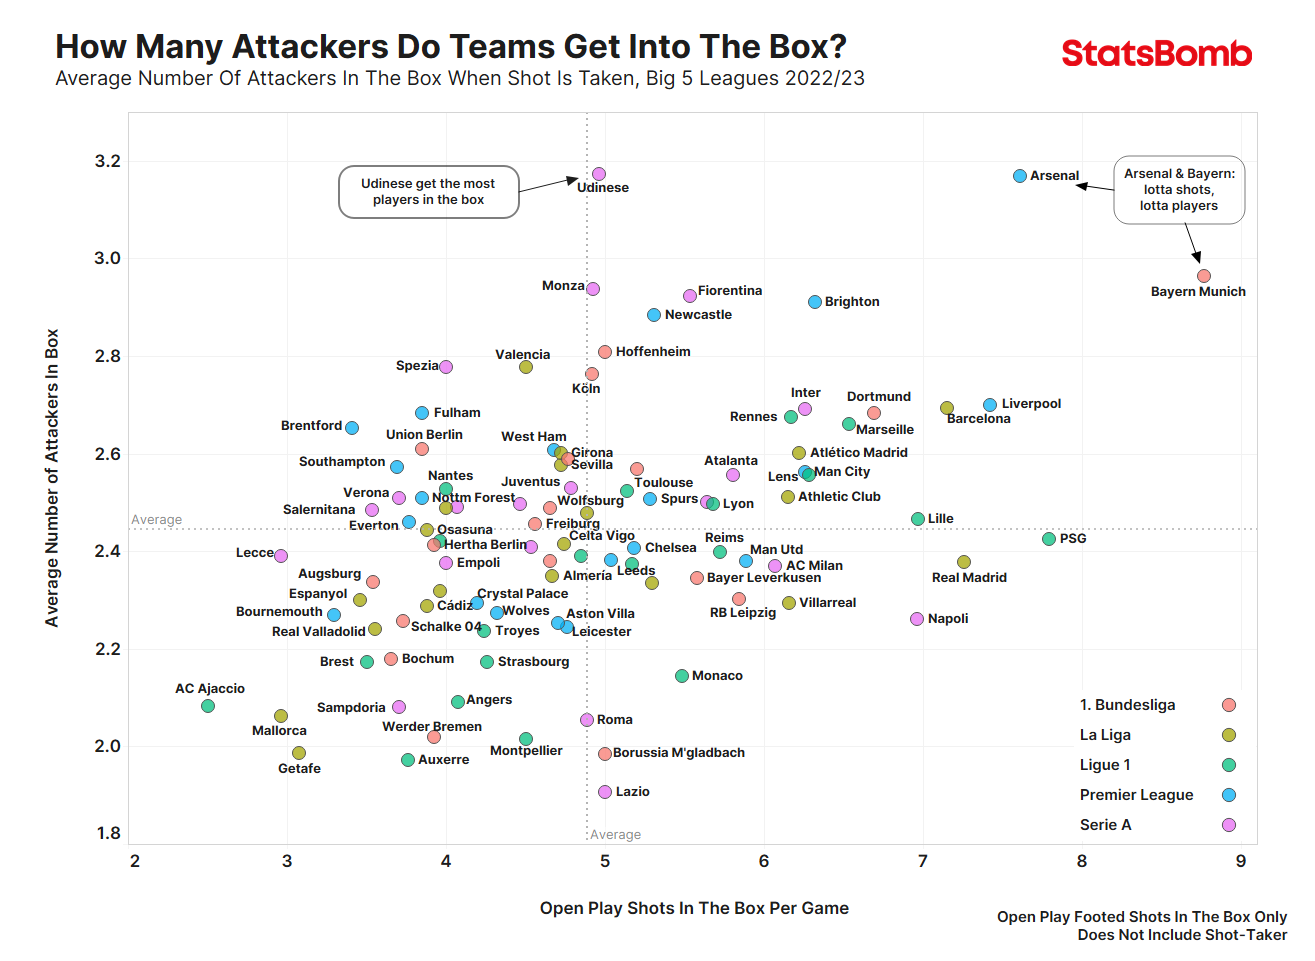
There are several narratives we can unpack here.
First, who predicted Udinese to attack with more players than any other team in the Big 5? Not many, I’d wager. More predictably, Bayern Munich – who generally play their Bundesliga games in the opposition half – commit lots of bodies to the attack, and create more in-box, footed shots than anyone else. Next to them is Arsenal, whose development under Mikel Arteta has seen them dominate more games and pen their opponents in more often this season. Arsenal’s wingers come in narrow, and the two 8’s are encouraged to support the play in and around the opponent’s penalty box. Both Arsenal and Bayern like to play in close quarters near the goal – they’re the top two for the most passes completed inside the opposition box this season.
The contrast between these teams and the likes of PSG, Real Madrid, and Napoli is intriguing. The latter group generates a similar number of in-box shots but does so with fewer players inside the box, a difference which we can likely attribute to the type of chances these teams like to create. Let’s look at how effectively these teams are creating clear shots.
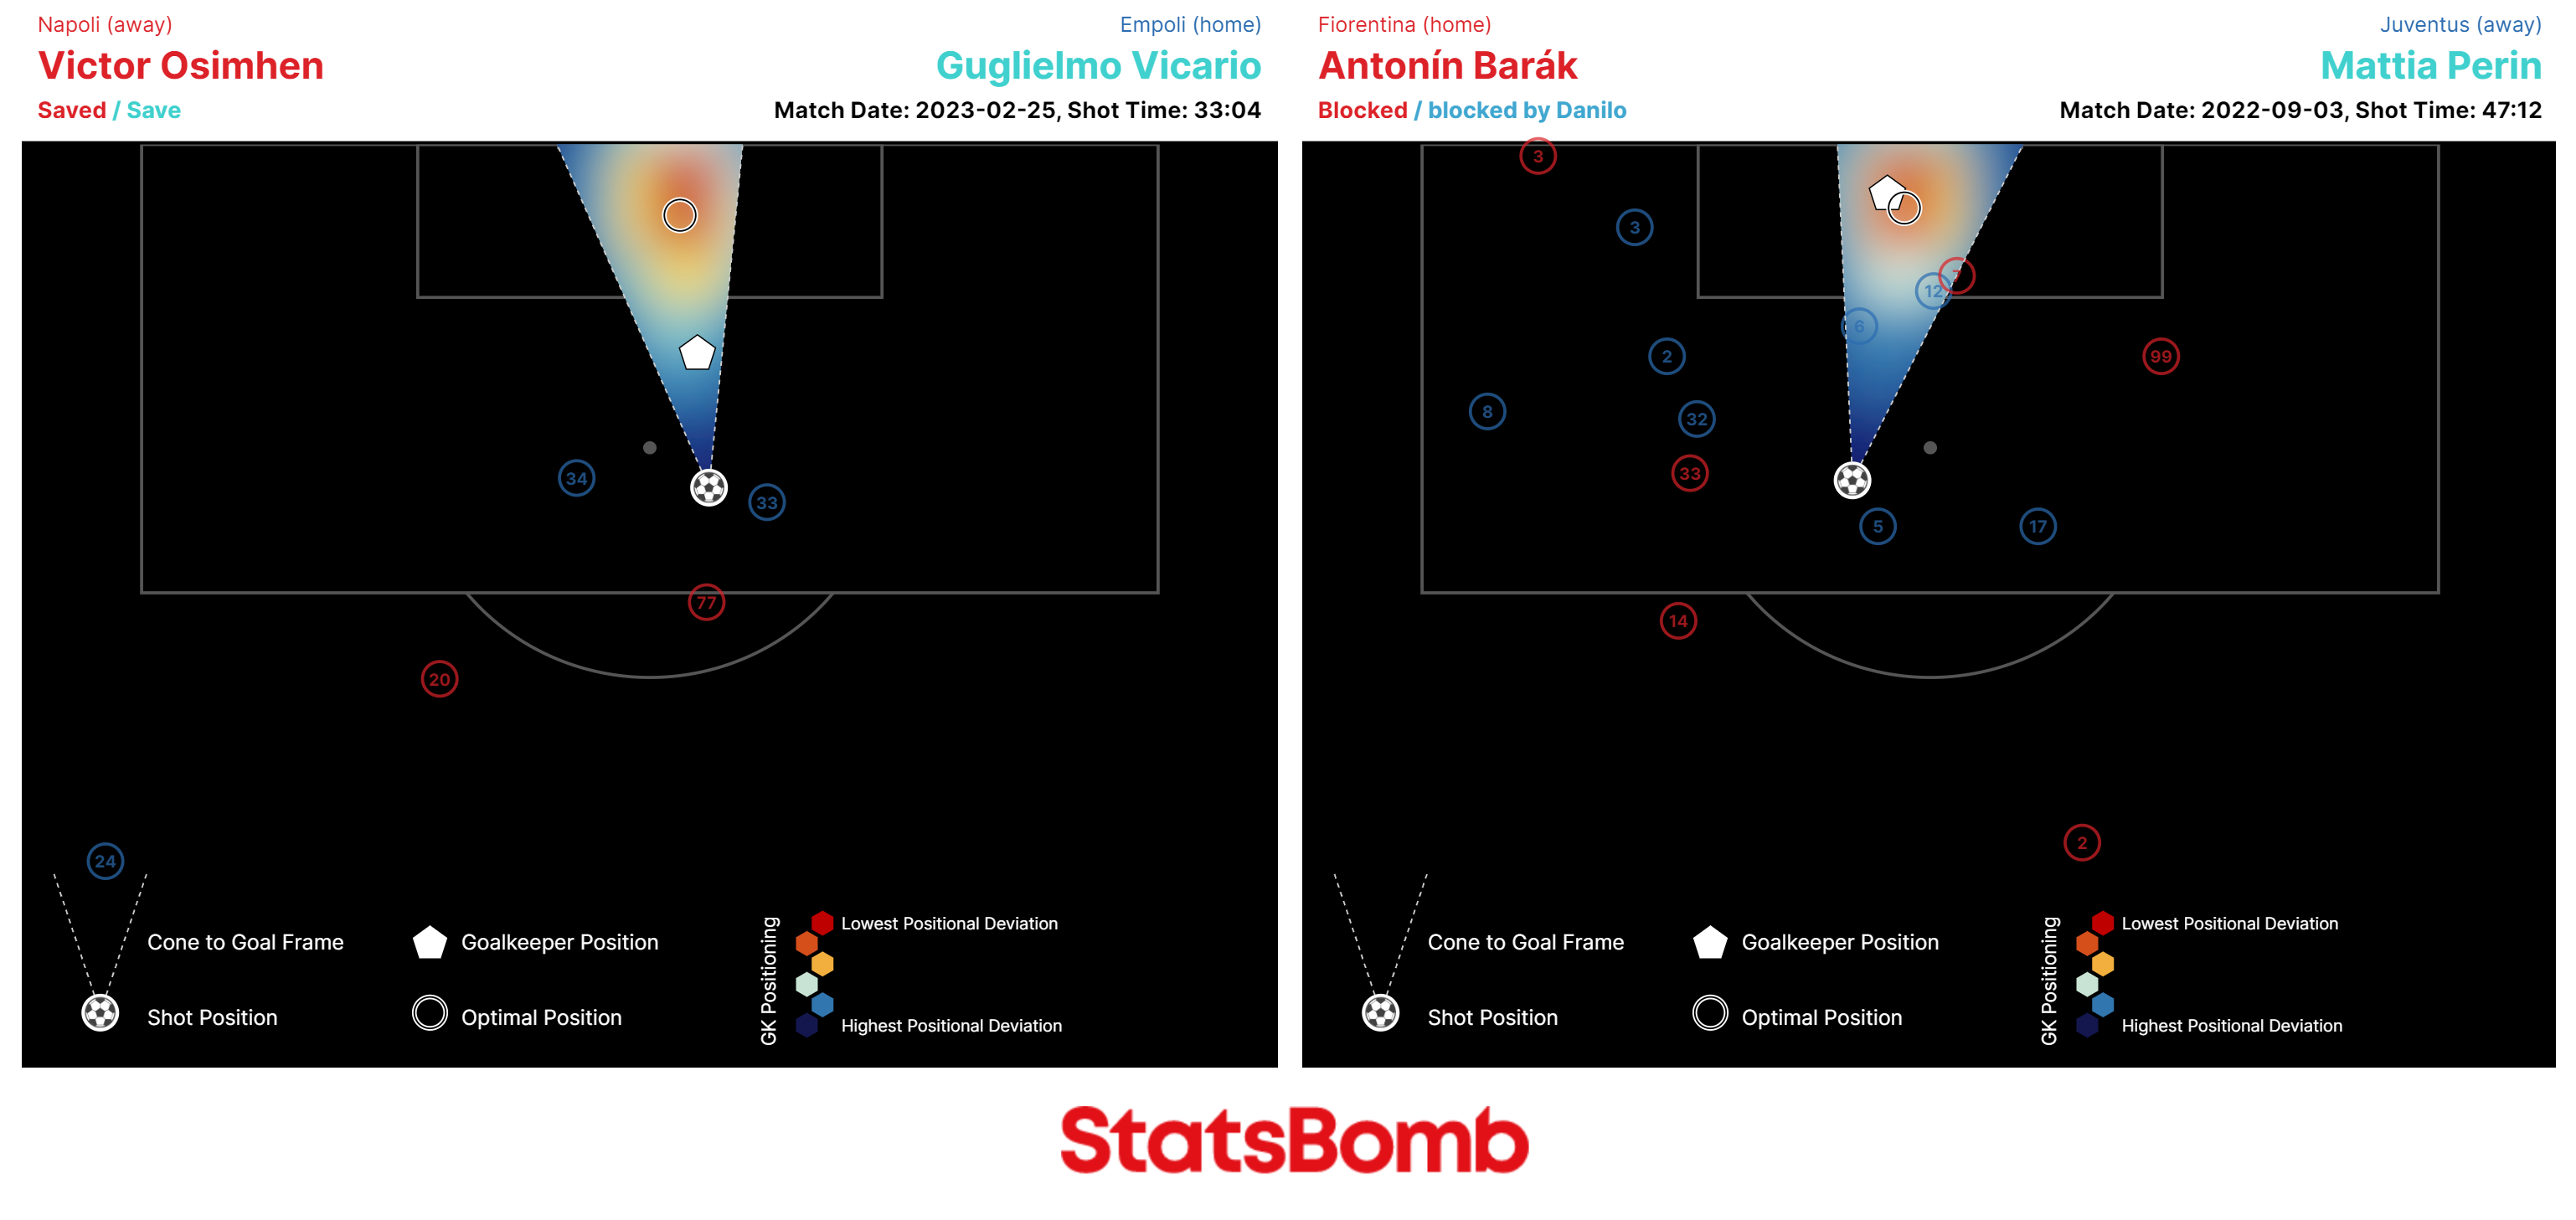
For clarity, we’re counting a defender as “between ball and goal” when they’re in the cone between the shot-taker and the width of the goalposts. Here's a visual example from StatsBomb IQ: Victor Osimhen has just the goalkeeper to beat, Antonín Barák has the goalkeeper AND two defenders blocking his shot's path to goal.
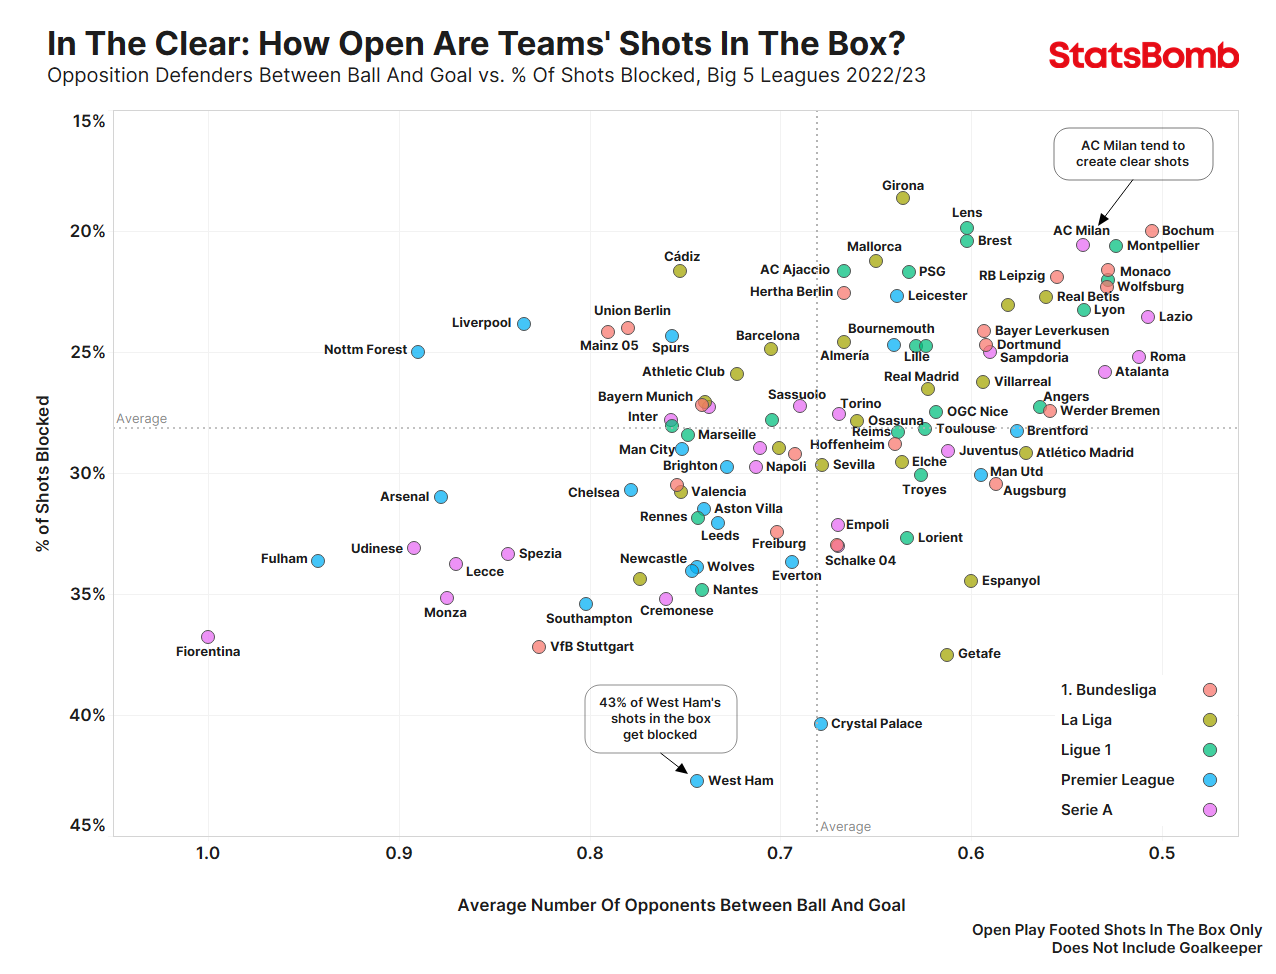
Here’s where things get more interesting.
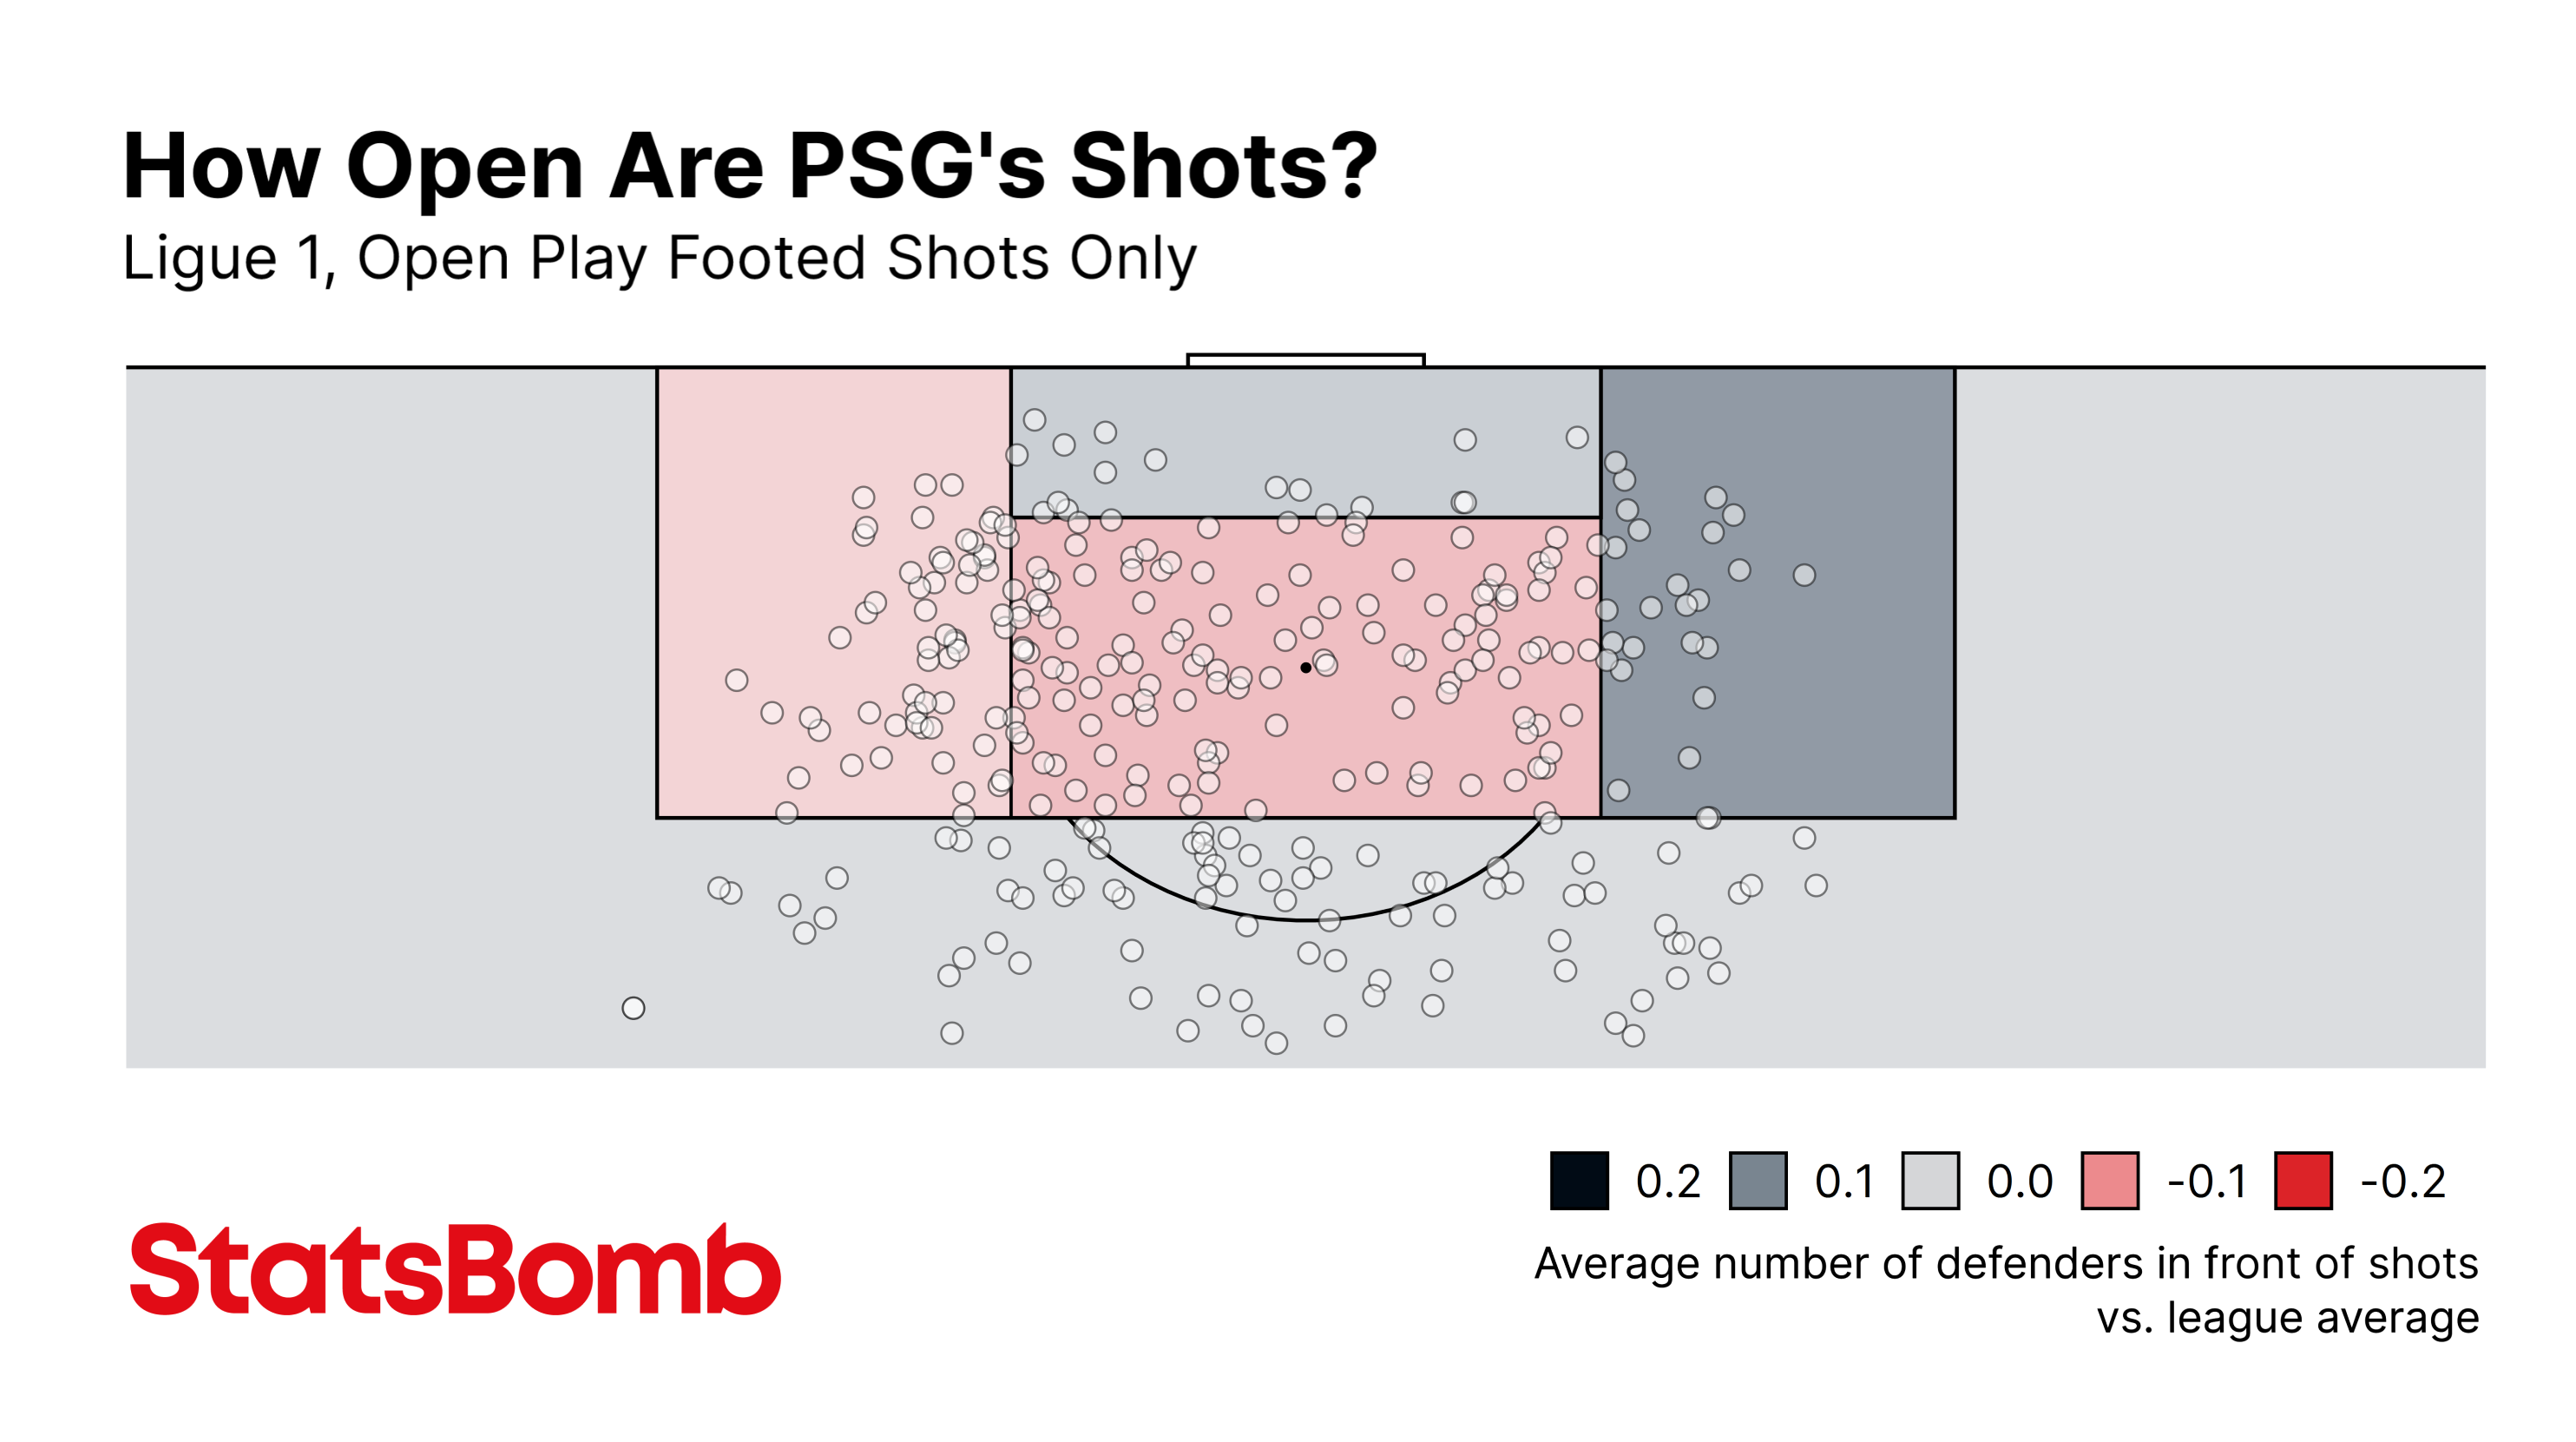
As we saw in the Attackers In The Box graphic, Arsenal and PSG create a near-identical amount of footed shots in the box, about eight per game, but PSG average nearly one attacker fewer in the box. If we close our eyes and visualise what a quintessential PSG goal looks like in their current guise, it’s either a throughball from deep that gets Kylian Mbappé running through 1-on-1, or an intricate possession probing around the box that eventually plays in behind the defensive line. These patterns require the attackers to hold back from committing into the box, leaving the space to be exploited.
Contrast this with Arsenal, who embrace the tighter spaces within the penalty area. Their preference for close-quarter play results in a higher number of their shots being blocked compared to PSG. PSG, despite teams often taking a more defensive mindset against them, have their shots blocked less frequently than the Big 5 average.
How about the other side of the ball? Rafa Benítez once said: “If you cover your head [with a blanket], your feet are cold; if you cover your feet, your head is cold. Sometimes when you attack too much, you are exposed in defence, and to find the balance is the key to have chances to win titles.”
We’ve looked at the teams choosing to keep their head warm, or not, but how about those feet?
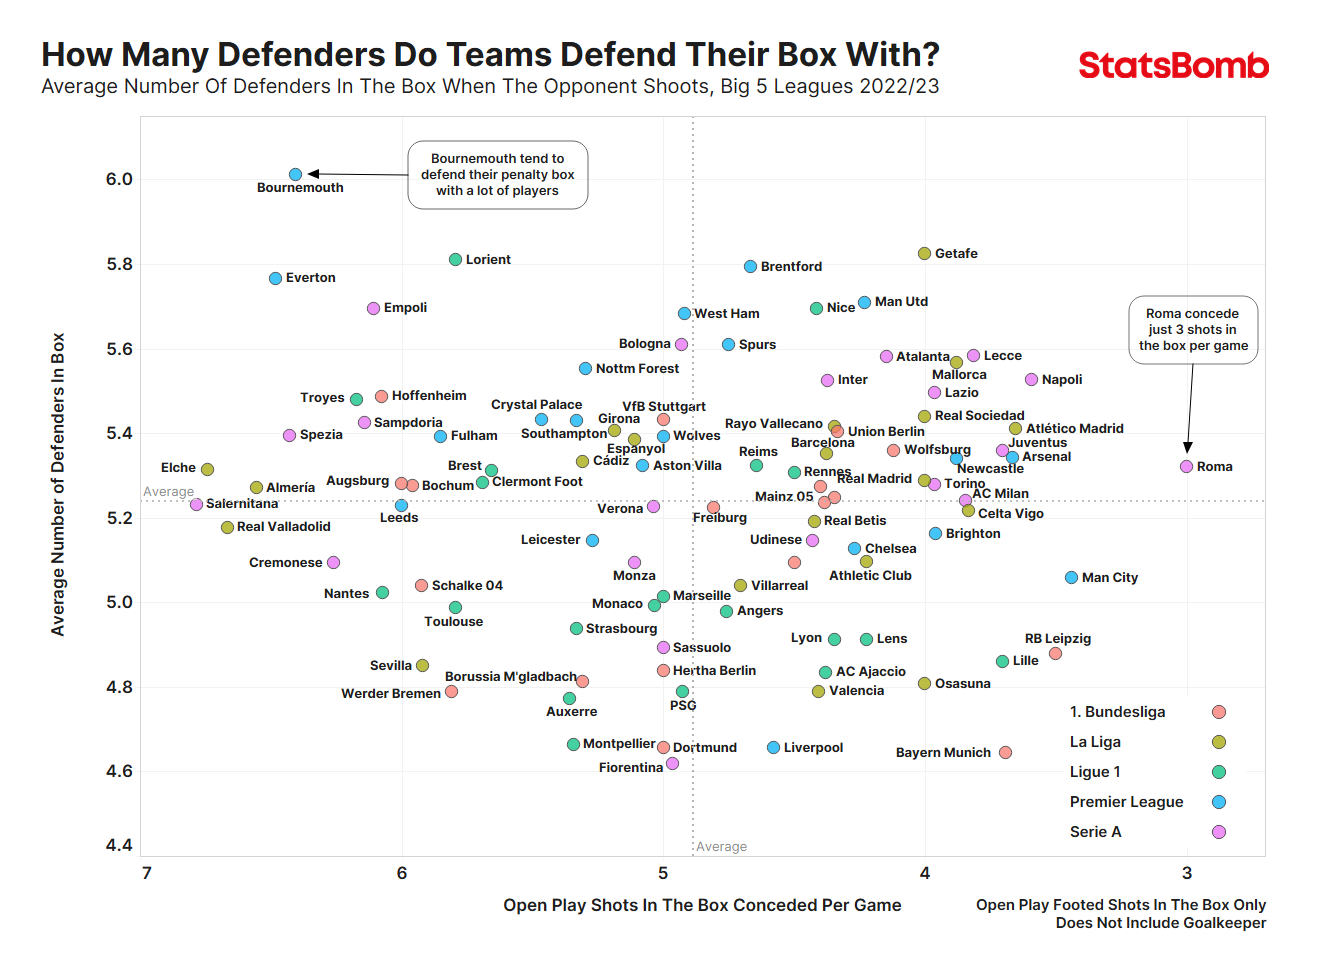
Bayern would have cold feet but for the sterling work of the few players they do nominate for defensive duties. They concede just 3.7 open play footed shots in the box per game. Well balanced, or maybe they just have a bigger blanket than everyone else.
Bournemouth average six defenders in the box when they concede a shot in the box.
Six. Plus the goalkeeper. In the box. On average.
They’ve never managed a perfect ten players (not including the goalkeeper) in the box, but on 11 occasions this season they’ve had nine, leaving just one player not in the box when the shot was taken.
Bournemouth silliness aside, we need to put some respect on the name of José Mourinho’s Roma, because they pop in several key defensive metrics compared to their Big 5 peers (Roma rank in brackets):
- Opposition Passes Completed Within 20m of Goal (1st)
- Opposition Passes Completed Inside The Box (1st)
- xG per shot conceded (1st)
- xG conceded (1st)
Roma keep their opponents at arm’s length but also limit them to poor-quality chances when they do break through. That Roma are pretty close to the Big 5 average for the number of defenders they defend the box with, rather than piling bodies back to restrict the space, points to the quality of the defensive shape rather than just José parking the bus.
Let’s look further at how effectively teams are disrupting their opponents’ box shots.
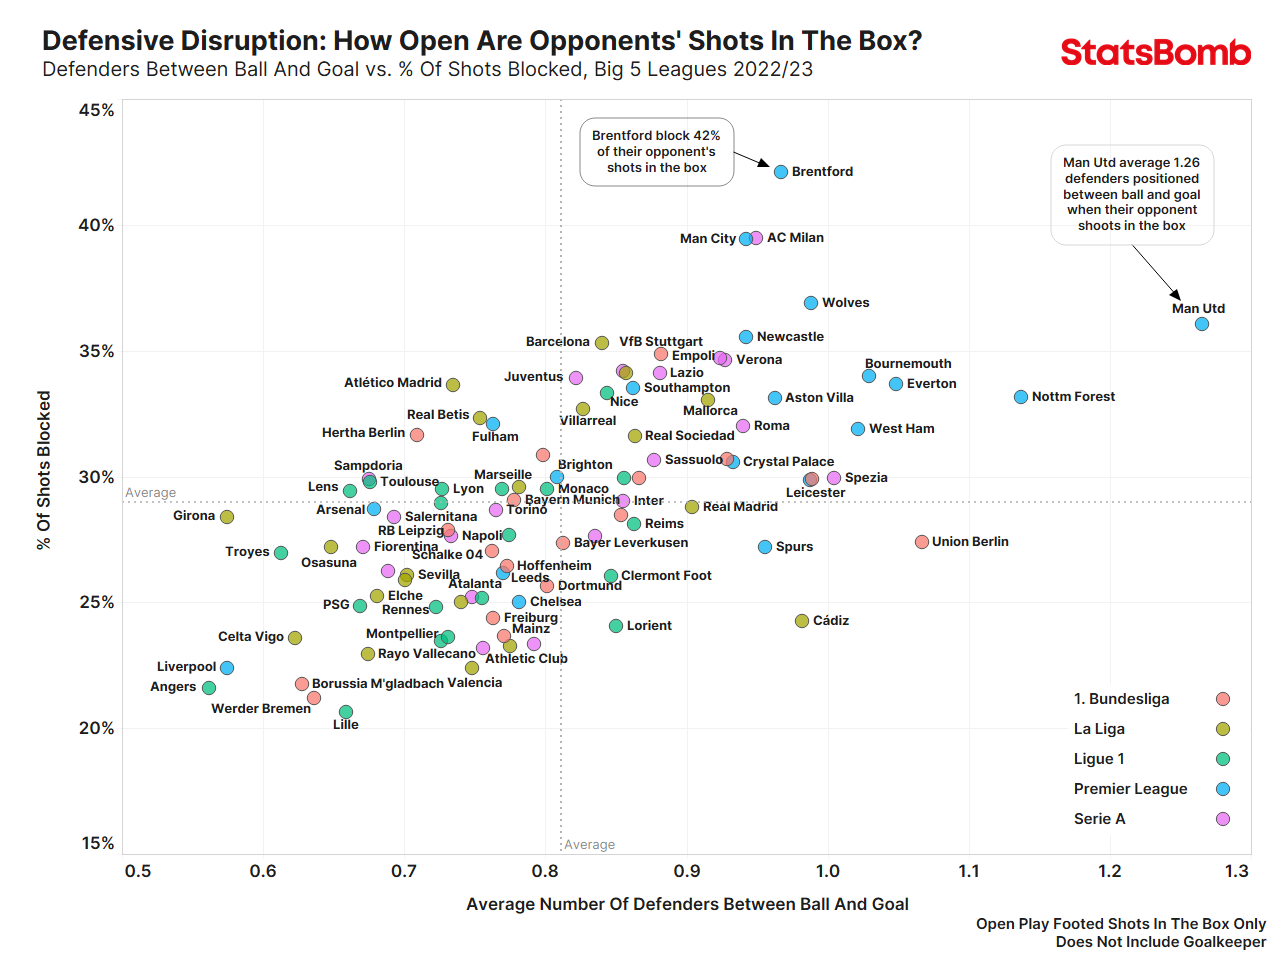
The two obvious outliers here are Brentford and Manchester United. That Brentford’s defence is positioned well enough to block 42% of their opponents’ most dangerous chances goes a long way to explaining their steady rise into the top half of the Premier League.
As for Manchester United, only four teams in the Big 5 have a lower average Defensive Distance than them this season (the average distance from their goal from which a team makes its defensive actions). In Erik ten Hag’s first season in charge, they’ve tended to defend closer to their goal in order to protect the box, rather than be more proactive in winning the ball back higher up the pitch. Where teams average ~1 defender between ball and goal for shots taken in the centre of the box, Manchester United average ~1.5.
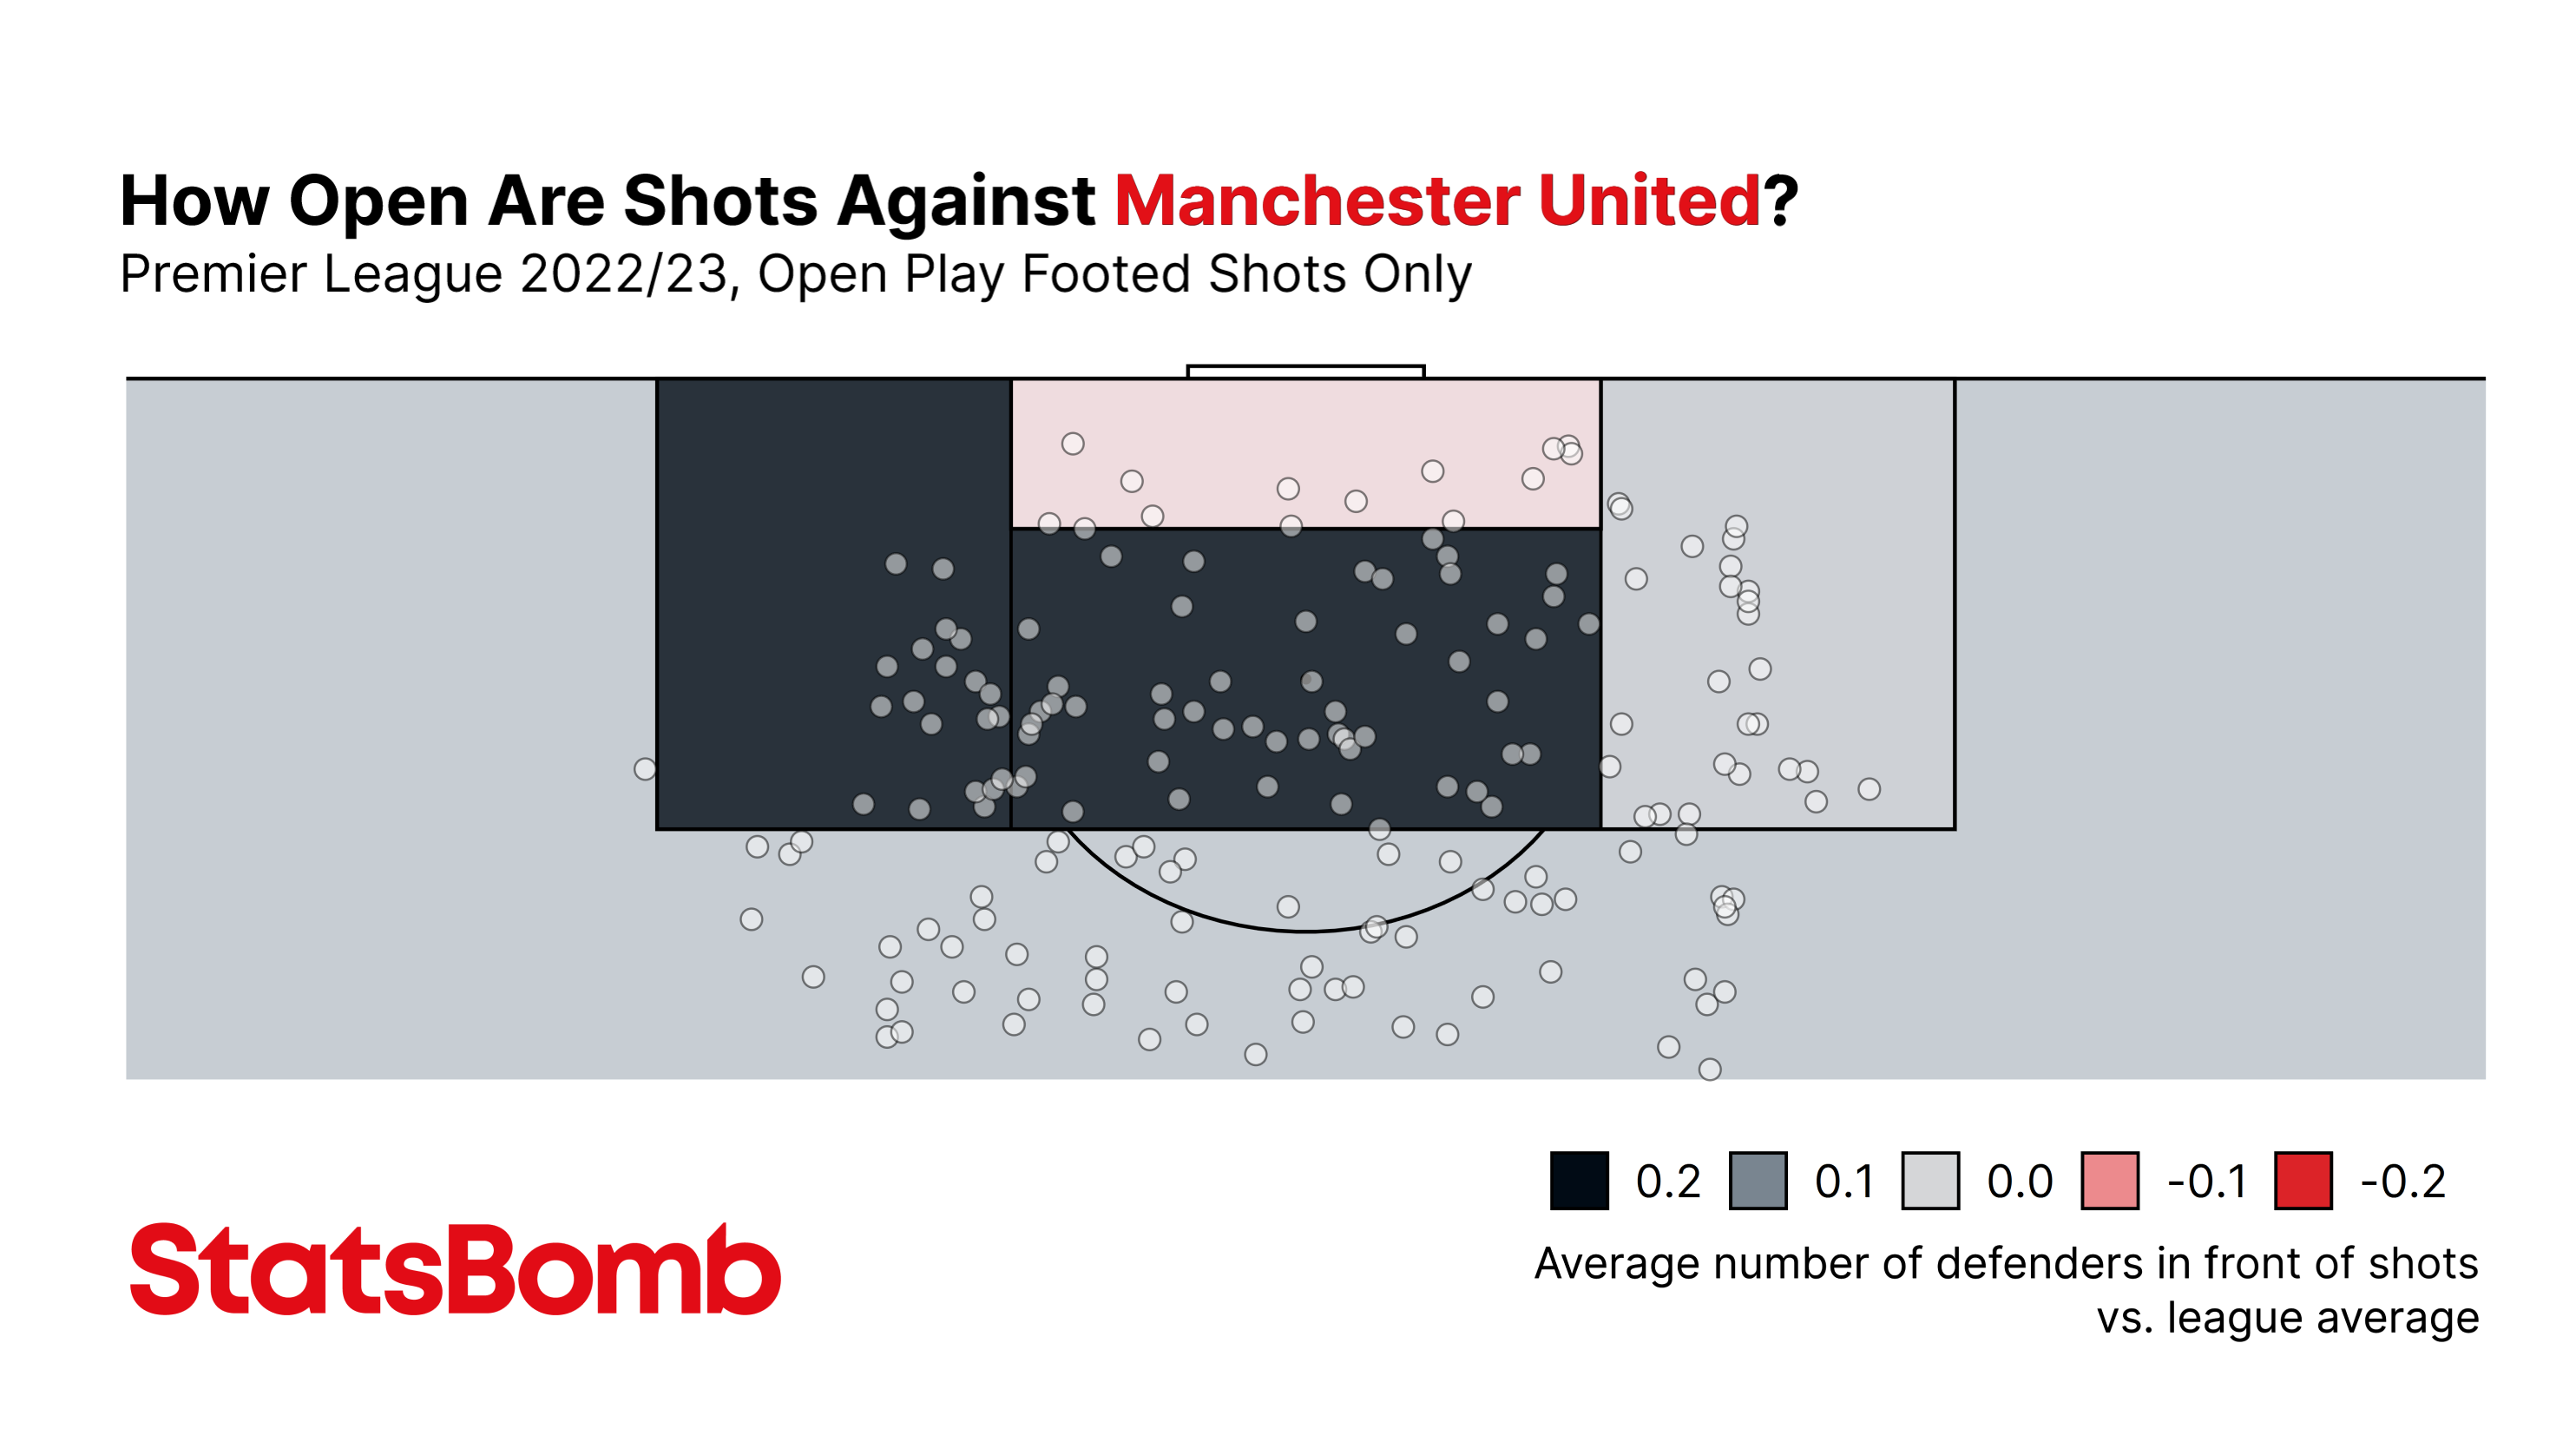
Coaching the press takes time, and there are signs that ten Hag may be starting to implement a higher press more as the season’s gone on: United’s Defensive Distance and PPDA have been creeping steadily towards “high press” territory in recent weeks.
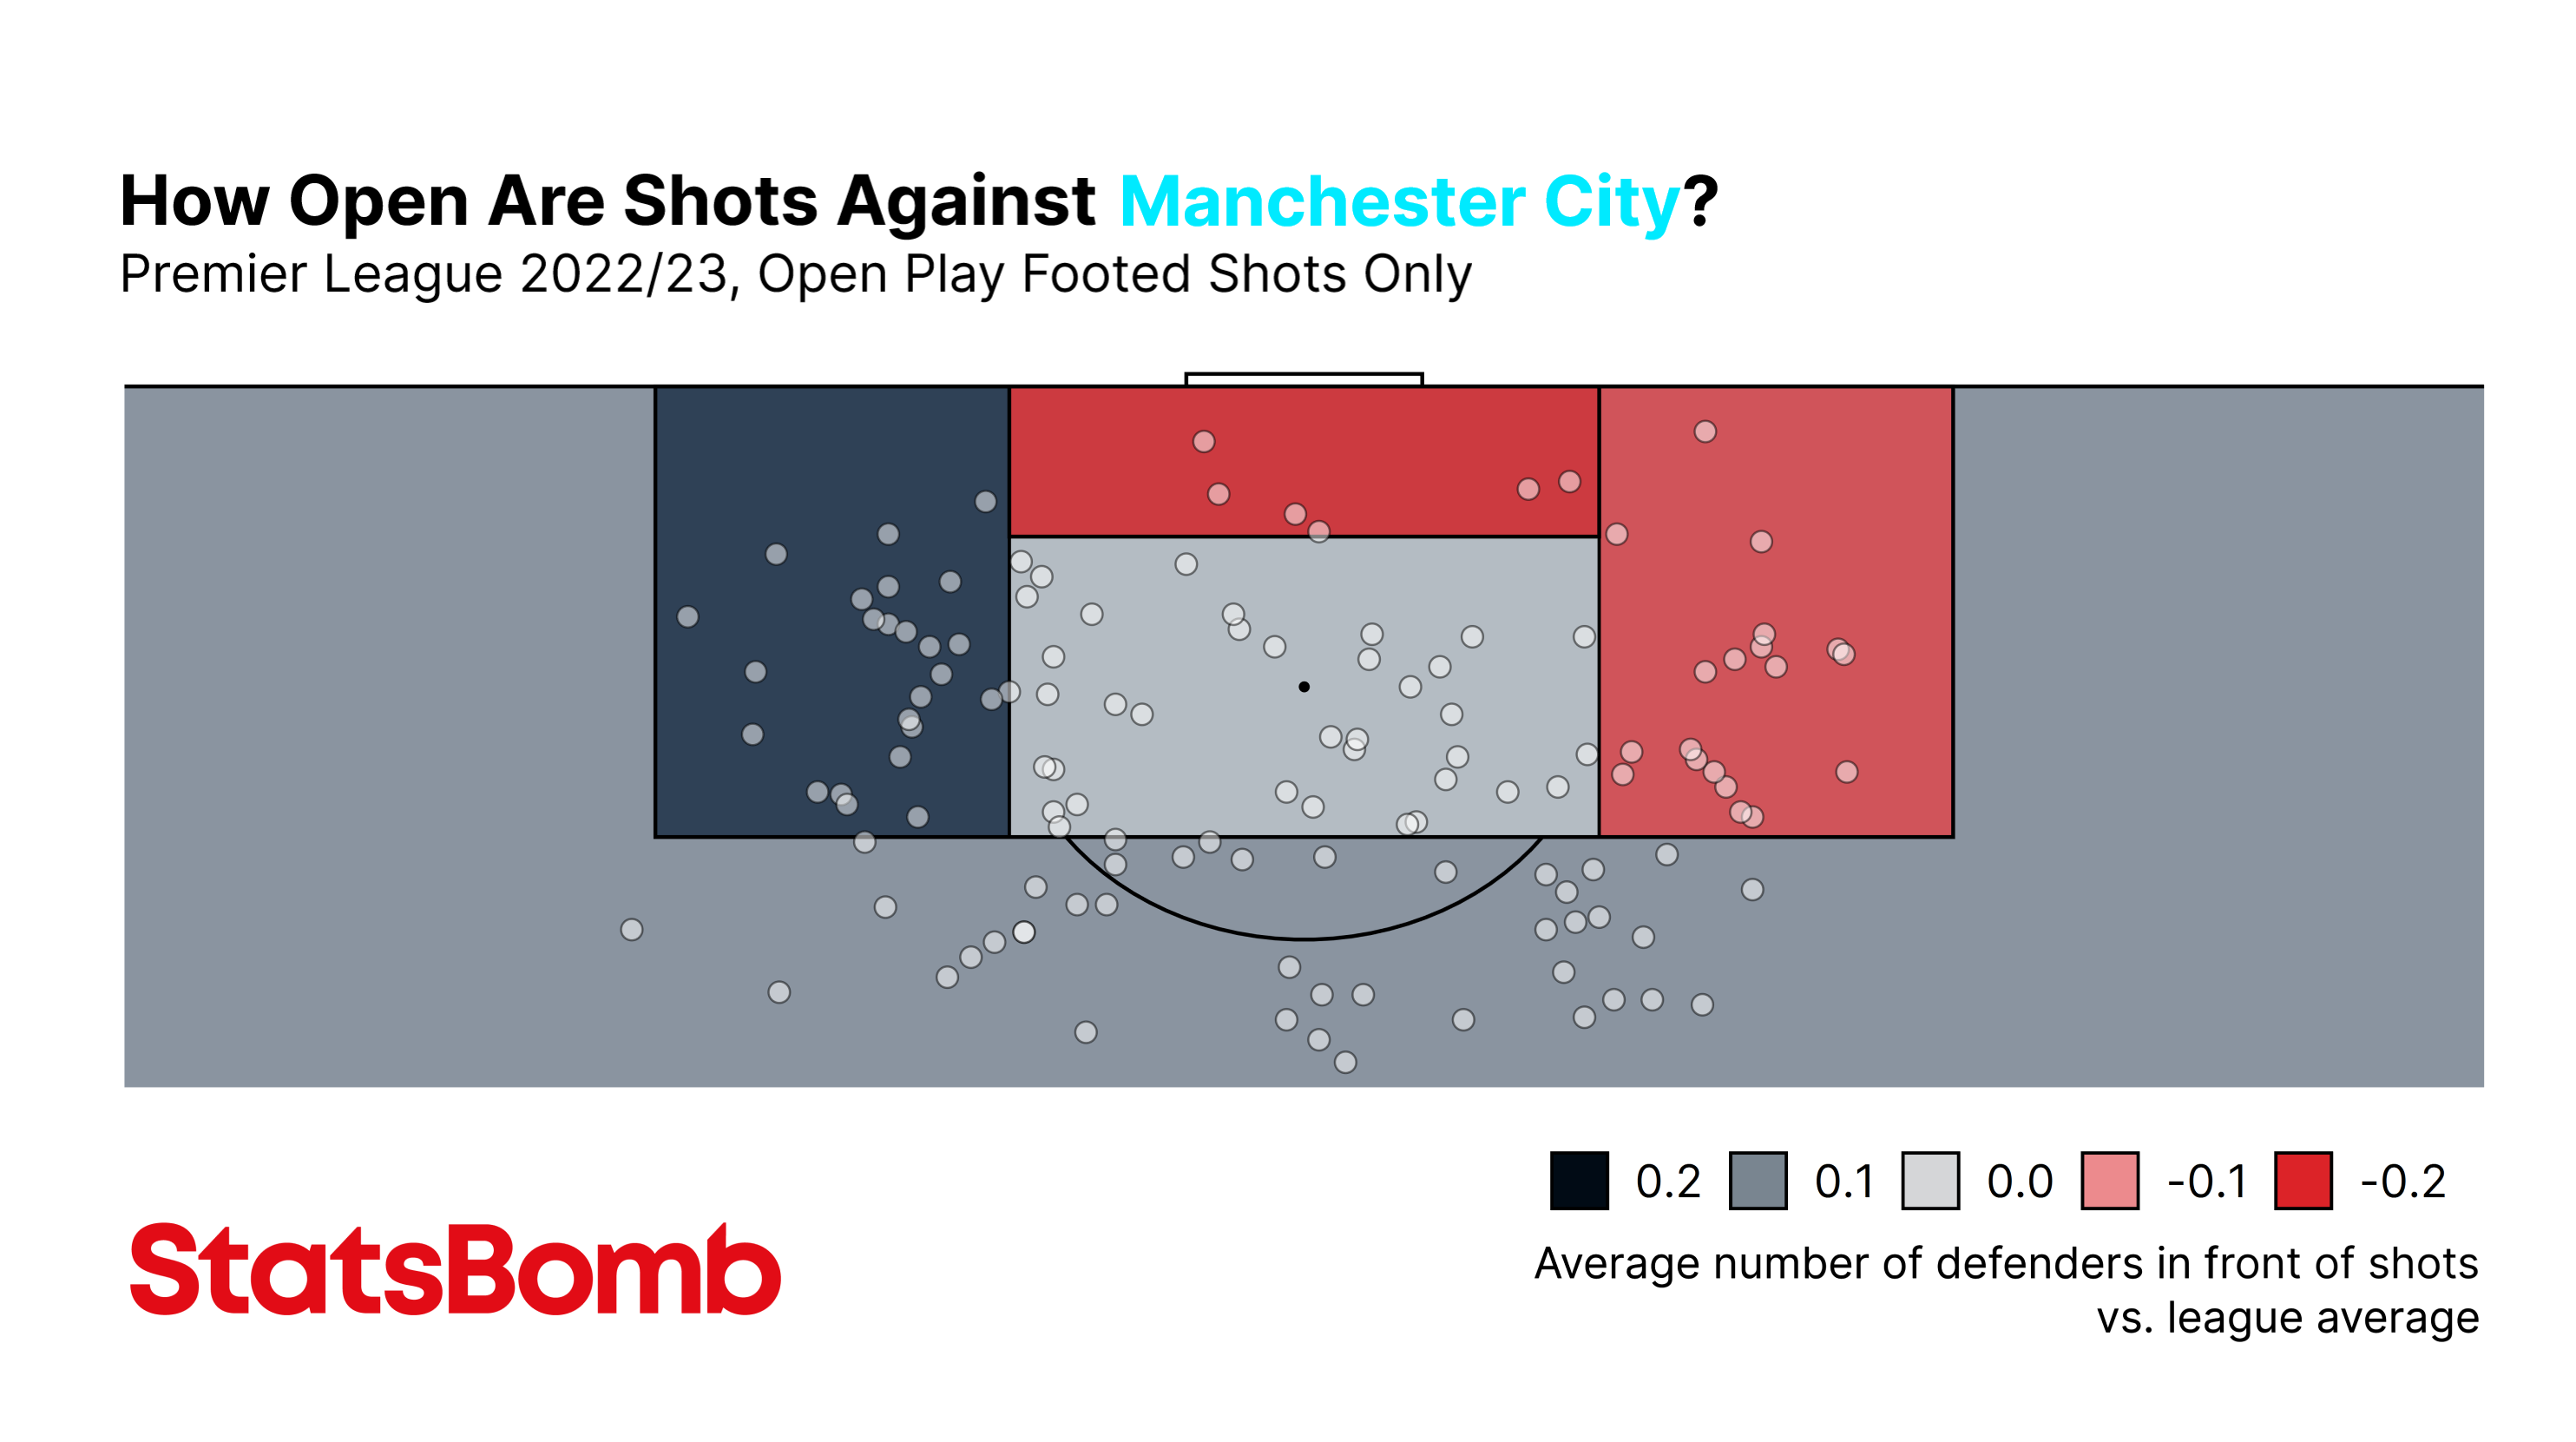
Back to the scatterplot, there’s also a pseudo-trend of Premier League teams positioning themselves more effectively to block shots compared to the Big 5 average. Just four of the 20 teams appear in the bottom-left “below average for both” quadrant, whilst 13 appear in the top-right “above average for both” quadrant. Including Manchester City! For all the talk of Pep Guardiola influencing English football, the data here suggests that English football is also influencing Pep.
Compared to title rivals Arsenal, City’s defence is in position to block shots more often (only Brentford and AC Milan have blocked a higher %), and they concede fewer shots in the box anyway (only Roma have conceded fewer). That defensive organisation could have a major part to play in the Premier League title race.
So, what have we learned?
We’ve quantified a baseline for how an attacking or defensive mentality impacts the number of players a team might choose to attack or defend with. We’ve looked at how different attacking principles can influence those numbers. We’ve proven that English football has influenced Pep Guardiola. And, most importantly, we've put some data to Rafa Benítez's "short blankets" analogy.