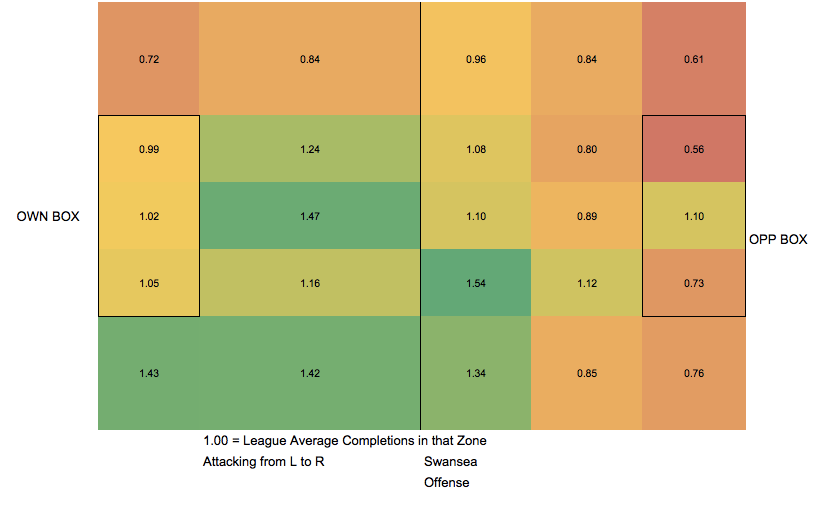
After such a draining international break for us Americans, there will be no hard-core analysis here this week. It's a nice time to introduce and use a few new tools to take a look at some of the more extreme early teams as far as chance creation. Following Paul Riley's lead, I've opened up chance/deep completion maps for the big 4 European Leagues (he's taken care of the EPL quite nicely). It's a tableau workbook with every pass ending within 30 yards of goal for every team with all kinds of filters available. If you want to see only long-balls that wind up incomplete tried by Sassuolo, you can. If you want to see only chances created from the left half-space by Koln, go ahead. These will ideally be updated every two weeks. The other new tool I will use here and hope to rollout customizable ones soon are the full-pitch passing maps. They can add a little context at times, like you can see Swansea's completions remain mainly in their own half as they still struggle to reach goal or that Monaco (as nicely profiled by Mohamed) allow completions in their box at a shocking rate. All of these maps show the attacking team moving from left to right, so in Monaco's defensive map they are the defending the box on the right side of the screen and in Swansea's offensive map they are attacking the box on the right side of the screen.
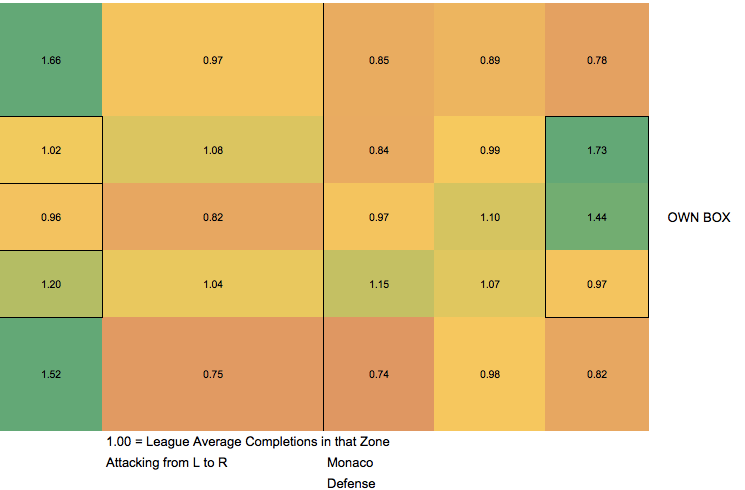
 This post is mainly to introduce those tools by showing a few extreme examples from the early season and then post the links to play with, skip to the bottom if you want that, but be warned. If you do skip now you will know much less about Celta Vigo's preferred direction of attack. Are you willing to forego that? I didn't think so. We will start with a look at the two teams who are most one-sided in the chances the chances they allow. Madrid's softer left side
 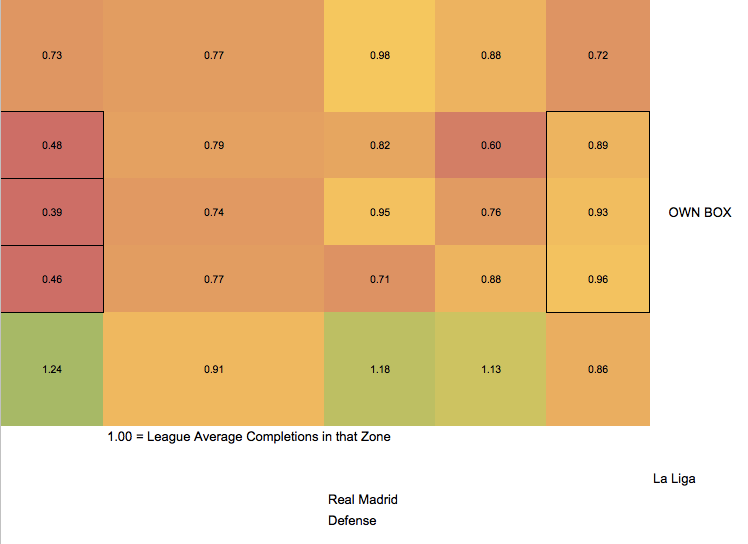 On this map Madrid's opponents are going from left to right. So Madrid's left side is where you see them allowing above-league average completion numbers. Just inside the halfway line and moving toward the box we see 1.18 and 1.13, which means Madrid allow 18 and 13% more completions than the average La Liga team does in that area. You can see from those areas, the half-space and even in the opposition half that Madrid's left side is where opponents like to play. No one in Europe is more left-sided (compared to right) in the deep completions they allow than Madrid. The fact it starts further upfield makes me think Ronaldo's lack of defensive work might be a reason for this. Juventus The opposite of Real Madrid is Juventus. Using the Serie A Chance map we can plot out all their deep completions and see the staggering difference between the left and the right. Juve have apparently used several different formations and I've only seen them play once so no real theories, but it seems to me the magnitude of this difference clearly points to something pretty stark going on. Not that this is necessarily bad, but interesting and something the opposition should heavily scout going into a game.
 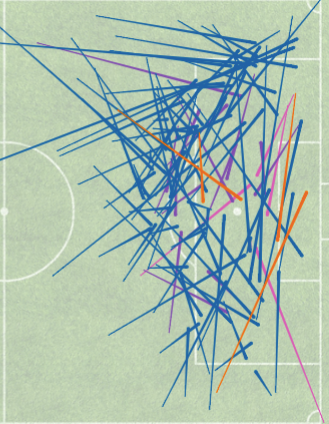 [Legend: Blue=Complete, Pink=Shot from Cross, Purple=Key Pass, Orange=Assist] Others who are very one-sided in defense: Right, like Juventus: Swansea, Liverpool, Manchester City, Stuttgart Left, like Madrid: Koln, Valencia, Sassuolo, Angers One-sided in attack Right: Real Betis, Eintracht, Reims, Norwich, Granada Left: Celta (our cover-boy Nolito!), Rayo Vallecano, Empoli, Chelsea, Arsenal
 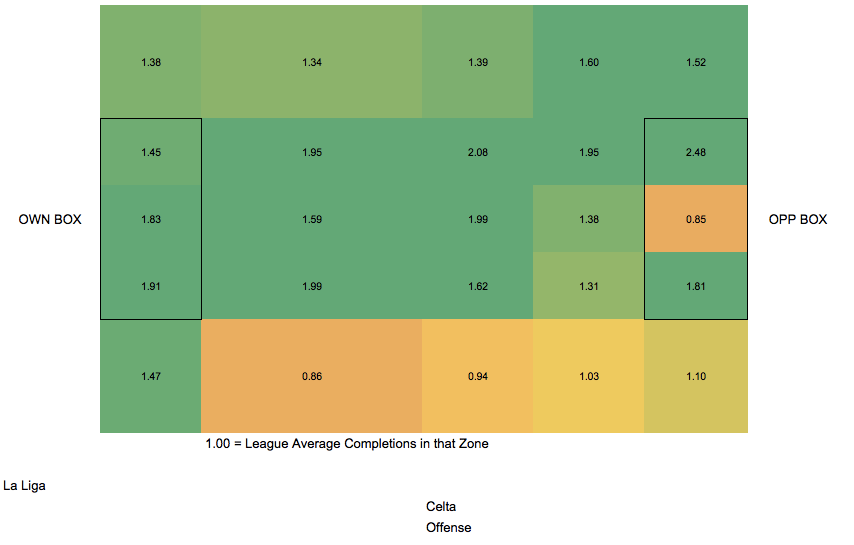 Longest Average Pass to Create a Chance On defense it's Bayern Munich who force teams to complete long passes to set up chances. In general you see the best teams making the shortest passes to set up shots and in general shorter passes lead to a higher shooting percentage. So in general it's a good thing to force long passes, though there are other more important variables on defense. It's rare to see a team with multiple players forward in the box playing one-two's against Bayern, so this comes as no surprise.
 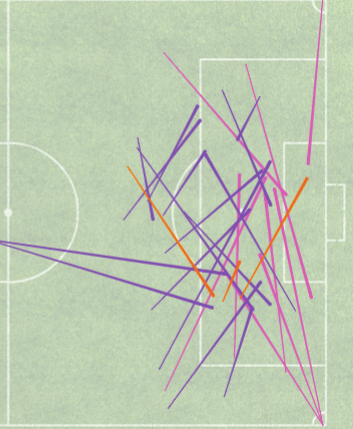 Others in this category: Fiorentina, Rennes, Torino, Borussia Dortmund. Torino and Rennes are some of the best at sitting back and soaking up pressure and it shows here. The shortest average pass length allowed is an interesting case as their defense has impressed in the early going. Bournemouth have allowed the 4th fewest shots per game in the entire league but have allowed a ton of short passes to be turned into shots. Not sure what that means in total but they will be an interesting study going forward.
 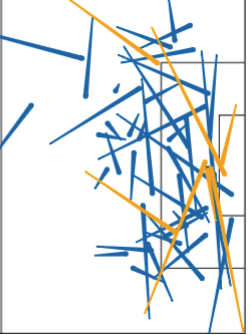 From Paul's map where blue=key pass, yellow=assist. Others allowing short passes: AC Milan, Sunderland, Roma, Juventus. An interesting mix of teams that shows it's not a death notice to allow short key passes. The team who has the longest average pass to create their own chance: Real Sociedad. The cross-heavy system favored by David Moyes can lead to this.
 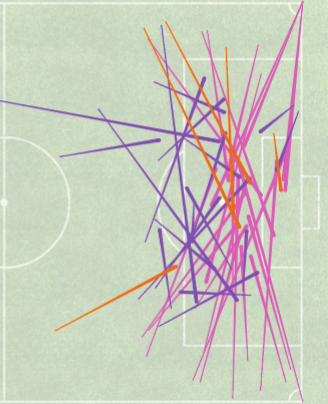 Others who have long key passes: Bastia, Getafe, Granada, and surprisingly Lyon. Those with the shortest key passes: Atletico, Empoli, Nice, Roma, Manchester City. Real Sociedad's key passes average 28.3 yards while Atletico's average 17.4 yards, a nearly 11 yard difference. Chance % This is simply the percentage of passes in the final 30 yards that are turned into shots. The lowest is Juventus at only 8.2% of passes in this area. Here's a sampling.
 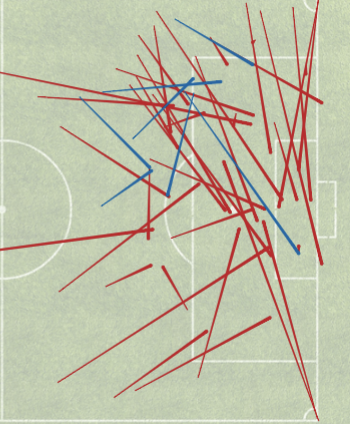 Juve passes ending in final 30 yards (minutes 30-45) The 2nd-highest chance% allowed is a team I've written extensively about, Gladbach. This is extremely different from how they have played in recent years and was one of the big causes of their early season collapse.
 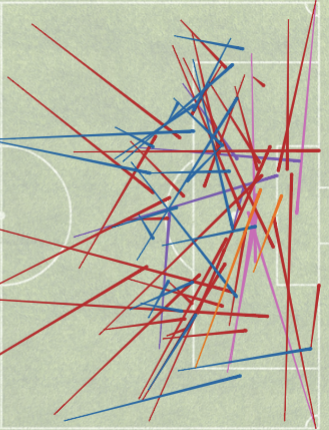 Same filters as Juventus. A lot less red and more blue (completions)/pink (shots off crosses)/purple (key passes). Ahead of even Gladbach, the #1 team in terms of highest chance% conceded so far: Jose Mourinho's Chelsea. 15.7% of passes turn into shots in the final 30 yards. Yet another stat on the what-the-hell, Chelsea? never-ending train of stats. Last year the highest rate in the Premier League was QPR at 14%. That's a short introduction and a glimpse at some of the more extreme maps, go ahead and build your own now. Chance Maps Ligue 1 La Liga Bundesliga Serie A Like Paul Riley's visuals, these links are also housed in the menu bar at the top of the page, for easy reference. Enjoy!
2015
European Chance Maps and Taking a Look at Some Early Extremes
By admin
|
October 14, 2015