What can we learn in the early days of the season? I'm defining early days as 5 or 10 games here. Pretty much every piece anyone writes is prefaced with "early days" or something similar indicating we should not draw strong conclusions from this data. That is how it should be because things change a lot as the season goes on. I wanted to know just how much can we know and how much do things change.
So I looked at 136 teams from the past 3 seasons in various leagues (Spain, Italy, 2x Germany, France, 2x England) and how they did in the early games compared to how they did the rest of the season in shots, shots on targets, deep completions, and goals. Deep completions are passes completed within an estimated 20 yards of goal (crosses excluded).
I realize I am not the first to do something like this. James Grayson looked at how quickly advanced metrics find their final values, and 11tegen11 took an excellent look at what ratios predict the rest of the season the best. Both are great pieces but hopefully by breaking it down by sides of the ball in-sample vs out-of-sample I can add some to their work.
The first chart is the r squared value of each stat in the first 5 or 10 games against itself the rest of the season. So when you see the 0.28, that means a teams goals scored in their first 5 games has a .28 r squared value when compared with their goals scored per game the rest of the season (33 or 29 games depending on the league).

The most interesting takeaway for me is dangerous completions. It's not that surprising, but teams who are good at getting the ball into dangerous positions identify themselves very quickly. The other interesting thing is the lack of correlation when it comes to defensive events compared to offensive ones. We will come back to this later. Right now we look at how reliable early season rate stats are. It's the same process, the 5 games and 10 games columns are compared to the rest of season games.

And then we see which one is best at predicting goal rate the rest of the season.

Unsurprisingly, we see shots on target is the best at calling the rest of the season. It seems by now we would have left such a seemingly simple stat in the dust, but it lingers on, still effective, like Rafa Marquez playing for Mexico. Expected goals was not included here because I didn't have the data by individual games. Based on Michael Caley's quality research, we can probably assume the most detailed expected goal models would slot in slightly ahead of SoT in these kinds of studies.
So, leaving the rest-of-season rates behind and returning to the reliability of offense vs defense I wondered why is offense so much more reliable than defense when looking at a small sample of games (or really any sized sample)?
To investigate this, I looked at how different attacks were at getting the ball into dangerous positions vs good defenses and bad defenses. I did the same for defenses vs attacks. I wanted to see which side of the ball "controlled" the game. The results were interesting:
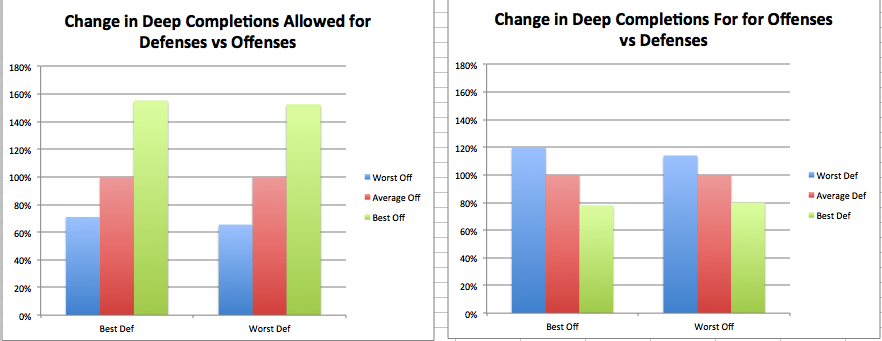
Defenses change from their average a lot more than offenses. A top defense can expect to face 50% more deep completions relative to average when they play a top offense. A top offense sees their deep completion numbers drop only about 20% when they face the top defenses. Offense sees less variation depending on strength of schedule and plays closer to their averages.
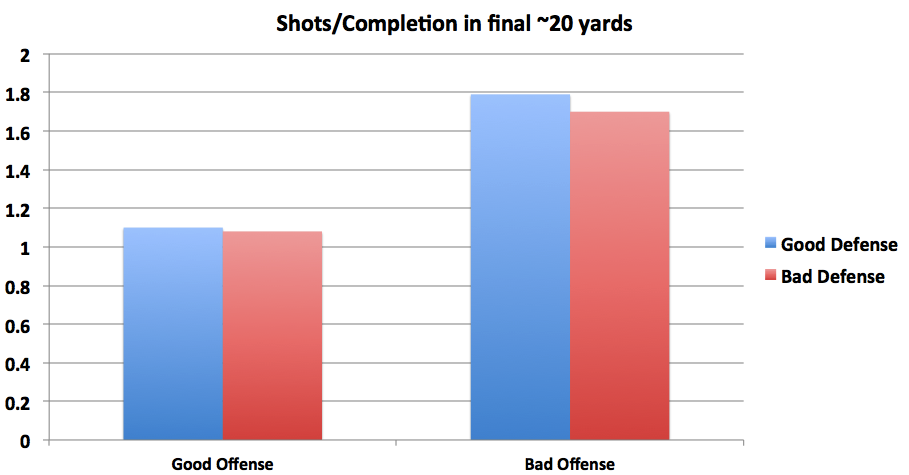
Interestingly, the same trend does not hold when looking at shots. Both defenses and offenses swing about 17% from their overall averages when facing the best or worst of their opposite sides. I pondered why this would be, why do defenses allow 50% more deep completions when facing a great offense but only 20% more shots? It has to do with the fact that the best teams generally average a lower shot/deep completion ratio. The best offenses can possess the ball and set up shop with more players in the attacking third. More options to pass to means less urgency to fire immediately and more patience to wait and pick out a better shot. If you have the potential of passing to a teammate to take a clean look from 12 yards, you will be much less likely to try a harried shot through traffic from 15 yards. This shot/deep completion ratio does not drastically change depending on the opponent:
I wanted to look further at this total shot/deep completion rate so split each teams offensive and defensive shot/deep completion rates into halves of seasons.
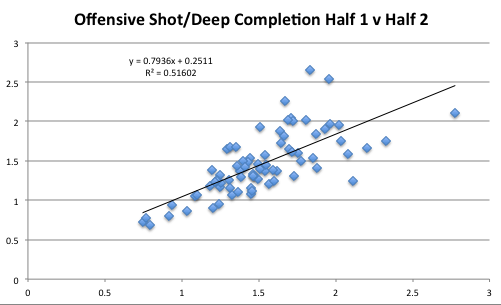
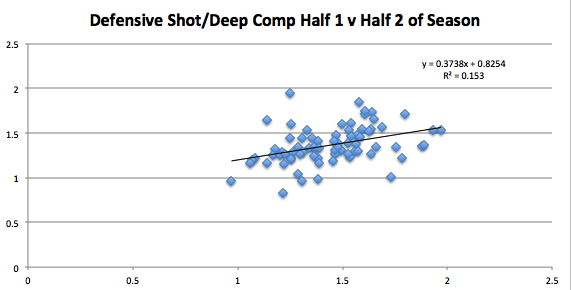
Offenses have more control over their shot/deep completion rate. Defenses can do all they want and affect things some but how often a team shoots per pass in deep areas seems to be more in the hands of the offense.
Wrapping up
-If you have to guess before a game about who is going to get into dangerous position more often, base it on how often the offenses get into dangerous positions. In general, they will dictate where the ball spends most of its time.
-The best offensive teams generally pass a lot more often when within 20 yards of goal, this is because they have more options available so any given shot is not as valuable as it is for teams with bad offenses. In general it's a better decision for Jermaine Defoe at Sunderland to launch an 18-yard shot than it is for Marco Reus at Dortmund even if the expected conversion % is the exact same. Sunderland will probably not get the ball into a better spot, while Dortmund are more likely to. This decision seems to be mainly made by the offense and not the defense.
There is tons of work to do here. Something Paul Riley wrote I believe has lots of relevance on this issue. If you have more people in the box on offense (or fewer on defense) it follows that you will be passing more and the chances you get will be cleaner. I think the pass/shot decision is a ripe area for research and will be able to tell you a lot about a team or maybe way down the road, players. The ratio of attackers in the area vs defenders in the area for each goal/shot/pass seems like a great piece of information to add to this still-blurry picture.
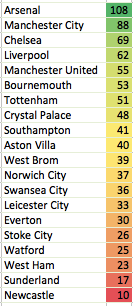
Deep Completion Table
We've talked about it enough so let's look at a table. It's good news for Bournemouth, who have been very impressive on the attack so far.
Passing Map Time
This week it is Liverpool who you can play around with and see how they move the ball. It is preset to show the surprisingly low # of completions from Henderson to Milner in their nearly 2 games together.
This link takes you to a separate workbook page
There are multiple parameters that you can tweak: type of pass, game, time in game, origin, distance, result, danger level, passer identity, receiver identity and more. So particularly if you're a Liverpool fan, take a look under the hood and see what passing styles are driving their play.

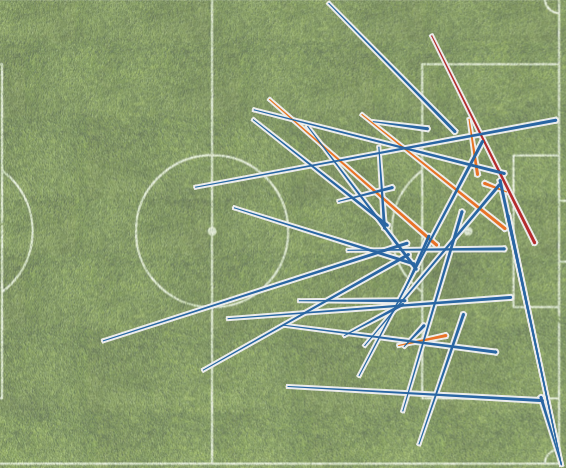
An interesting, if slightly unfair, comparison is how Liverpool gets the ball to its main goal threat in dangerous positions vs Bayern to theirs. Liverpool deep completions to Benteke:
vs Bayern's deep completions (their map can be found here) to Muller/Lewandowski
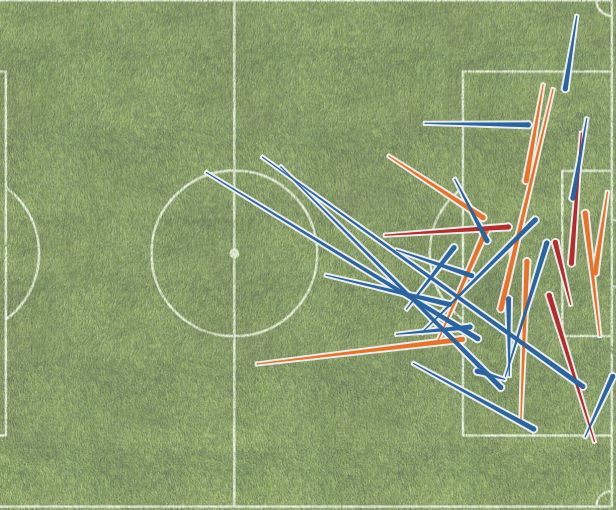
The average completion to Benteke travels 28 yards while Muller and Lewandowski are receiving passes from 21.6 yards away. Benteke also accounts for 34% of all Liverpool receptions within 25 yards of goal, while Muller and Lewandowski combined are at 43% for Bayern, showing they simply have more options in attack.
Hope you enjoyed and would love to hear your thoughts in the comments or on twitter @Saturdayoncouch.
