StatsBomb is unveiling three new (to us) passing metrics to better profile passers in professional football. Why passing metrics? Because this is football and passing is omnipresent. For better or for worse, the ubiquitous event may need even more attention than we’re already giving it. It is our objective through these metrics to evaluate a passer’s creativity, their predictability and frankly their overall passing ability.
Thanks to some of the great work by peers made publicly available, we were able to put these together without too much time consuming innovation. We will release the metrics in a series of posts to spread out the joy and peak the eagerness for all you nerds. The first metric we are releasing today is “Pass Uniqueness”.
Pass Uniqueness Methodology
“Pass Uniqueness” is a variation on previous work (I am not claiming the novelty of this idea in the slightest, but I am expanding on it thanks to the vast amount of data over here at StatsBomb). The original methodology is available on FC RStat’s GitHub, you can even find the original code. The advantage of a uniqueness metric is to see which players make less common passes than others. Although, as the original write up notes, a less common pass is not necessarily an advantageous one. It could be completely erratic, but in and of itself it is unique. In a follow up post, we will talk about identifying advantageous passes.
The basis for these methods is largely the same as previous iterations, however we make some key extensions that require a bit different methodology. We extract the similar following variables describing each pass:
- duration
- length
- angle
- height.id (1 = Ground Pass, 2 = Low Pass, 3 = High Pass)
- body_part.id (1 = Right Foot, 2 = Left Foot, 3 = Other)
- location.x
- location.y
- end_location.x
- end_location.y
At the competition level, we then do a KNN search for the 20 most similar passes (k = 20) to each individual pass (target). Most similar is defined as the closest passes in Euclidean distance to the target pass. The “uniqueness” metric is calculated as the sum of the euclidean distances for all k = 20 passes. More formally,

There is some controversy in using Euclidean distance with categorical variables like height.id and body_part.id. However, for simplicity, we make the intentionally, naive assumption that their numeric IDs are continuous and we order them intuitively so that Ground Pass is closer to Low Pass which is closer to High Pass.
There are other metrics to better account for categorical variables and a good reference for KNN distance metrics can be found here. Since the euclidean distance is aggregated across all variables in the search, it is important that we scale all variables to have the same mean 0 and standard deviation 1. Otherwise, variables on a larger scale would unjustly carry more weight just because their individual distance metric would be larger than the other covariates.
The R package FNN makes this search very quick, a data set of 3.2 million passes takes about 2 minutes to run. To reduce dimensions and to keep the sample for each search more homogeneous, we only search for nearest neighbors inside of each league and backdating up to one season. It’s important to note a limitation here. The limitation is that with larger sample sizes there is a higher propensity for more similar passes and as a result fewer unique passes due to the lower euclidean distances. In order to make the uniqueness metric more scalable across bigger and smaller competitions, it would make sense to set k equal to a proportion of the total population within each competition.
We account for that limitation in a different way. We extend the KNN search into a model based method. Using the “uniqueness” value calculated from the KNN search in each league, we then regress the uniqueness value on the same covariates in the original search. We could do this in a simple linear regression, but one would have to properly specify the non-linear relationship between location coordinates and the uniqueness. Instead, we use a tree based method to handle the non-linearities seamlessly. Using extreme gradient boosting (xgboost), we construct trees with a maximum depth of 12 different predictor combinations training for 1000 rounds.
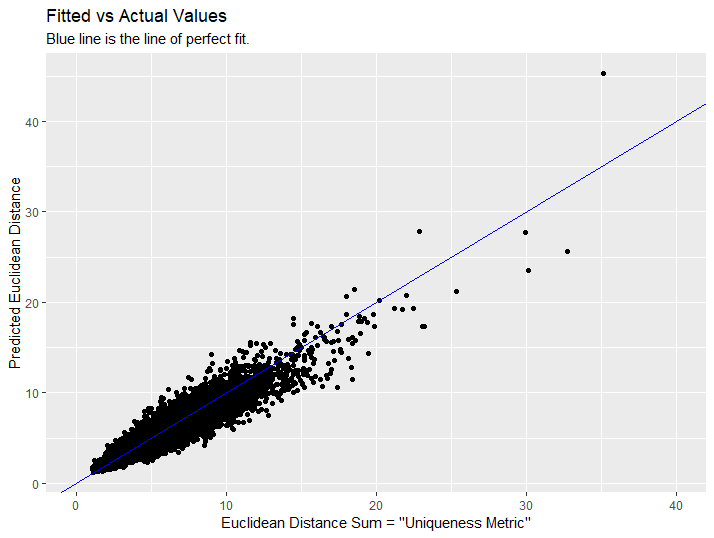
We then check the correlation between the actual uniqueness from the KNN search and the predicted uniqueness from the xgboost method. A scatterplot of our results is shown below:
Correlation
It looks like we did pretty well! The correlation between observed uniqueness and predicted uniqueness was 0.967!
Now, why is this model based extension helpful? There are a few reasons. The first is that the original framework of the uniqueness metric requires searching an entire competition at each update. That can be computationally expensive especially if you have to update competitions 2-3 times a week. Secondly, the results are dependent on the individual competitions that they are in and therefore cannot easily extend into new competitions, especially competitions with fewer matches.
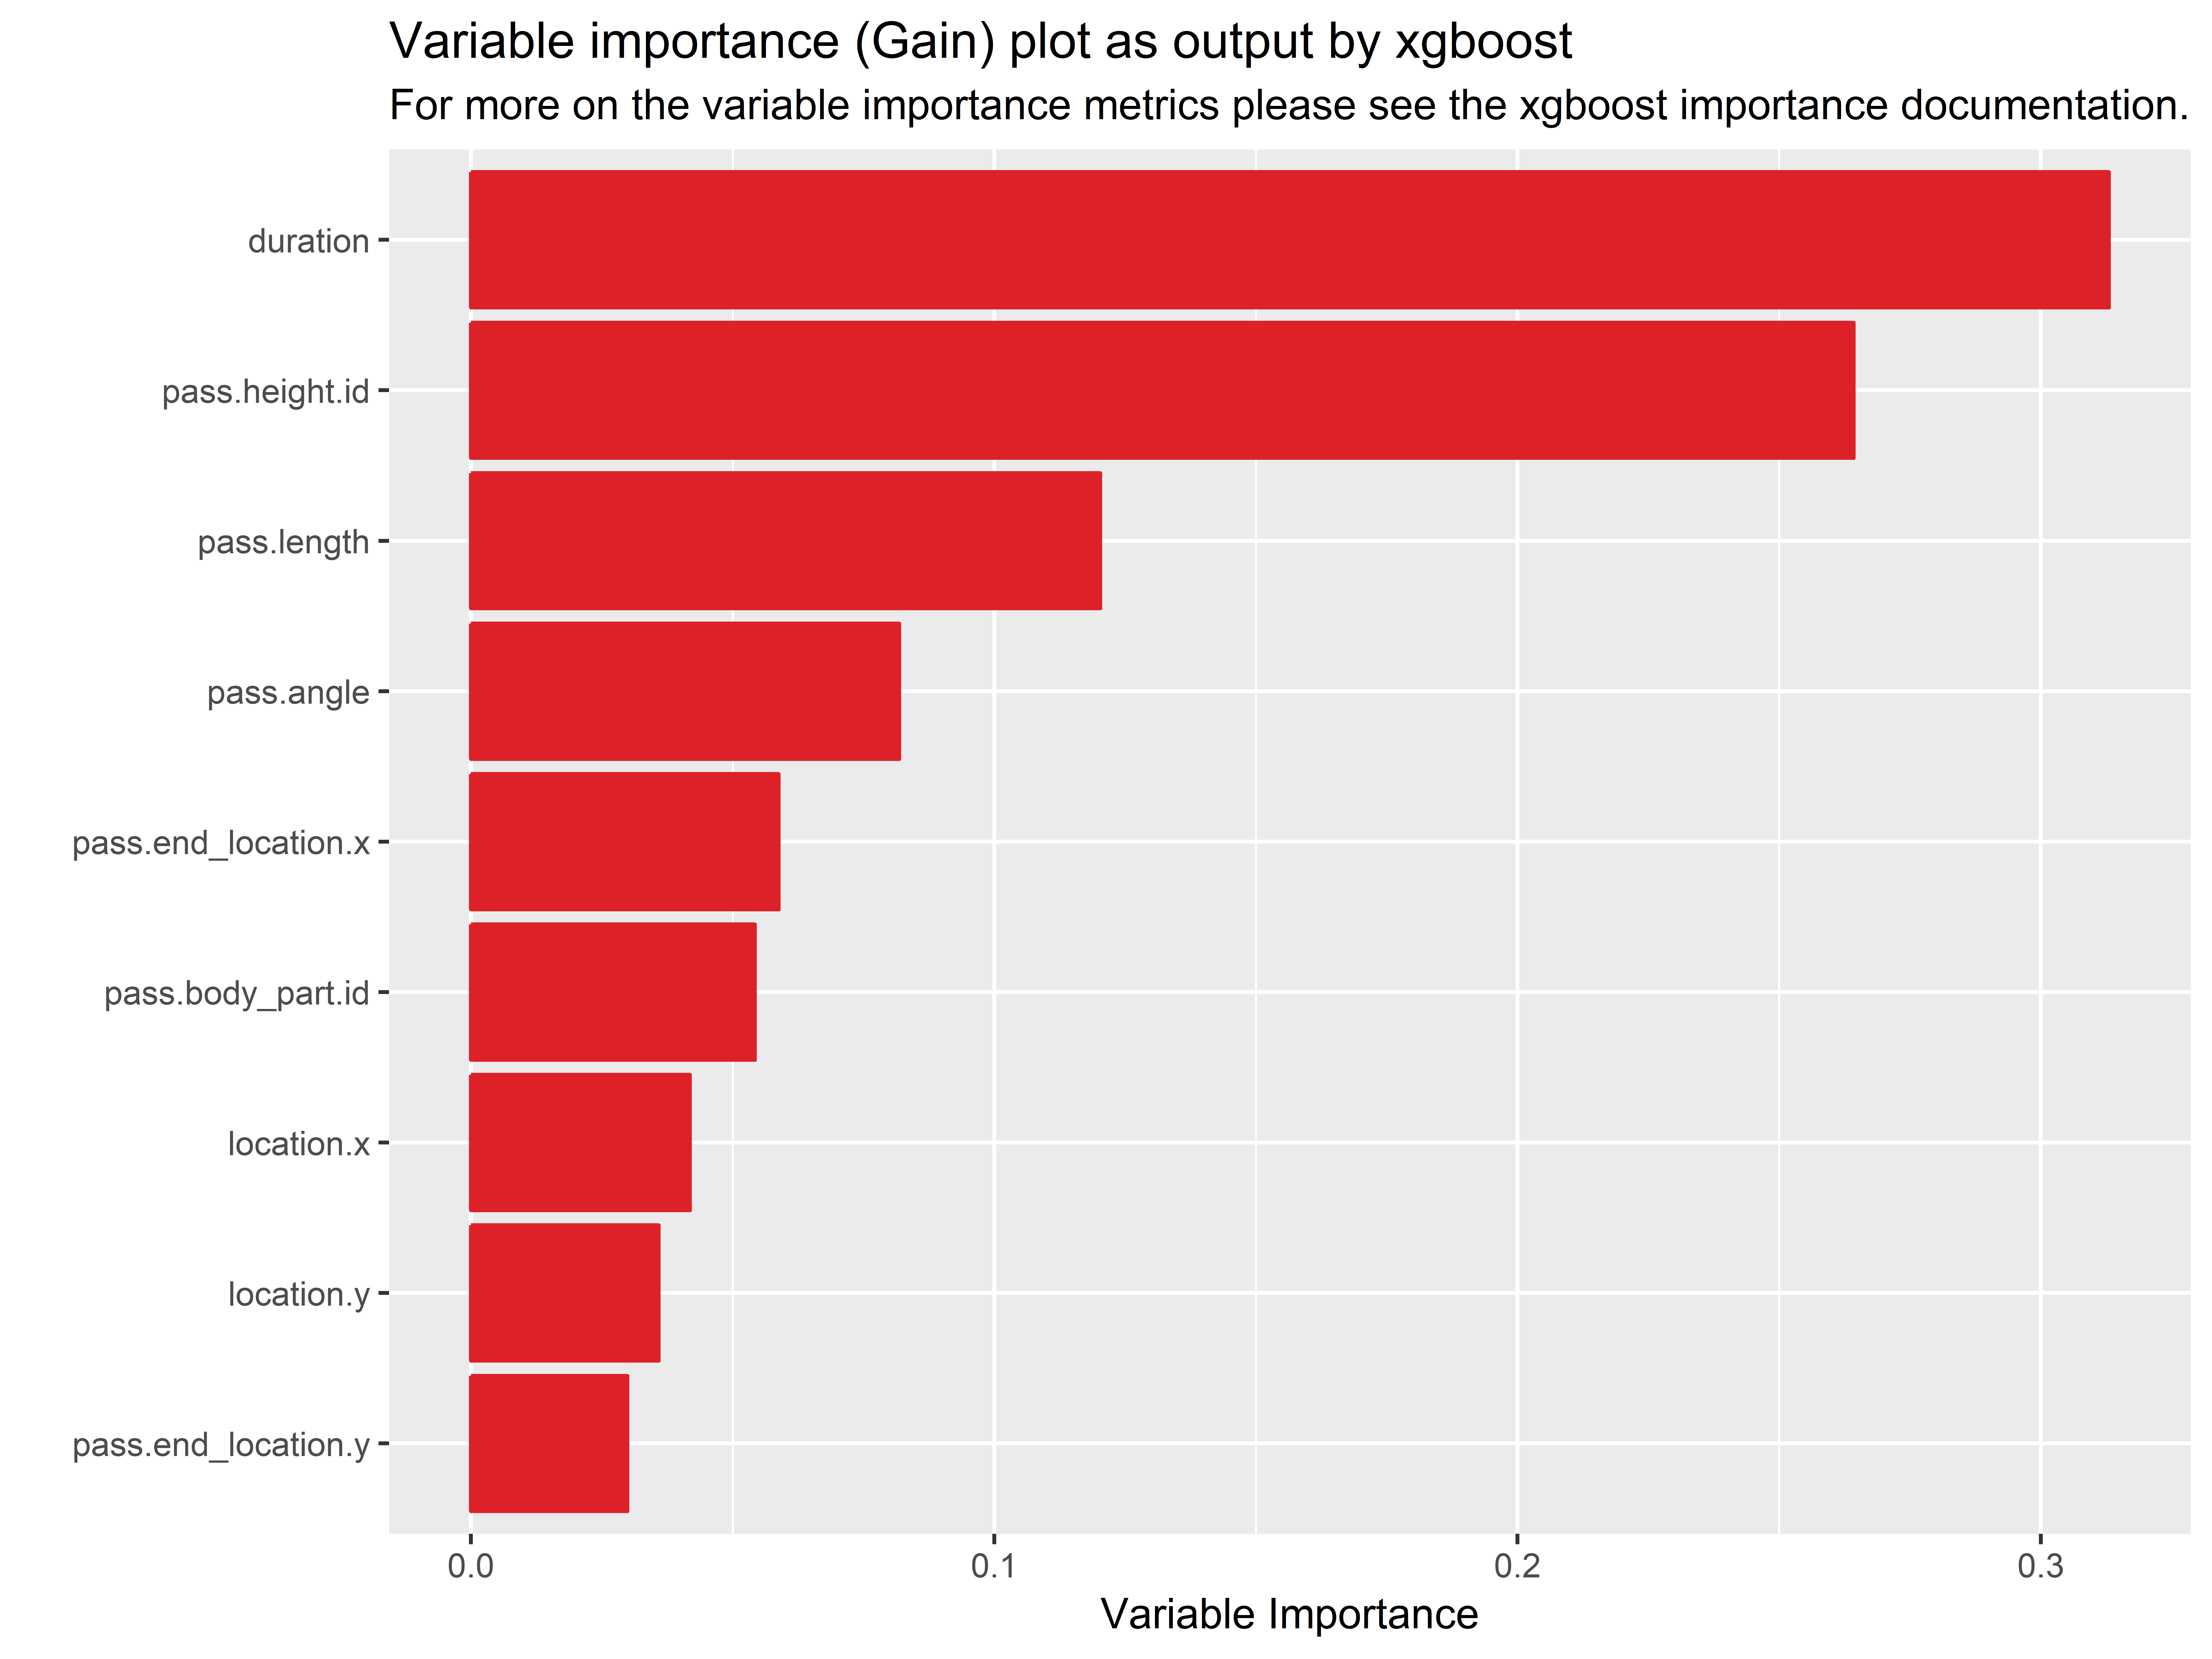
Using a model based approach allows us to quickly extend the “uniqueness” metric to new passes in new matches and competitions. The model based approach also allows us to further investigate the most important features influencing the actual “uniqueness” value.
Applications
With that long winded methodology out of the way, let’s get into all the cool and intriguing applications. The uniqueness metric describes passes that are more unusual than most. It can separate extraordinary passers from the ordinary and it can be used to better grade pass difficulty, pass predictability and positive attacking contribution. Let’s first look at the distribution of pass uniqueness for different player’s positions.
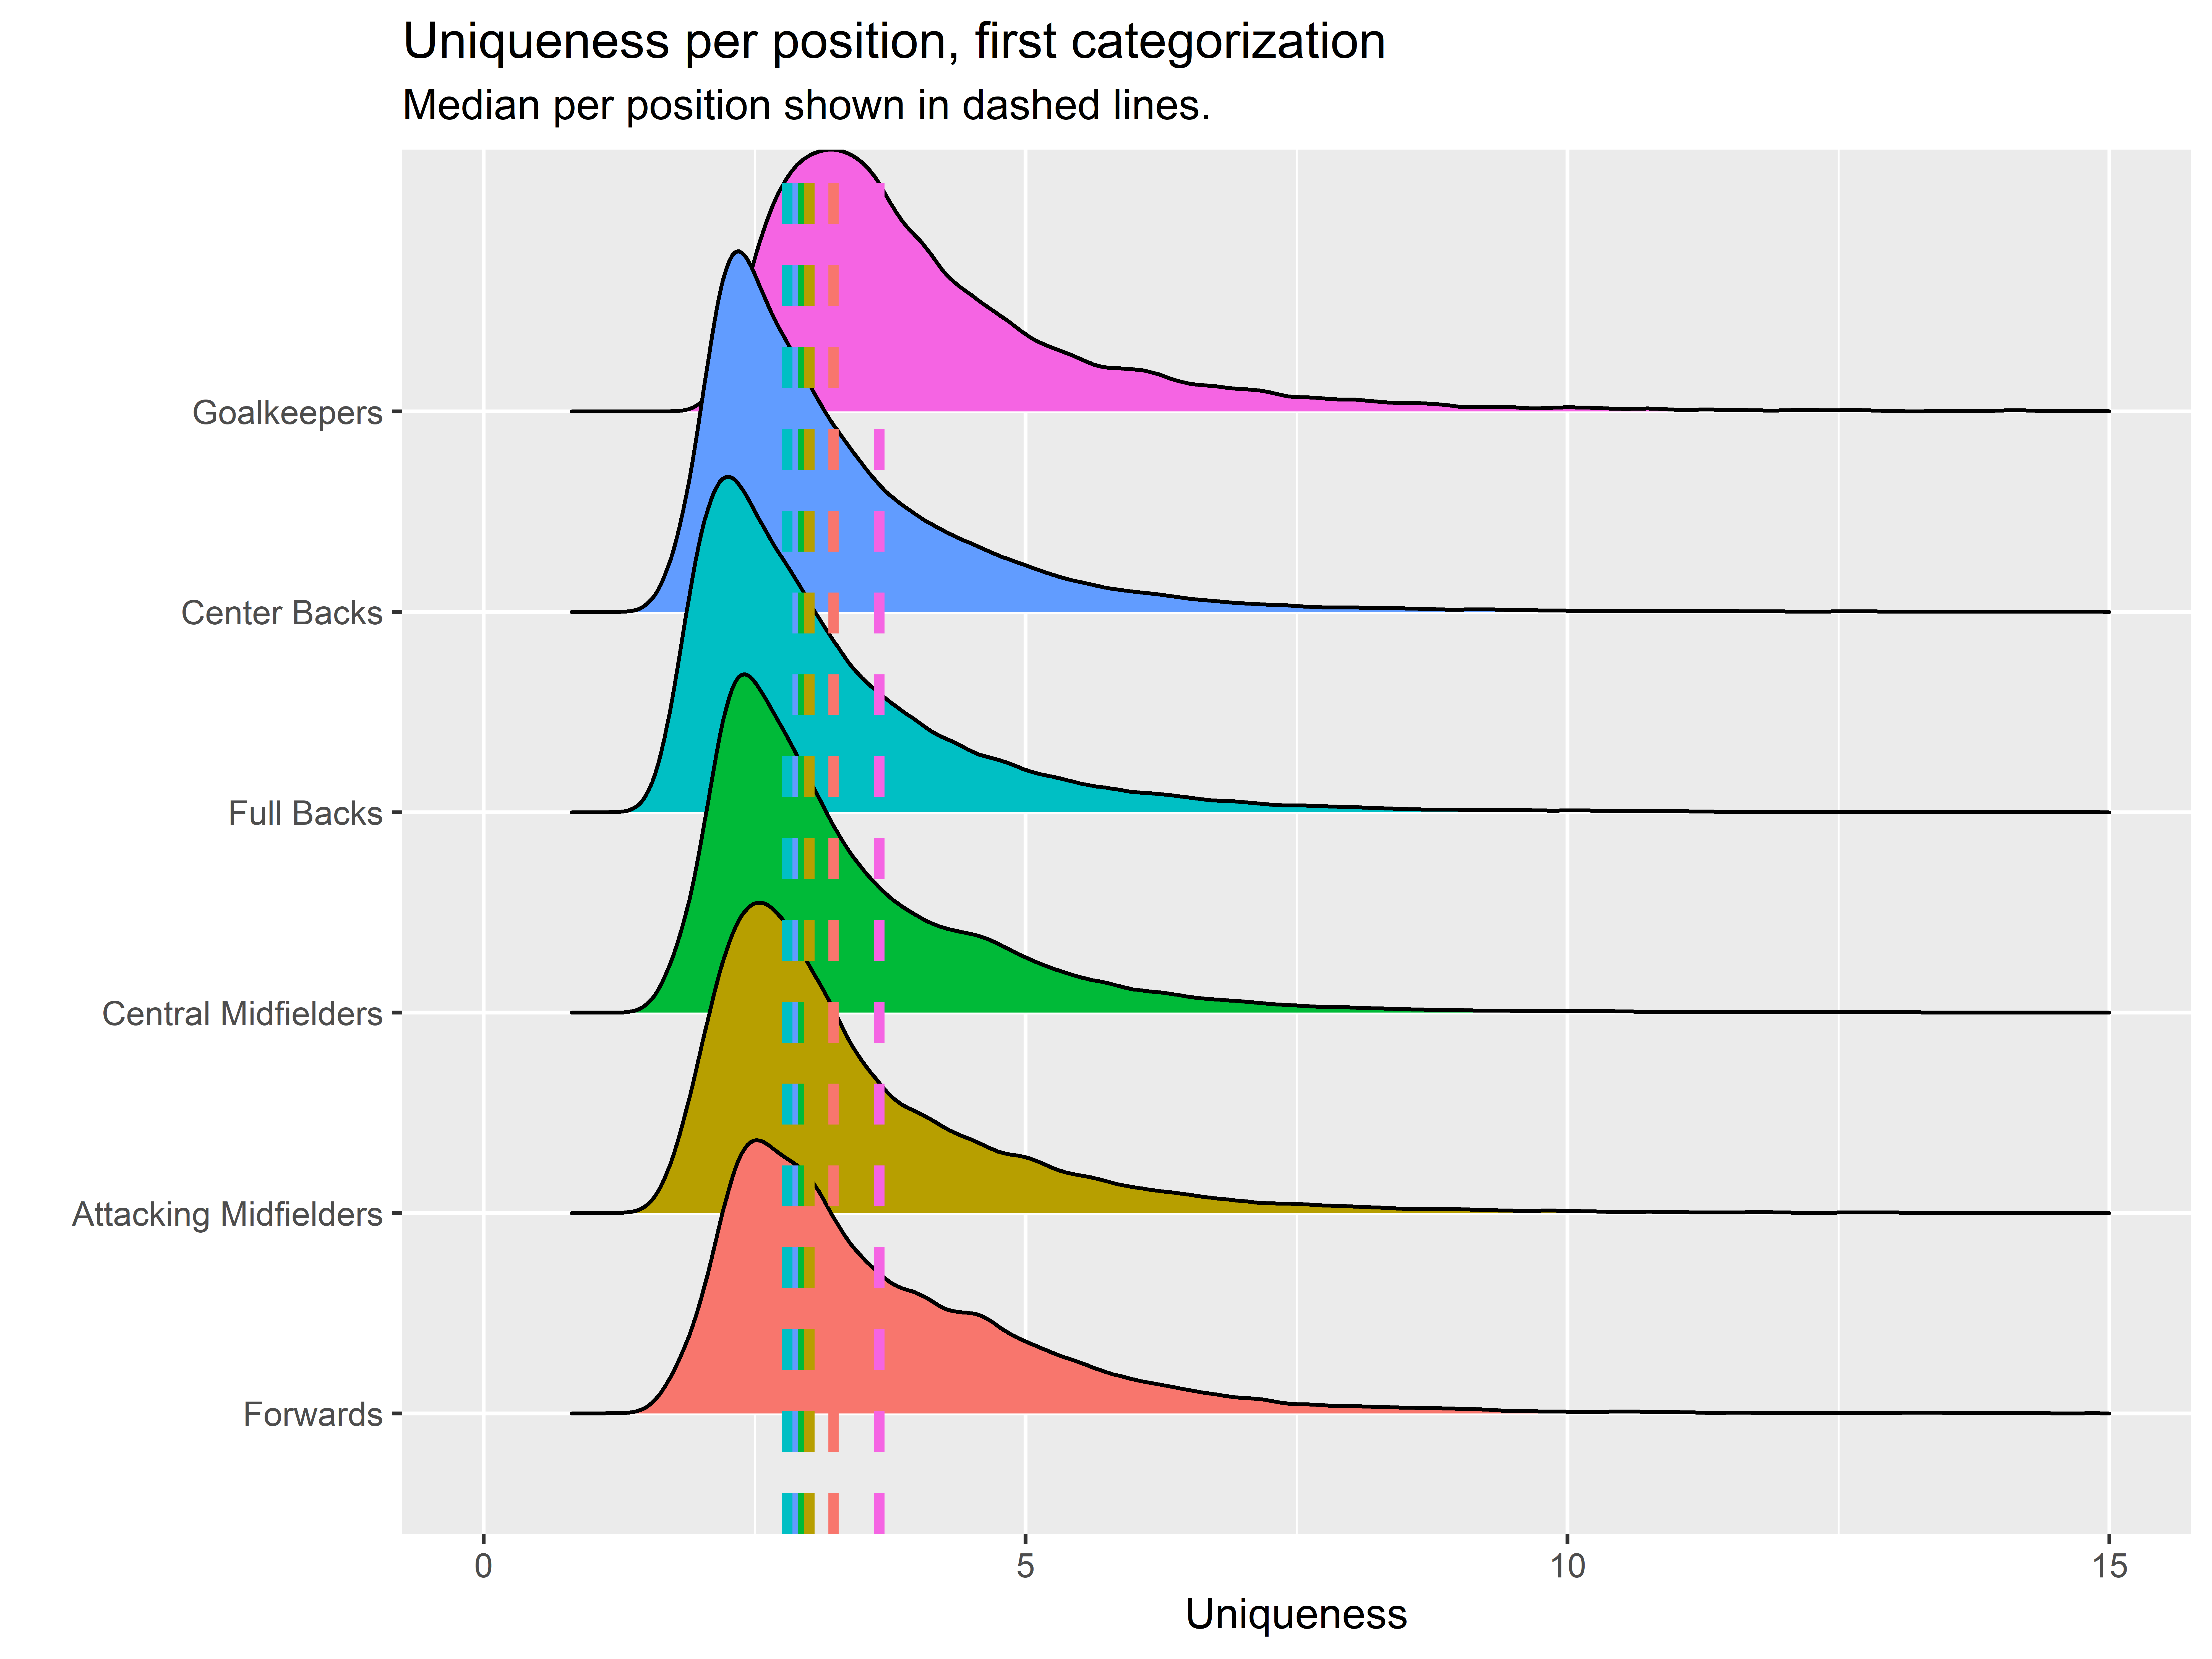
The density plot above proves a very interesting point and also highlights a potentially limiting factor of this metric. Goalkeepers are the most “unique” passers in the game! Much as I’d like to shout out my beloved and under-appreciated position, unfortunately, that just can’t be the case. If goalkeepers were the most unique passers in the game they wouldn’t be playing in net.
What we are actually seeing here is a flaw in the KNN search, because goalkeepers physically pass less frequently than their counterparts in the field, their passes have less similar matches in the KNN search and therefore garner higher “uniqueness” values despite their passes probably being insignificant. The next most unique position category are forwards. These two groups being more unique passers than others actually makes sense. They are making passes in places where the fewest passes exist, and therefore are the least common passes in the game. Recalling this potential positional bias, we will continue to make comparisons inside of position categories.
Let’s see what some “unique” passes look like for each position. Recalling the importance of the duration variable in the uniqueness value, we filter out all passes with a duration greater than 2.5 seconds; these passes are likely long balls out of the back, which for convenience we’ll lump together for now.
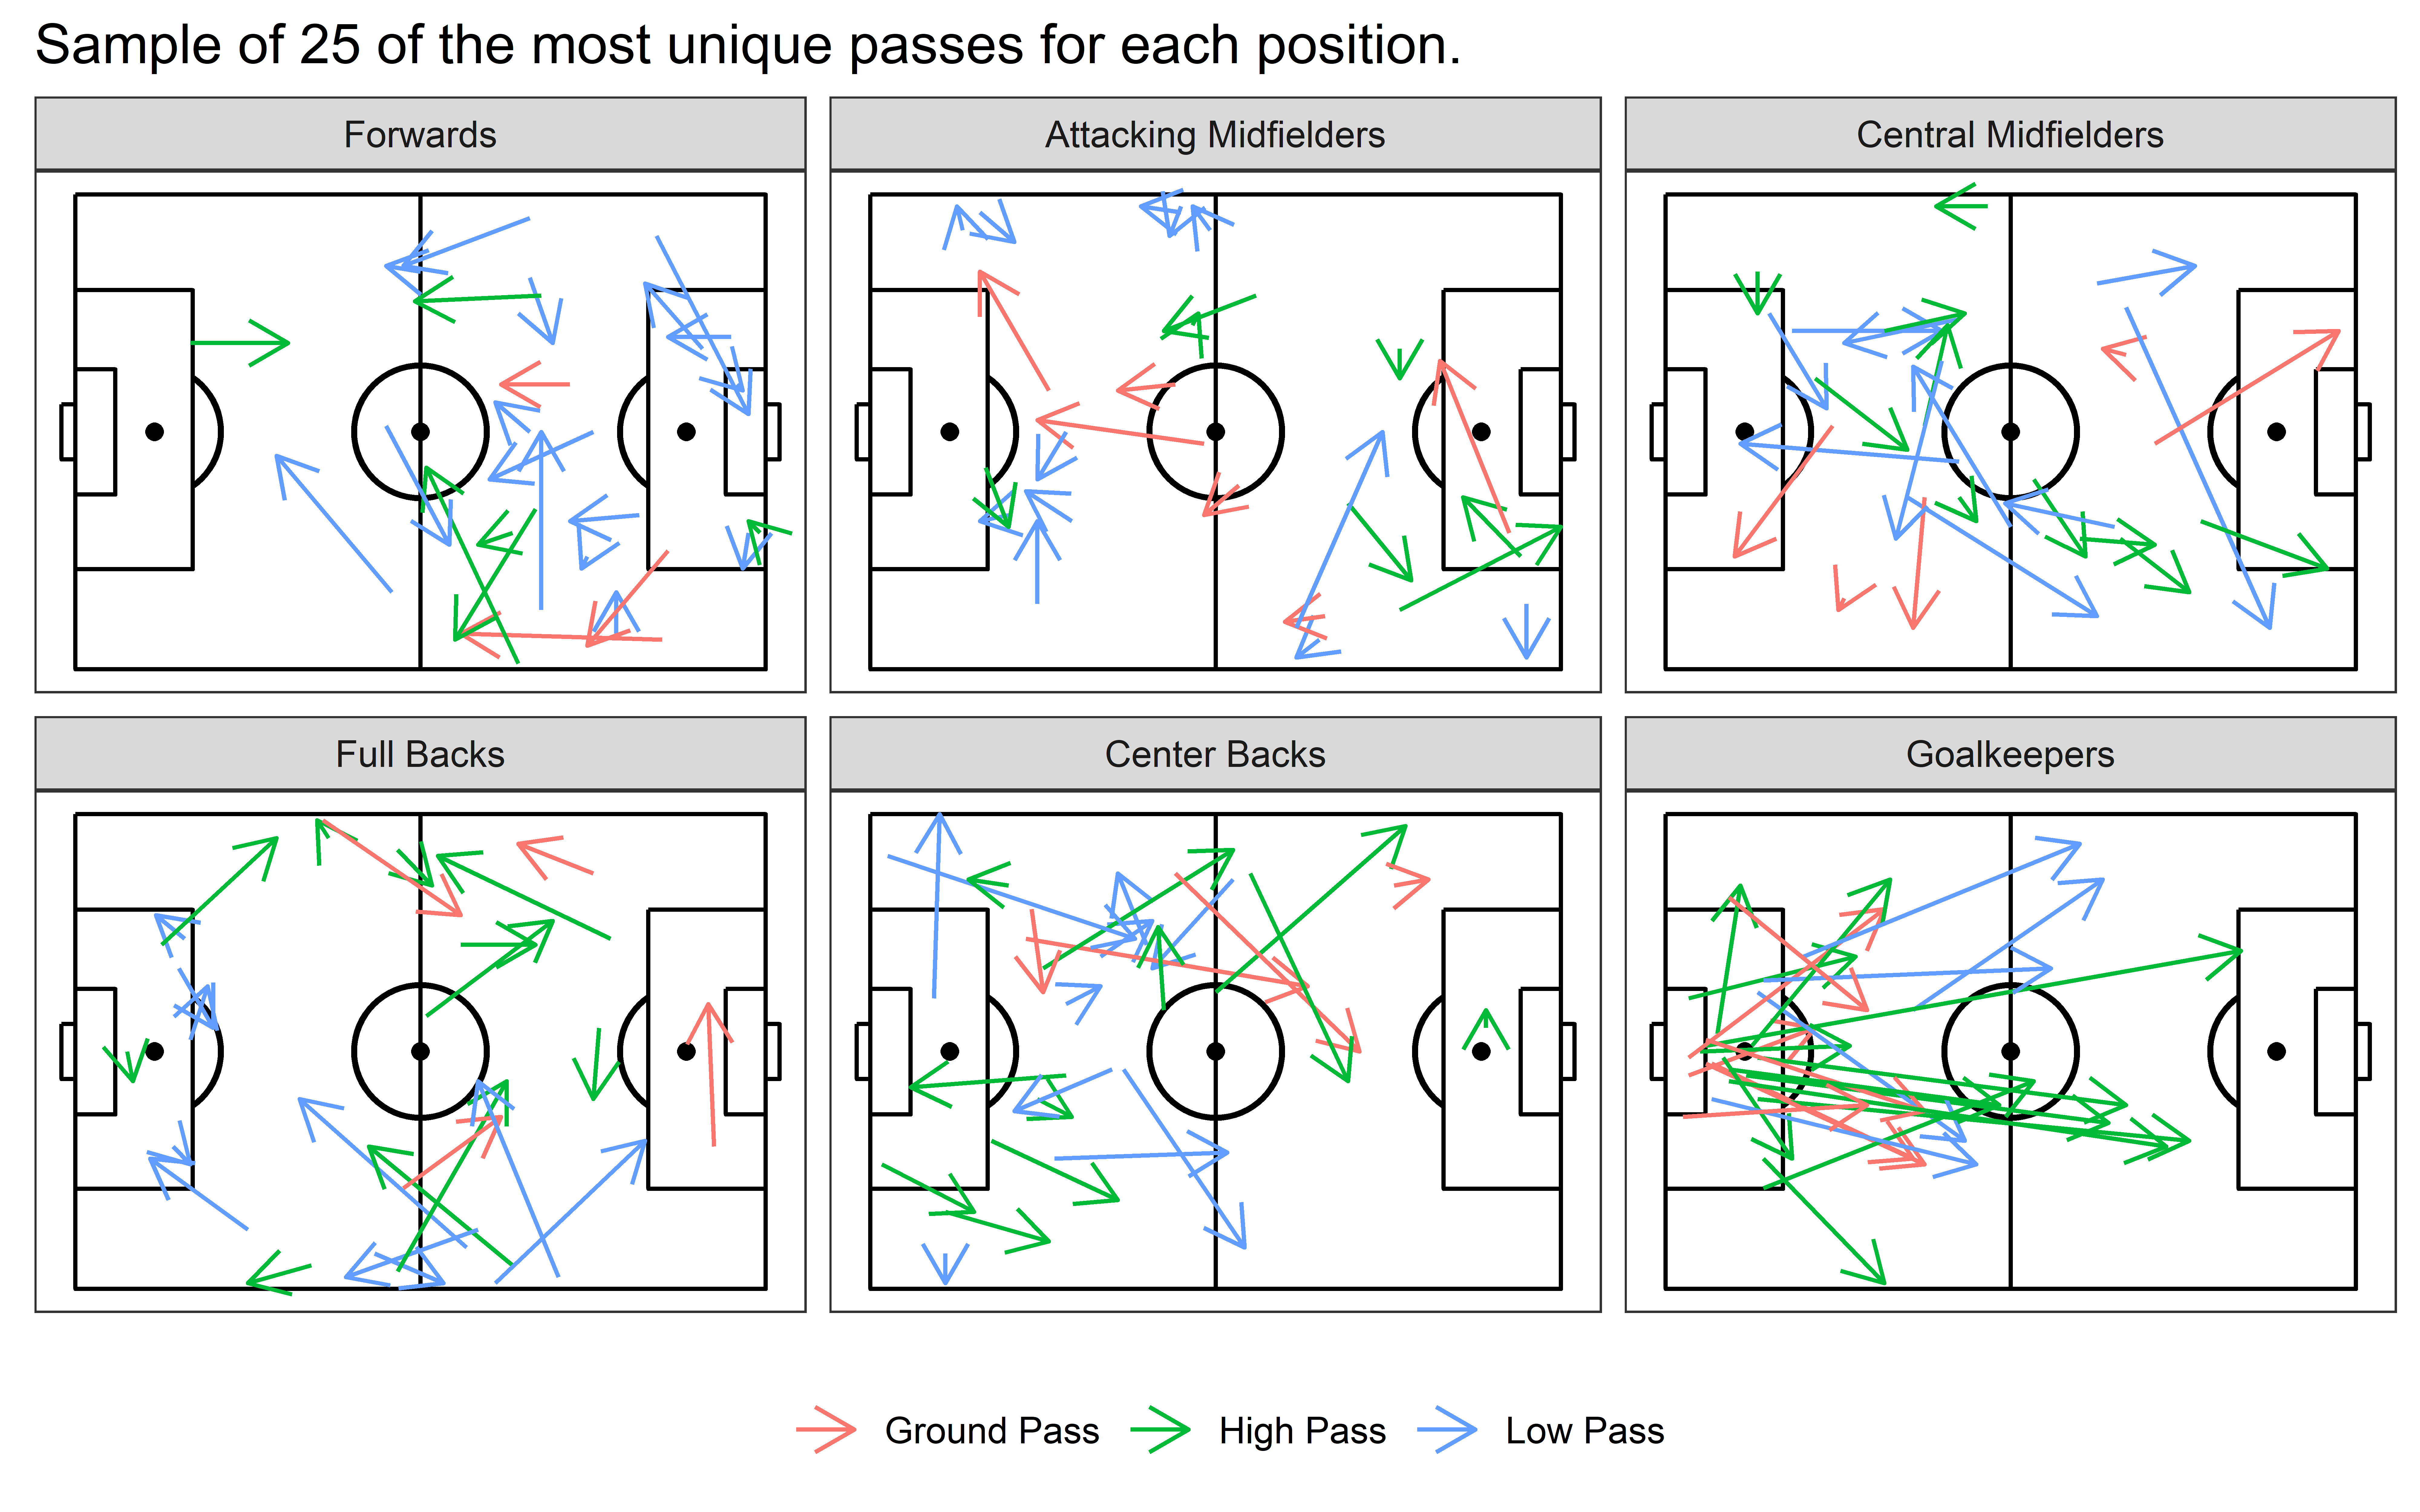
At this point, I hope the metric is starting to make sense. Our most unique passes are short passes high in the air or high passes into strange areas on tight angles, long ground passses whipping across the pitch and low driven passes on interesting angles. I’m starting to feel pretty comfortable with the effectiveness of the metric, so let’s get deeper into what this metric could do.
Everyone’s first inquiry is; who are the most unique passers? You must proceed with caution when investigating this, if we simply ranked players based on their median uniqueness or some other quantile we would make heavy passers suffer more than occasional, possibly, frantic passers. Instead, we rank passers based on the count of completed passes that were more unique than the 90th percentile of passes per 90 minutes played (this is also how players were ranked players in the original uniqueness framework).
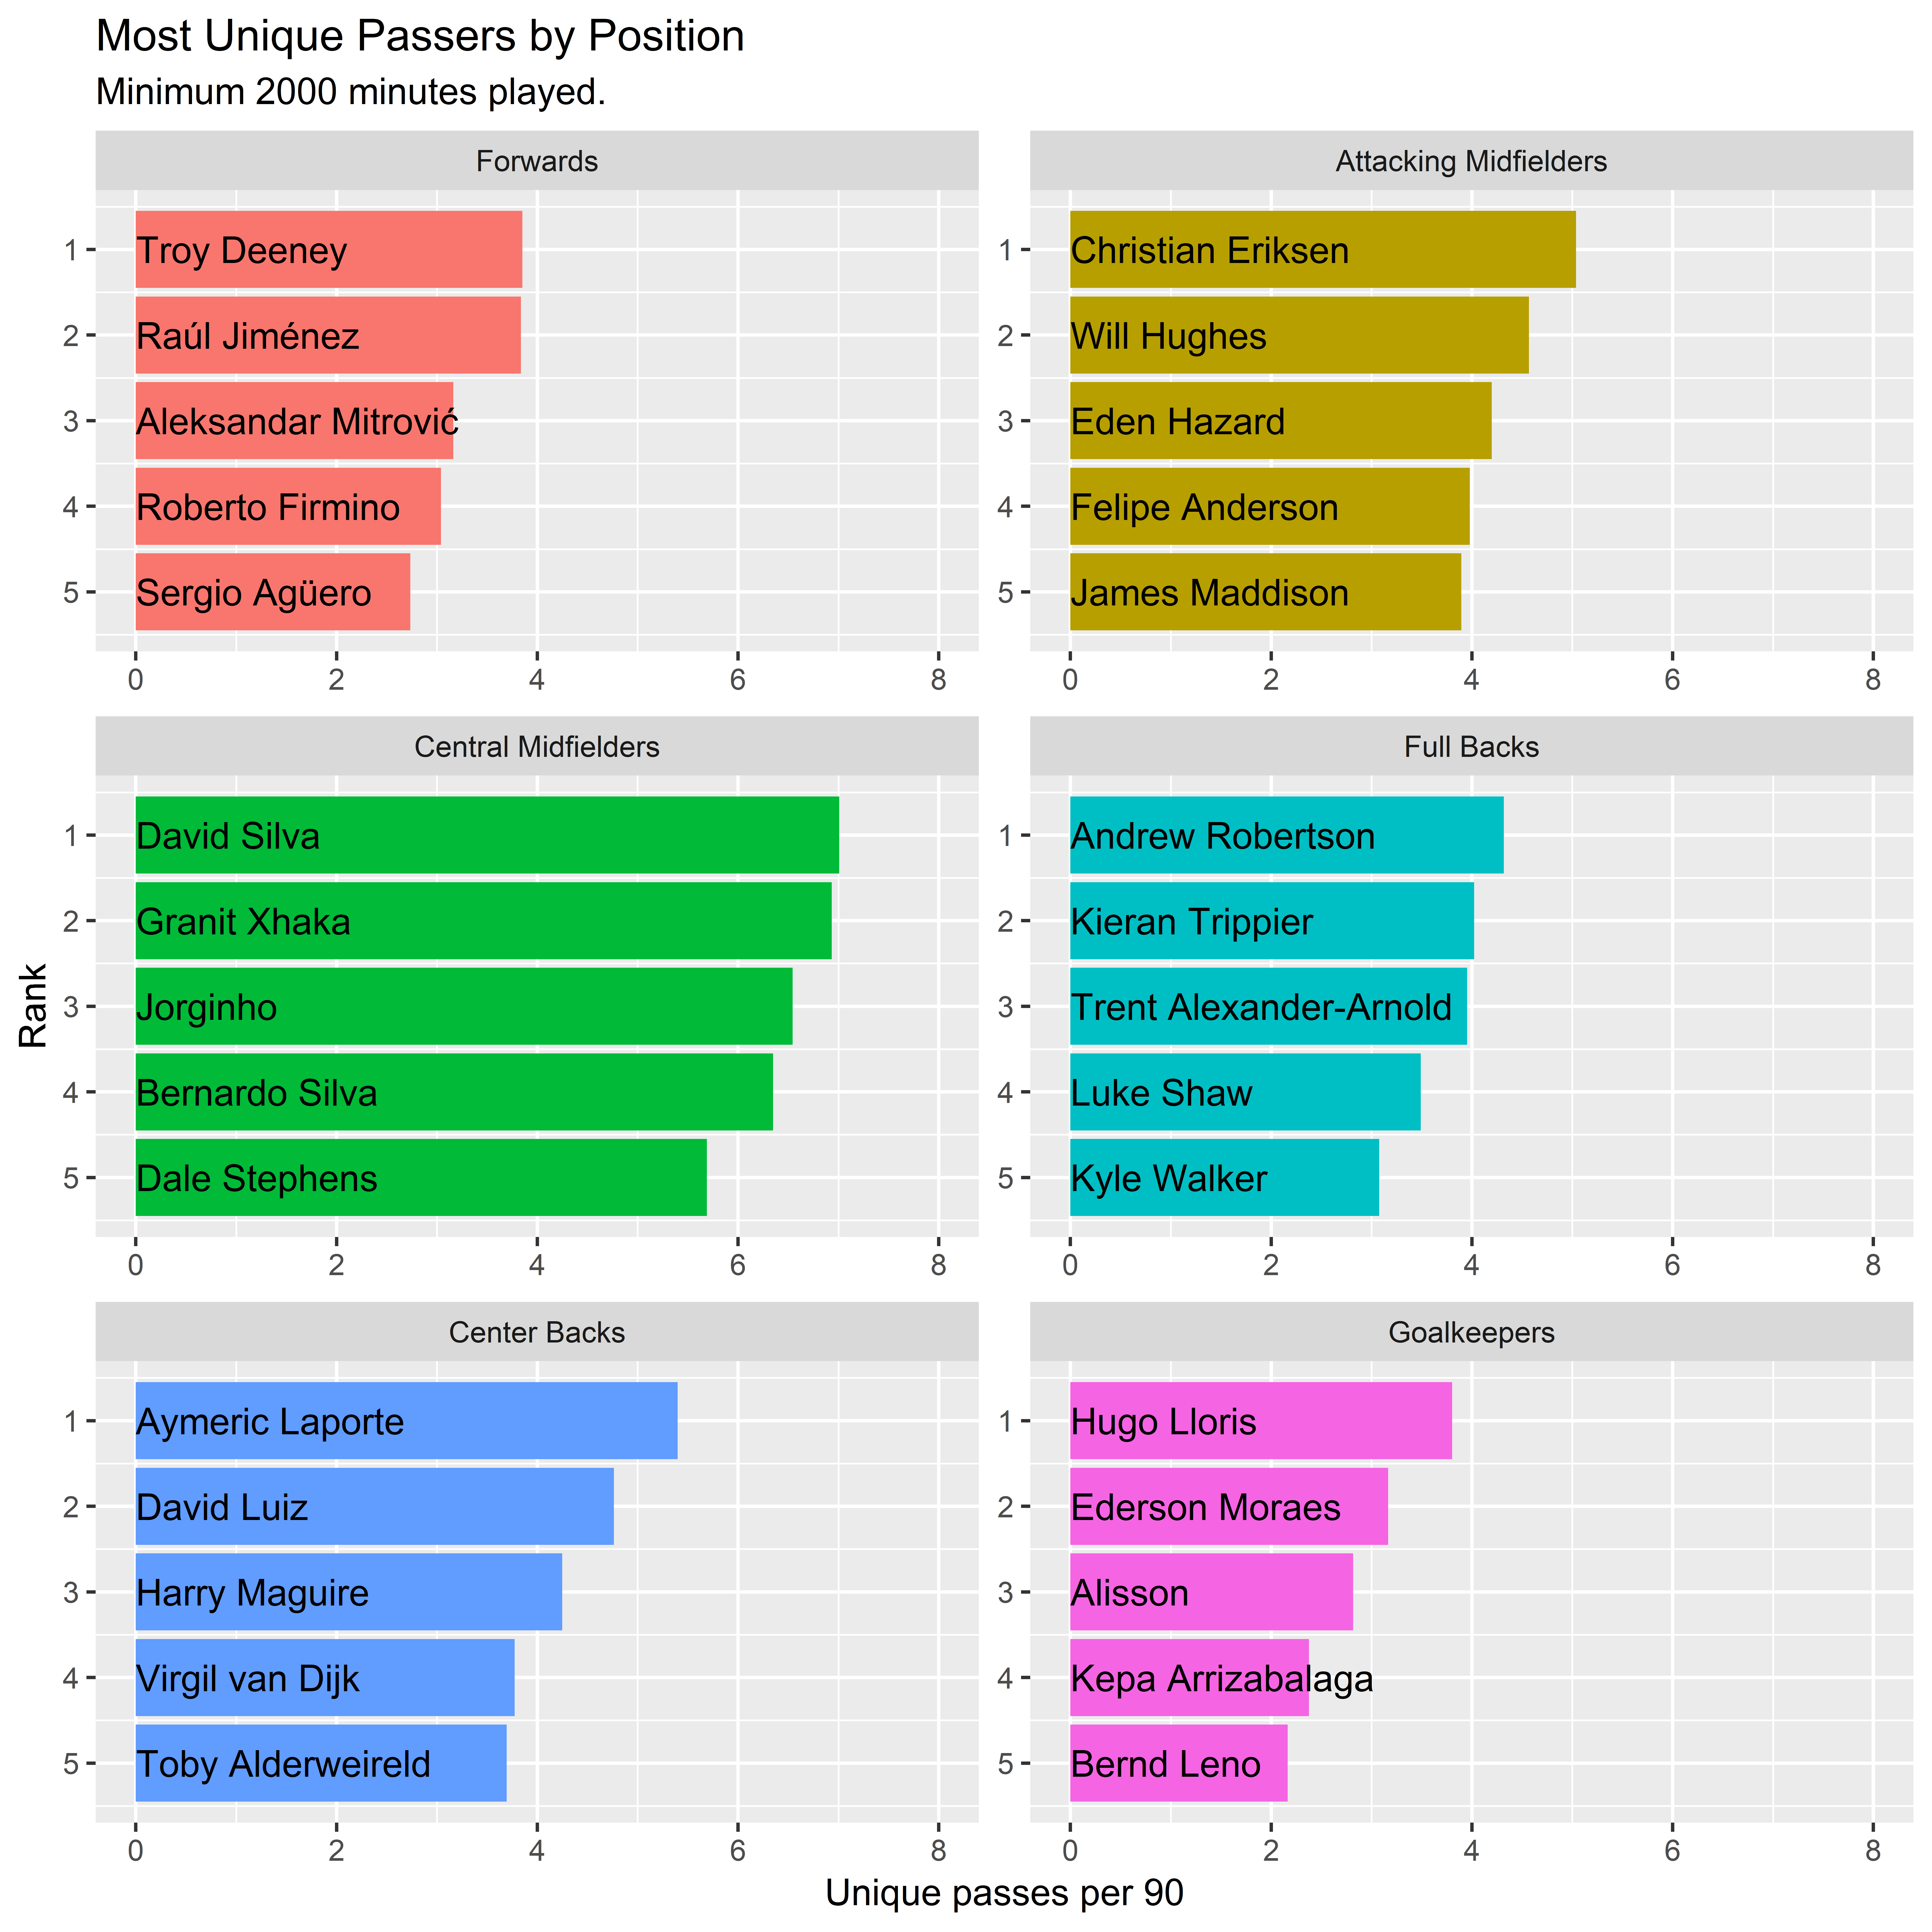
The results passed the ever-rigorous eye test from our analysis department. Although that may seem like a piece of cake to the average reader, let me assure you it is not too easy to sneak names by Euan,James and the crew. Nonetheless, we’re still left with a few questions. How are these player’s more unique? And, why does that matter? To answer the first question, we can look at an example match for our most unique passer in the EPL this season, David Silva.
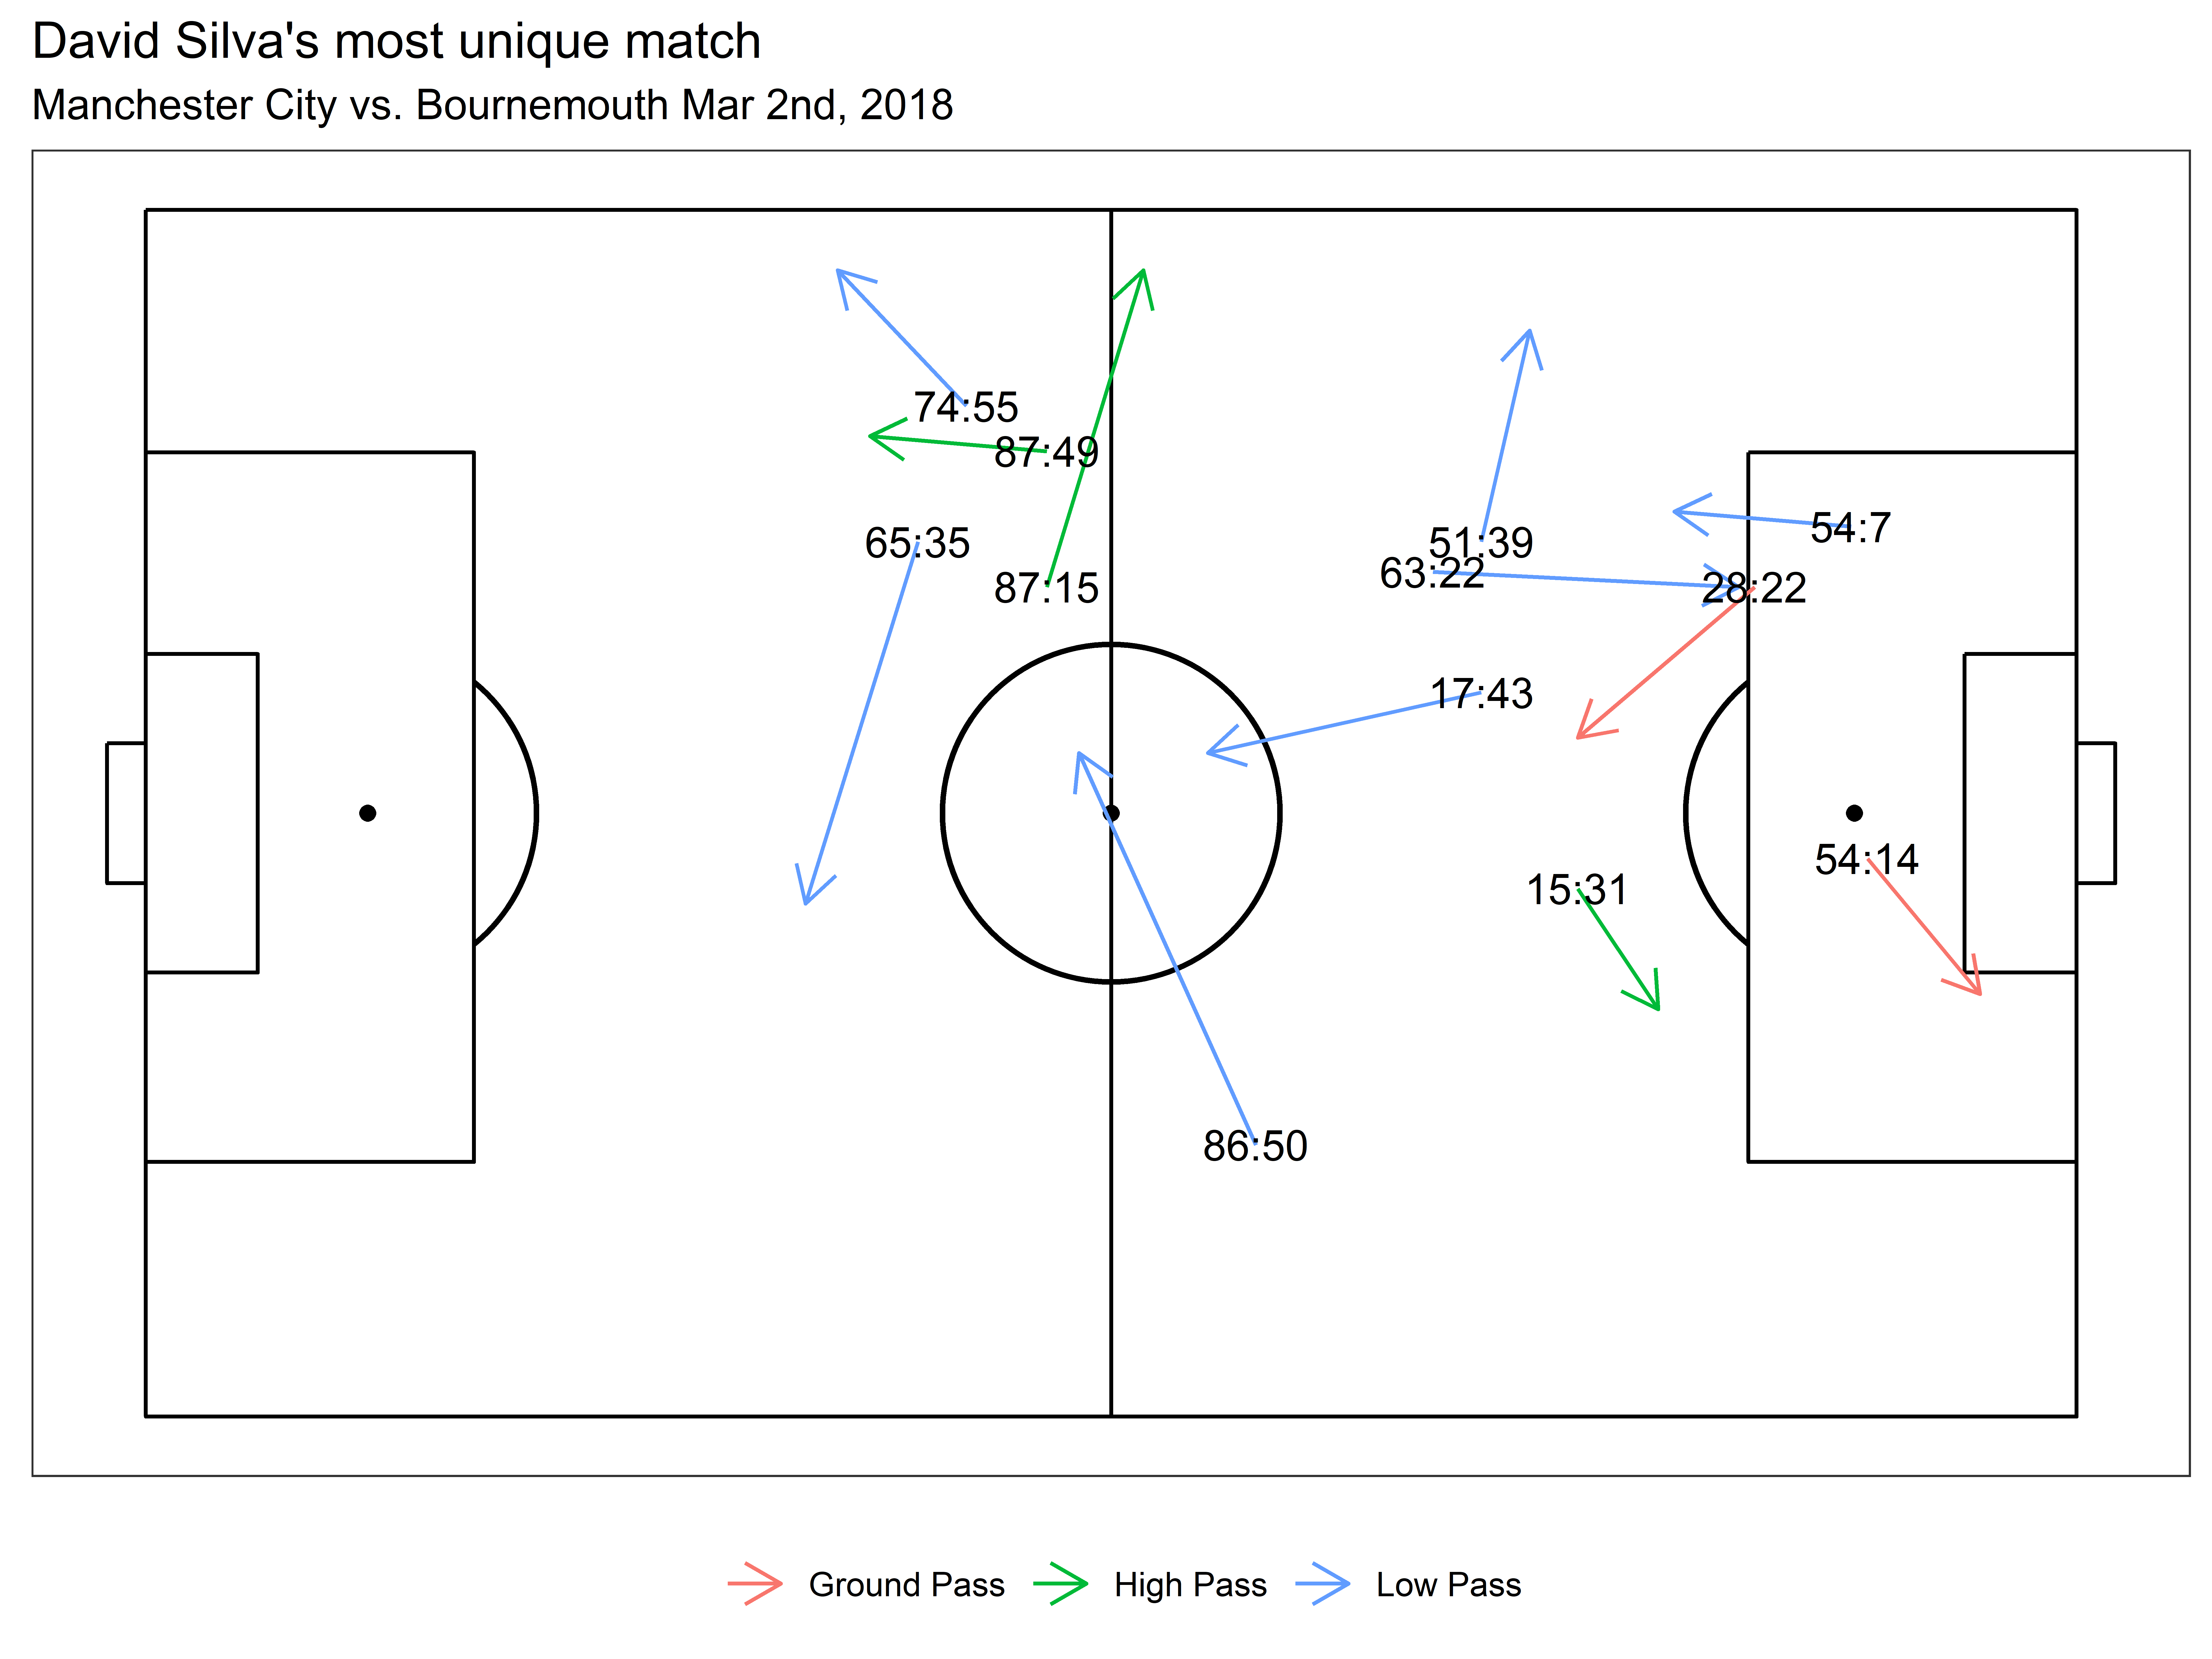
In the plot above, we match these passes to the video and see why they are so unique. As you can, see the passes aren't anybody's definition of great, but they certainly stand out as unusual.
We then of course have to answer the next question why is this important? And the reason is simple, the uniqueness metric extends easily into other areas of research. Are some players more creative than others? Well, yes. Can we find out which ones? Yes, we just did that. Can we see which of these unique passes made the attack more dangerous? Not yet, maybe soon, but not now. Can we use the uniqueness to predict completion probability? I thought you’d never ask.
Pass completion probability is our next application. Starting simply, is the effect of pass uniqueness related to the probability a pass is complete? This extension was proposed in the original framework, but lacked the sample size to really test it. I am lucky enough to have plenty of data at my finger tips. Using only the pass uniqueness to predict the probability of a pass is completed we constructed a simple logistic regression model. Given the assumed non-linearity of the pass uniqueness metric, we fit the model using a natural spline with 5 degrees of freedom.

The relationship between uniqueness and pass completion is pretty clear. For very common passes, there is a quadratic relationship with pass completion probability, reaching a peak completion probability of 90+% around a uniqueness of 2.4 or the lower 25th quantile of uniqueness and then there is a sharp decline in completion probability until a uniqueness of 3.5 (70th quantile of uniqueness) where the passing percentage continues to decline as uniqueness increases albeit less drastically. Intuitively, the more common the pass is the more likely it will be completed, and the more unique it is, the less likely it will be completed.
We checked the accuracy of the model using an ROC curve and found favorable results.
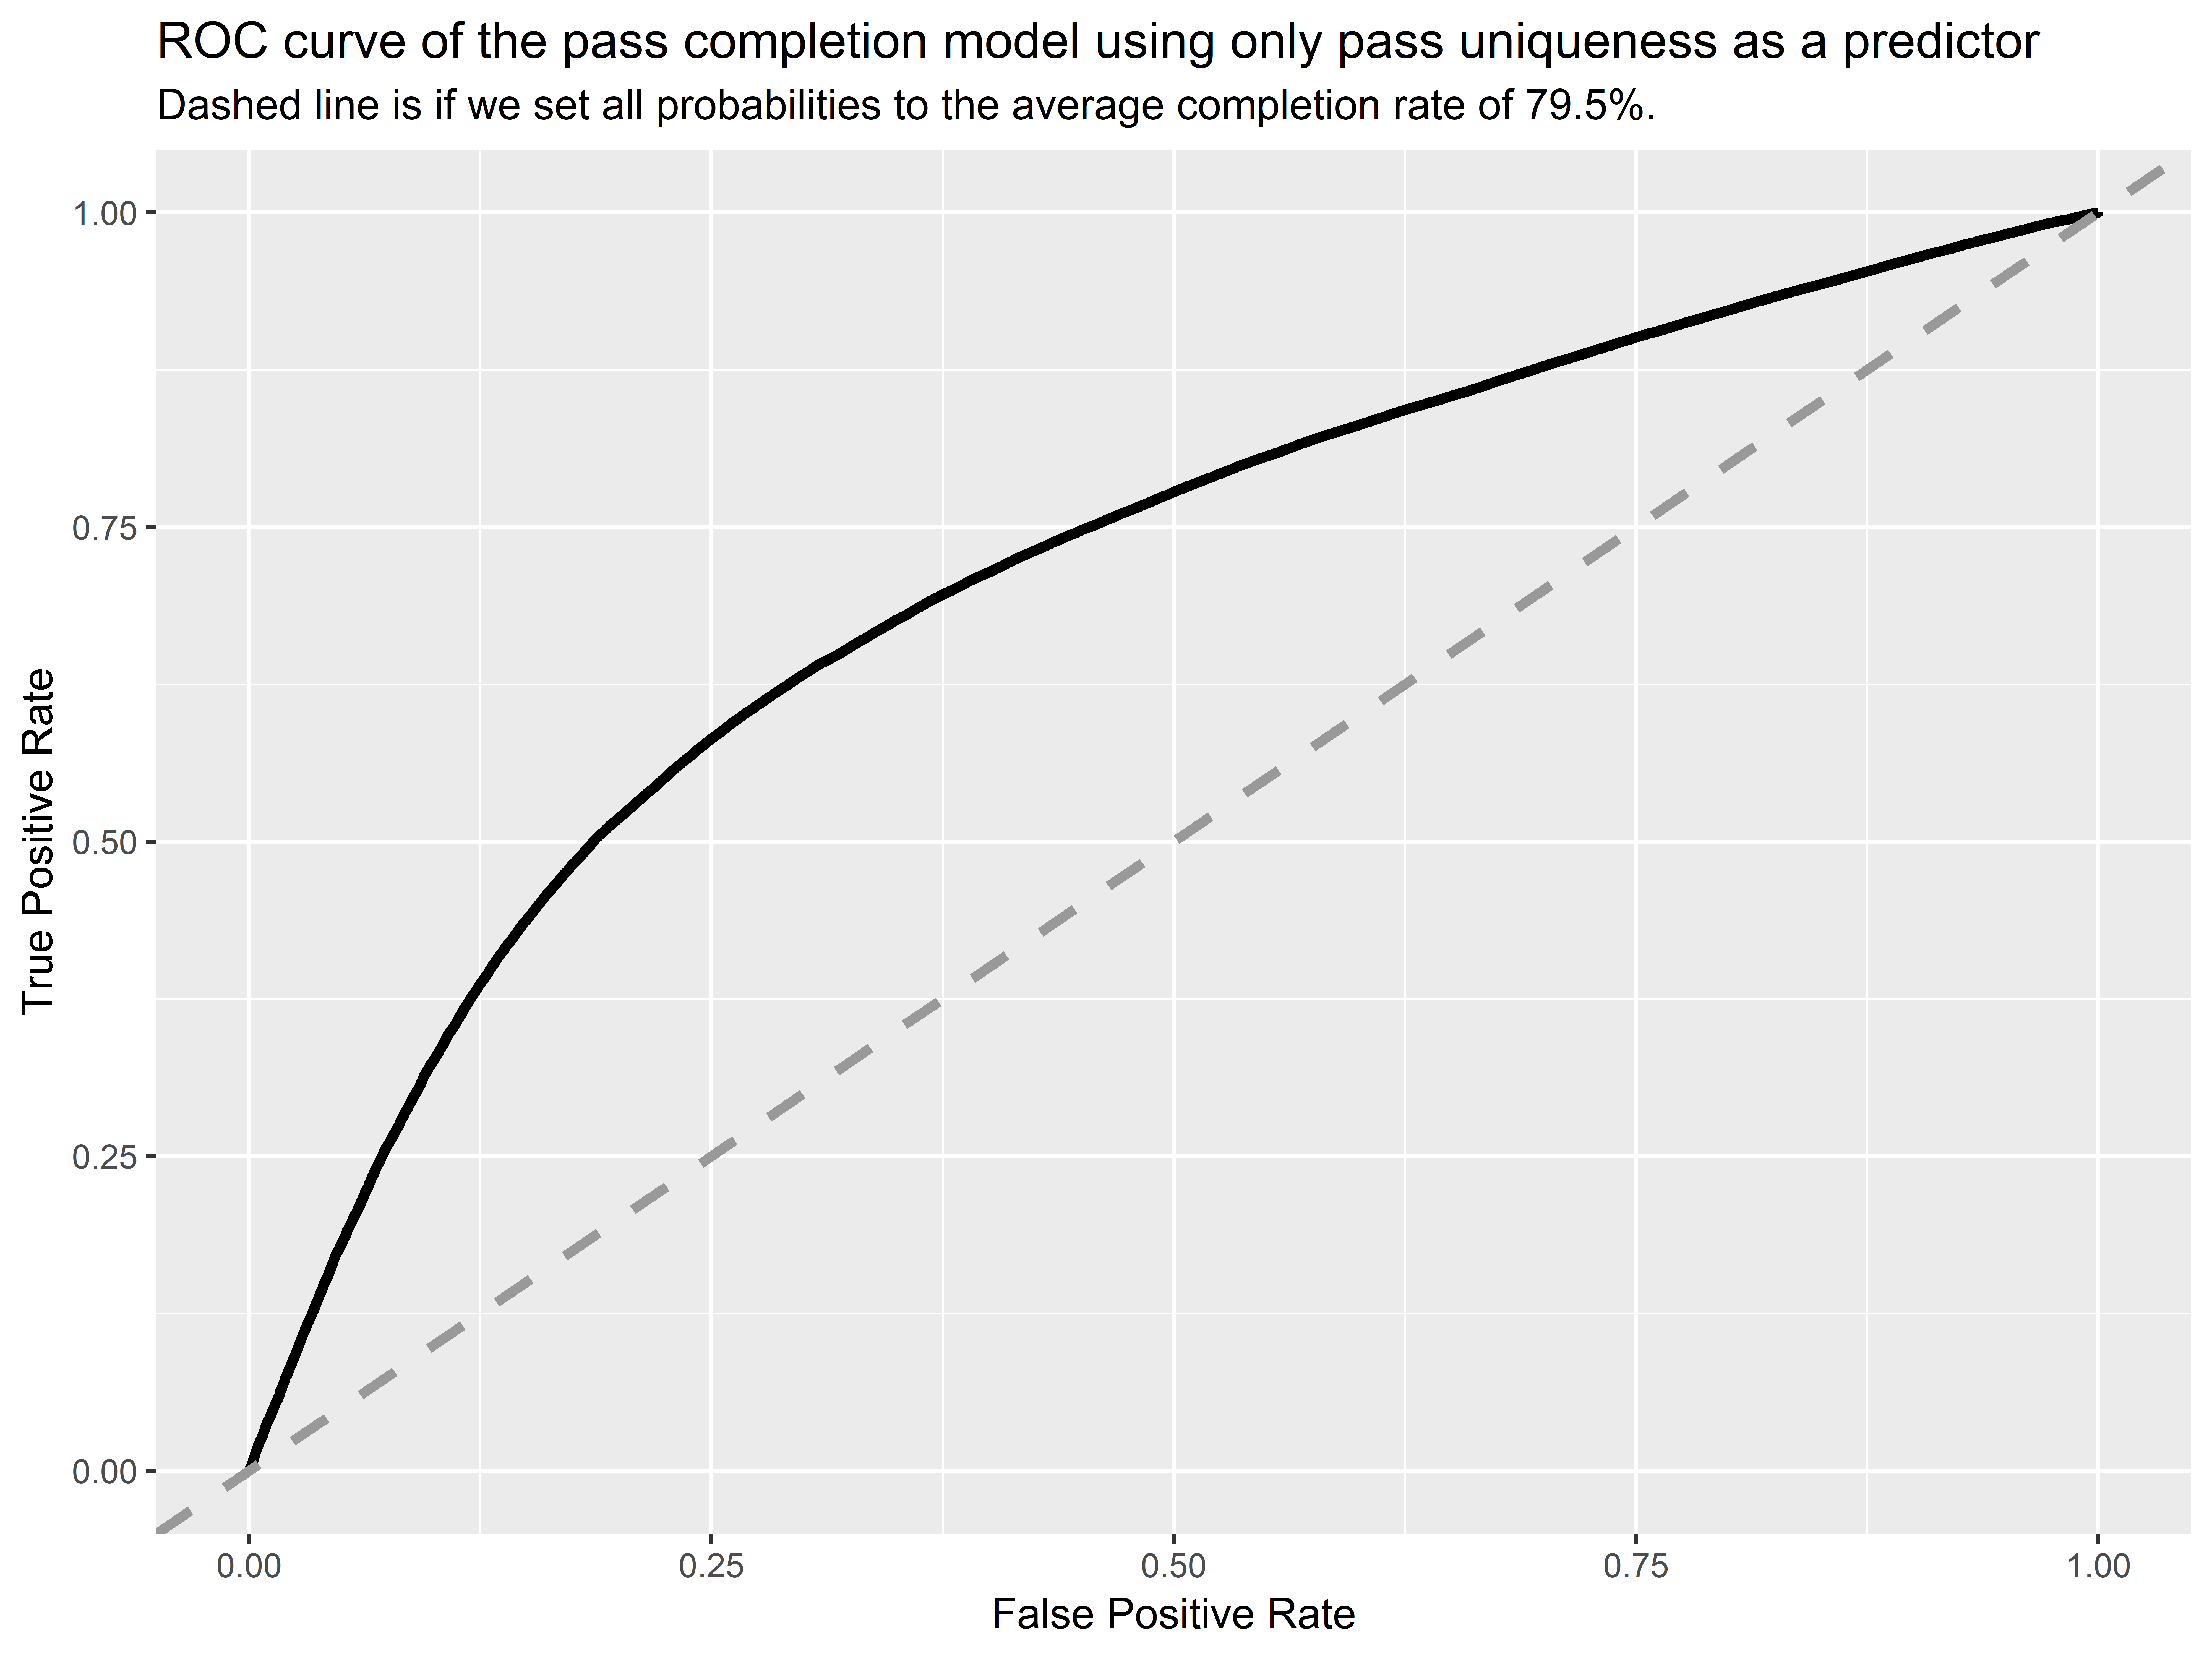
The model is performing better than assigning the average completion rate to every pass, but there is definitely room for improvement. The area under the curve is 0.71 which is far greater than no model at 0.5 but also a ways away from a perfect model at 1.0. In a follow up post, we will work through a more comprehensive pass difficulty model.
The extensions of this metric are endless and we are excited to dive into them further. For starters, the uniqueness metric is already summarizing some pretty complex relationships between pass characteristics and pass difficulty. It’s already teasing out passers who regularly defy football norms for better or for worse. This leads us to our greatest challenge, extracting unique and positively contributing passes that don’t just move the ball forward but improve build up play for the entire possession, not only the immediate reward. We’ll catch up with you soon with our next passing article in this series.
Header image courtesy of the Press Association
