StatsBomb launched the 360 dataset in 2021. Put simply, StatsBomb 360 allows the end-user to identify the locations of all players surrounding a given event, within the scope of the broadcast camera. You could call it “events plus” - the amenability of an event data set (~3000 events per game) with the potential scope of tracking data.
This allowed us to focus on the action and consider the types of metrics that could be drawn from the data when the event becomes a focal point surrounded by a bigger picture of contextual information than in typical event data.
One of the benefits of working for the premium multi-sport data company in the world is you get to access the work of an extremely talented data science team. One of the benefits of being a customer of the premium multi-sport data company in the world is you also get access to that same work.
On this site, Will Thomson recently approached the topic of ball progression through the lens of On-Ball Value (henceforth OBV) and discussed how combining general information and model outputs could improve on an either/or approach.
I was curious to see if I could blend a combination of models created by the data science team to understand, categorise and then visualise a concept that doesn’t naturally drop out of an event data set - but can be created via 360 - Line-Breaking Passes. The concept is fairly straightforward and calculation is defined below, but football is consistently interested in players that break lines through either passing or ball carrying.
The 360 dataset allows us to upgrade prior insight beyond simply understanding the location and direction of all on ball events by also adding the defensive context they exist within, a feature we previously brought to football event data for shots when launching StatsBomb's original dataset in 2018. In a neat interplay, OBV consistently grades Line-Breaking Passes as more valuable than their non-Line Breaking counterparts. My challenge from there was to create a visualisation that gets into aggregation with a view to adding a further layer to understanding to player or team styles.
Method:
Open Play passes only
Line-Breaking Passes:
Devised using a rules-based approach from the 360 dataset, put simply:
- The end location of the pass should be greater than or equal to 10% closer to goal than the starting location, and
- The pass should intersect a pair of defenders who are within close proximity (x-axis) or pass behind the line of the defenders (y-axis)
Pass Clustering:
We have a model that clusters passes into groups. It is currently devised on event data and segments passes into 60 categories, often mirrored. I was interested in those that correlate most closely with the Line-Breaking Passes, and therefore recategorised into nine common types, homogenizing the left/right mirroring. This is a choice but hopefully allows a focus on pass type over the specific location.
On-Ball Value (OBV):
How can we value these passes? Good question. Mercifully, in 2021 the data science team devised a model to value all on-ball events, which we can patch into this analysis.
This is a predominantly visual analysis, so let’s get you familiar with the key. Exciting I know, but paramount to understanding what you’re looking at:
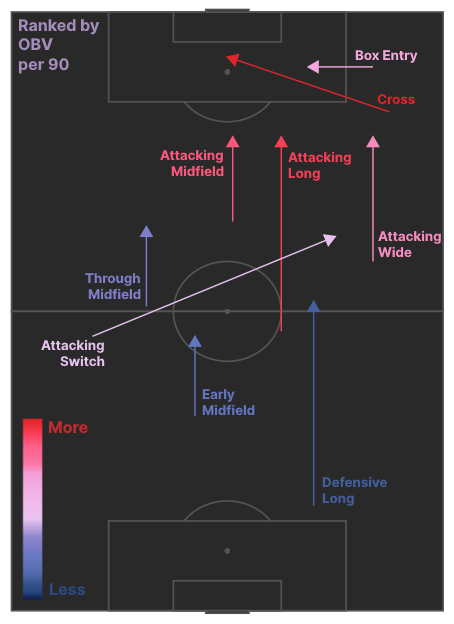
Here are nine categories, loosely defined to give an idea of the types of pass we’re considering and colour-coded to indicate the average value on a per completed pass basis. There are other places in which lines are broken, but when it comes to value certain truths persist, and completing passes and breaking lines higher up the pitch remains where much of the action is.
Now if we catalogued everyone’s contribution to nine categories, we’d end up with a bunch of identical charts and very little insight, so to identify differences, we can highlight the predominant categories for each player (similar analysis could be conducted for teams both for and against but is outside the scope of this article).
Central Midfielders:
Let’s first take a look at players categorised as central midfielders. Positional categorisation will always be contentious and arguable, so we’ve used StatsBomb’s defined “primary position”. These charts are also ranked by OBV created from Line-Breaking Passes, per 90 minutes played, and remember left/right isn’t the focus here, we’re looking at types of pass:
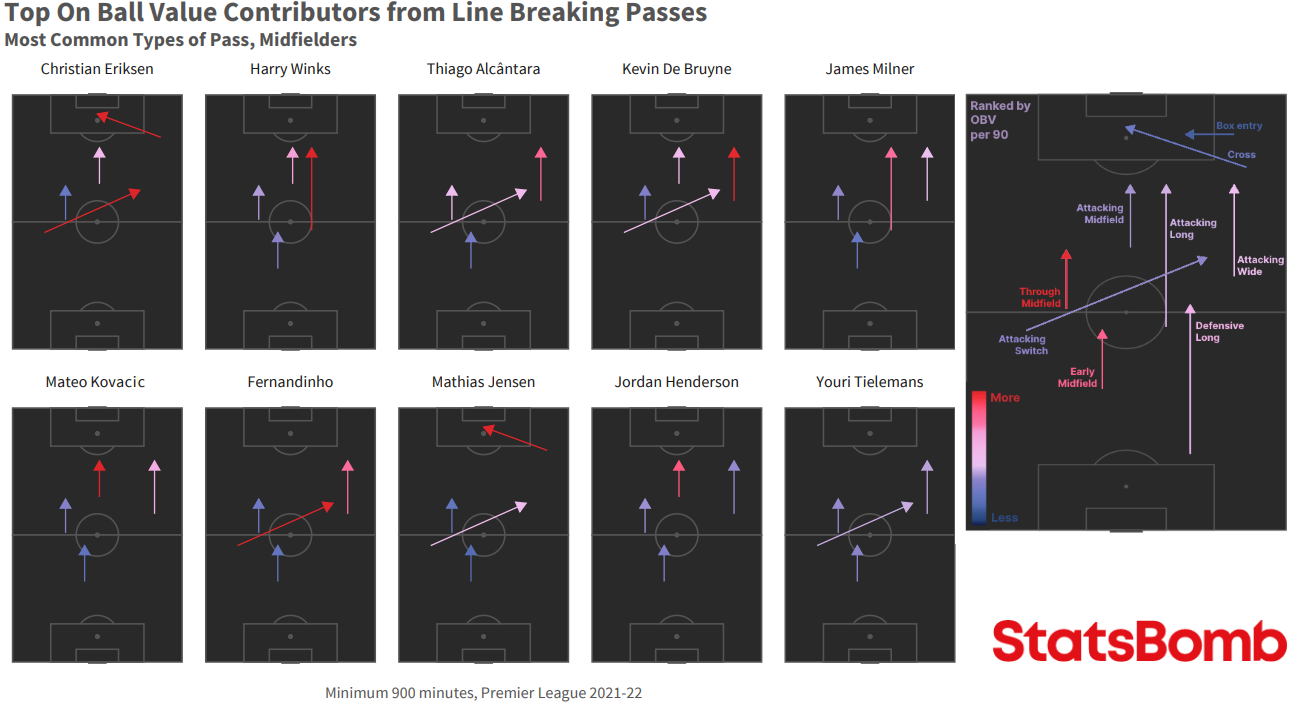
There’s a story here about minutes cut-offs. Christian Eriksen’s profile is extremely interesting: he’s contributed significant OBV and broken lines via crossing, in the sweet spot of the attacking midfield zone and via attacking switches. He looks like nobody else in this category.
By drawing the minutes line here we also get other smaller contributors like Harry Winks, James Milner and Fernandinho. In particular the latter two showed they could contribute on ball despite aging legs. Winks is curious too, as early days Antonio Conte it was clear that he was following instructions and looking to pass decisively and forwards, as borne out here. As January came and went, Rodrigo Bentancur arrived, Winks’ minutes receded and the thought remains that it’s not what he can do on ball but what he does without it that likely reduced his favour in his new manager’s eyes.
Thiago played a mid-volume of minutes (~1600) and patrolled central zones in all directions, Kevin De Bruyne played a deal more and did similar but was more decisive higher up the pitch. It’s also fun to see types of player emerge: Mateo Kovacic and Jordan Henderson match patterns, Fernandinho and Youri Tielemans too.
We’re just looking at the Premier League here, but we can envisage how our lens could extend out across multiple leagues - StatsBomb 360 covers 38 leagues at this point - so understanding the player types that exist within such leagues is limited only by the analyst’s imagination.
Full Backs:
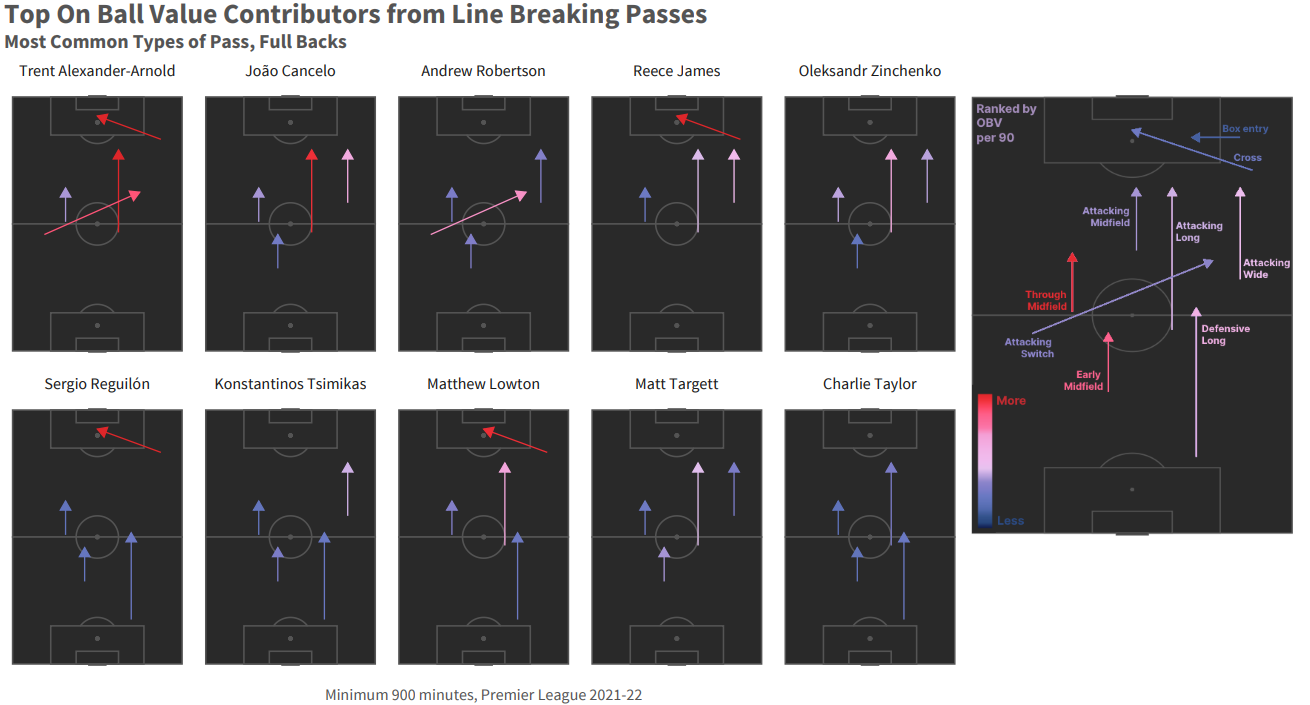
No surprise to see Liverpool well represented, Trent Alexander-Arnold in particular contributing a range of longer passing into the attack. That he and Andrew Robertson are the only two full backs to be flagged in the “attacking switch” category is fun too, showing room for Robertson’s understudy Konstantinos Tsimikas to build into.
Reece James is unsurprisingly effective high up the pitch while exactly how much ball progression was entrusted to Burnley’s full backs is exemplified by both Matthew Lowton and Charlie Taylor ranking well, while their team style is shown as both “long” categories feature for both players.
It doesn’t take much to envisage Sergio Reguilón exchanging passes in his own half then bombing on deep into opposition territory to receive and fire across a ball into the box, and his chart speaks to that. Lastly, I’ve often felt that under “left back” in the dictionary would be a picture of Matt Targett, so interesting to see his profile effectively matching with that of the two Manchester City full backs in this list, João Cancelo and Oleksandr Zinchenko. For them, often touted as potential midfielders, their passing profiles offer significant backing.
Attackers:
Lastly, let’s look at attackers. It was going to be just attacking midfielders and wingers and I'd have had to defend categorizing Mohamed Salah, but on review, of the defined centre forwards, only Harry Kane was looking to trouble the judge and he ranked 11th - with a trademark flourish of “attacking switches” - so just missed out. Ergo, arguments here may surround why Martin Ødegaard fits here and not in the same category as De Bruyne to which I would reply he was listed as a “Central Attacking Midfielder” most often in 2021–22 while De Bruyne was a “Right Central Midfielder”. Positions, positions…
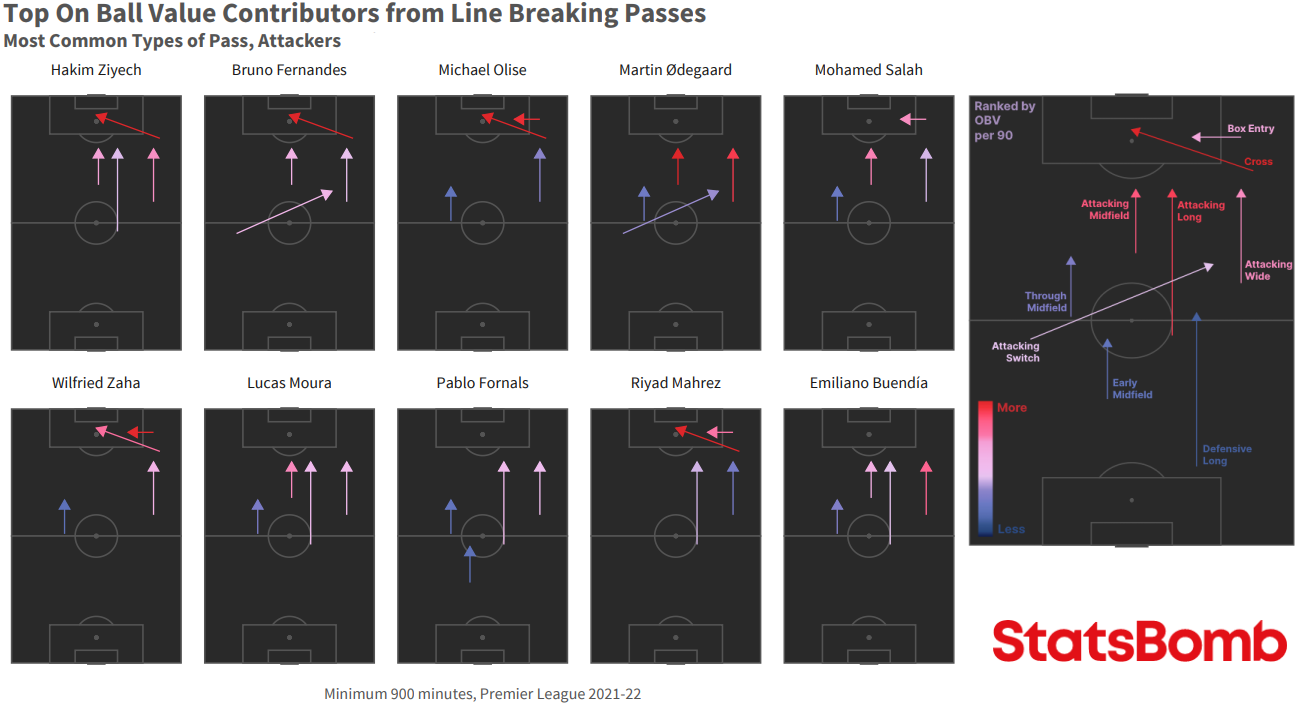
It’s notable that Hakim Ziyech, Bruno Fernandes and Lucas Moura all feature despite wider perception of lesser seasons in 2021-22. Potentially this is where team level analysis could bear fruit. Ziyech is ostensibly inhabiting similar categories to Reece James from the same side of the pitch; a clash? Fernandes is “Eriksening” his way around the place, but does he lack able support, or is he doing too much himself? Moura played sufficiently frequently to buy into the idea that his passing could have been a net plus but doesn’t get right up into the deepest zones, and has been labelled profligate with possession less for passing choices more through running with the ball. Remember we’re looking at a specific element of play, not the entire story.
That Wilfried Zaha and Michael Olise have matching profiles is neat too, given they started most frequently on opposite sides of Patrick Vieira’s Crystal Palace attack. Olise in particular is close to taking over from Callum Hudson-Odoi as the holder of the “Young Premier League Attacker Who Pops Lots of Metrics In Small Minutes” award.
And what of Salah? He’s the one bonafide goalscorer who is featuring prominently in a passers list. Even if he was colder in front of goal post-Christmas, he was still a serious contributor to Liverpool’s title challenge in other ways.
That about wraps up this piece; we could extend and look at centre-backs or goalkeepers while within-team or whole league team analysis are also further routes in, but for now, hopefully, it shone a clear light on the potential of combining models to build broader insights.
The StatsBomb team is working hard this summer to bring enhanced metrics like Line-Breaking Passes to StatsBomb 360 Data, while also looking to bring the work of our data science team into all our other soccer-related products: StatsBomb Data, StatsBomb IQ, StatsBomb Live Data and StatsBomb Live IQ. If you’re a customer, keep an eye out for further product announcements.
If the insight in this article is interesting to your club, media or gambling organisation, do reach out to sales@statsbomb.com.
Expect more articles in this vein soon.
