Innovation is part of StatsBomb's DNA. In 2018, we revolutionised the football data space with the launch of StatsBomb Data. Then, in 2021, we introduced StatsBomb 360, a unique product that includes a freeze frame that shows the position of all players in view for every event we collect.
Our habitual description of 360 has always been event data plus. It provides key additional information that allows us to further contextualise the standard event data and derive unique metrics that take this new information into account. We are now ready to introduce the first metrics that we have created from the 360 dataset:
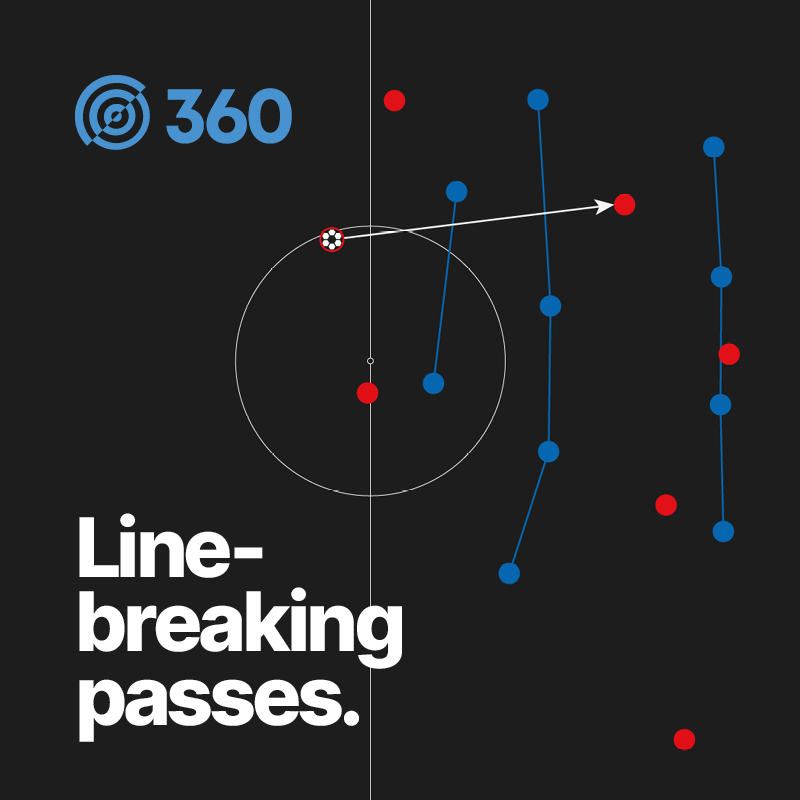
- Line-breaking passes: completed passes that advance the ball at least 10% closer to the opposition goal and that intersect a pair of defenders in close proximity (x-axis) or pass behind the defensive line (y-axis).
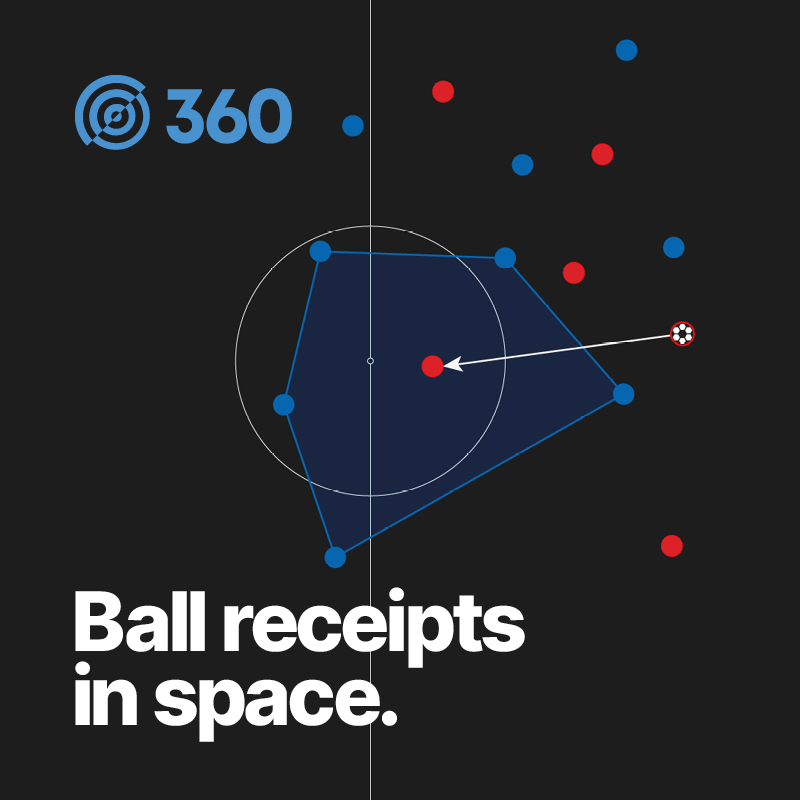
- Ball receipts in space: a series of metrics that record the number of ball receipts with a defender within a range of 0-2, 2-5, 5-10 or 10 or more yards of the ball receiver.
Both of these new metrics are now available in the data and via our API for all 360 customers and will also soon be added to StatsBomb IQ, our advanced analysis and scouting platform.
In addition, we have added four new variables to the 360 dataset:
- Distance to nearest defender
- Number of defenders goalside
- Number of visible players
- Distance to the edge of the visible area
Let's take a deeper look into the insights we can get out of the two new metrics.
Este artículo también está disponible en español. Dieser Artikel ist auf Deutsch verfügbar.
Line-Breaking Passes
In attacking play, analysts tend to be interested in three types of player: those who can score goals, those who create goals, or those who progress the ball towards goal. Line-breaking passes is a metric that serves the latter, and has long been a measure that video analysts would refer to when evaluating ball-progressing players but without being able to quantify it reliably – until now.
As a starting point, let's look at the top line-breaking passers in the Premier League so far in 2022/23:
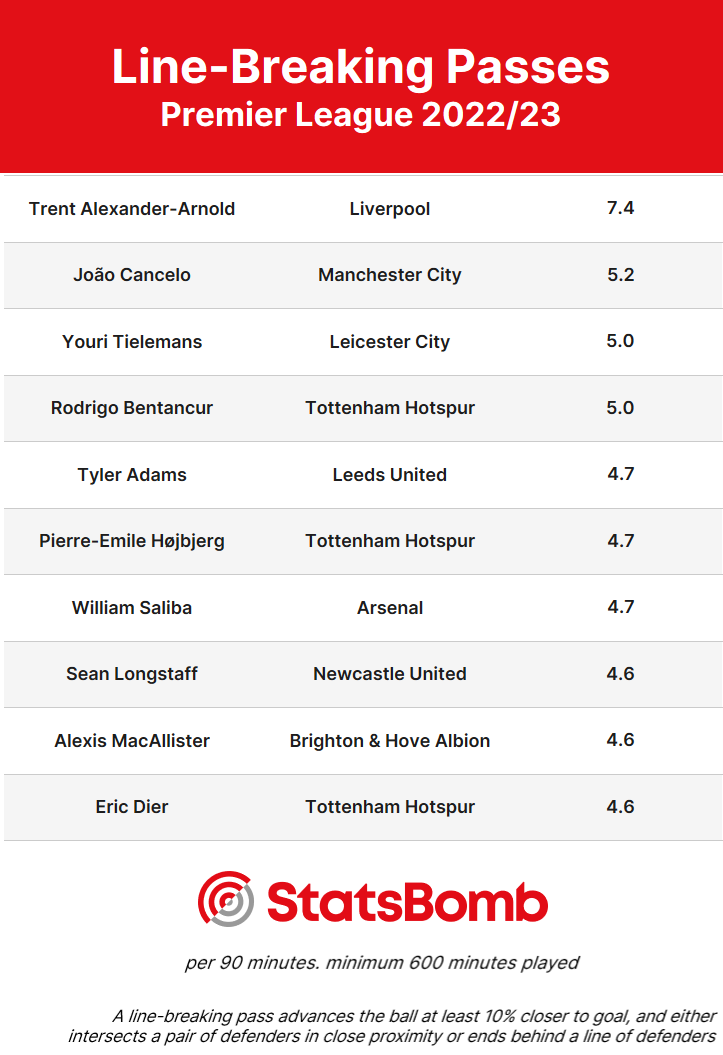
There's a couple of observations to make from this list alone:
- Trent Alexander-Arnold continues to stand out as one of the most aggressive passers in the league. It's a curious trend that the top two on the list, with João Cancelo, in this metric are full back/wing backs, who are tasked with being creative players earlier in the possession chain as well as providing the final pass in attacking moves as well.
- The presence of three Tottenham Hotspur players in the top 10, particularly Rodrigo Bentancur and Pierre-Emile Højbjerg, could be a result of Antonio Conte's desire for his team to take a more direct approach to goal by encouraging them to be more aggressive with their passing.
Like any measure, taking the list of most frequent players for Metric X should only serve as a starting point for the analysis. We can combine the two new metrics together to deliver another level of insight: finding players who can break the lines and also find teammates in space with those passes.
The best (read: easiest) example of this would be to look at the passing of Lionel Messi. After a dip in form last season, Messi is back to his best in 2022/23, providing an endless supply of chances for his PSG teammates and getting on the scoresheet himself.
In Kylian Mbappé and Nuno Mendes, Messi has the perfect teammates down the left flank to take advantage of his laser vision and execution. When either of those two make an off-ball run, Messi is there to find them.
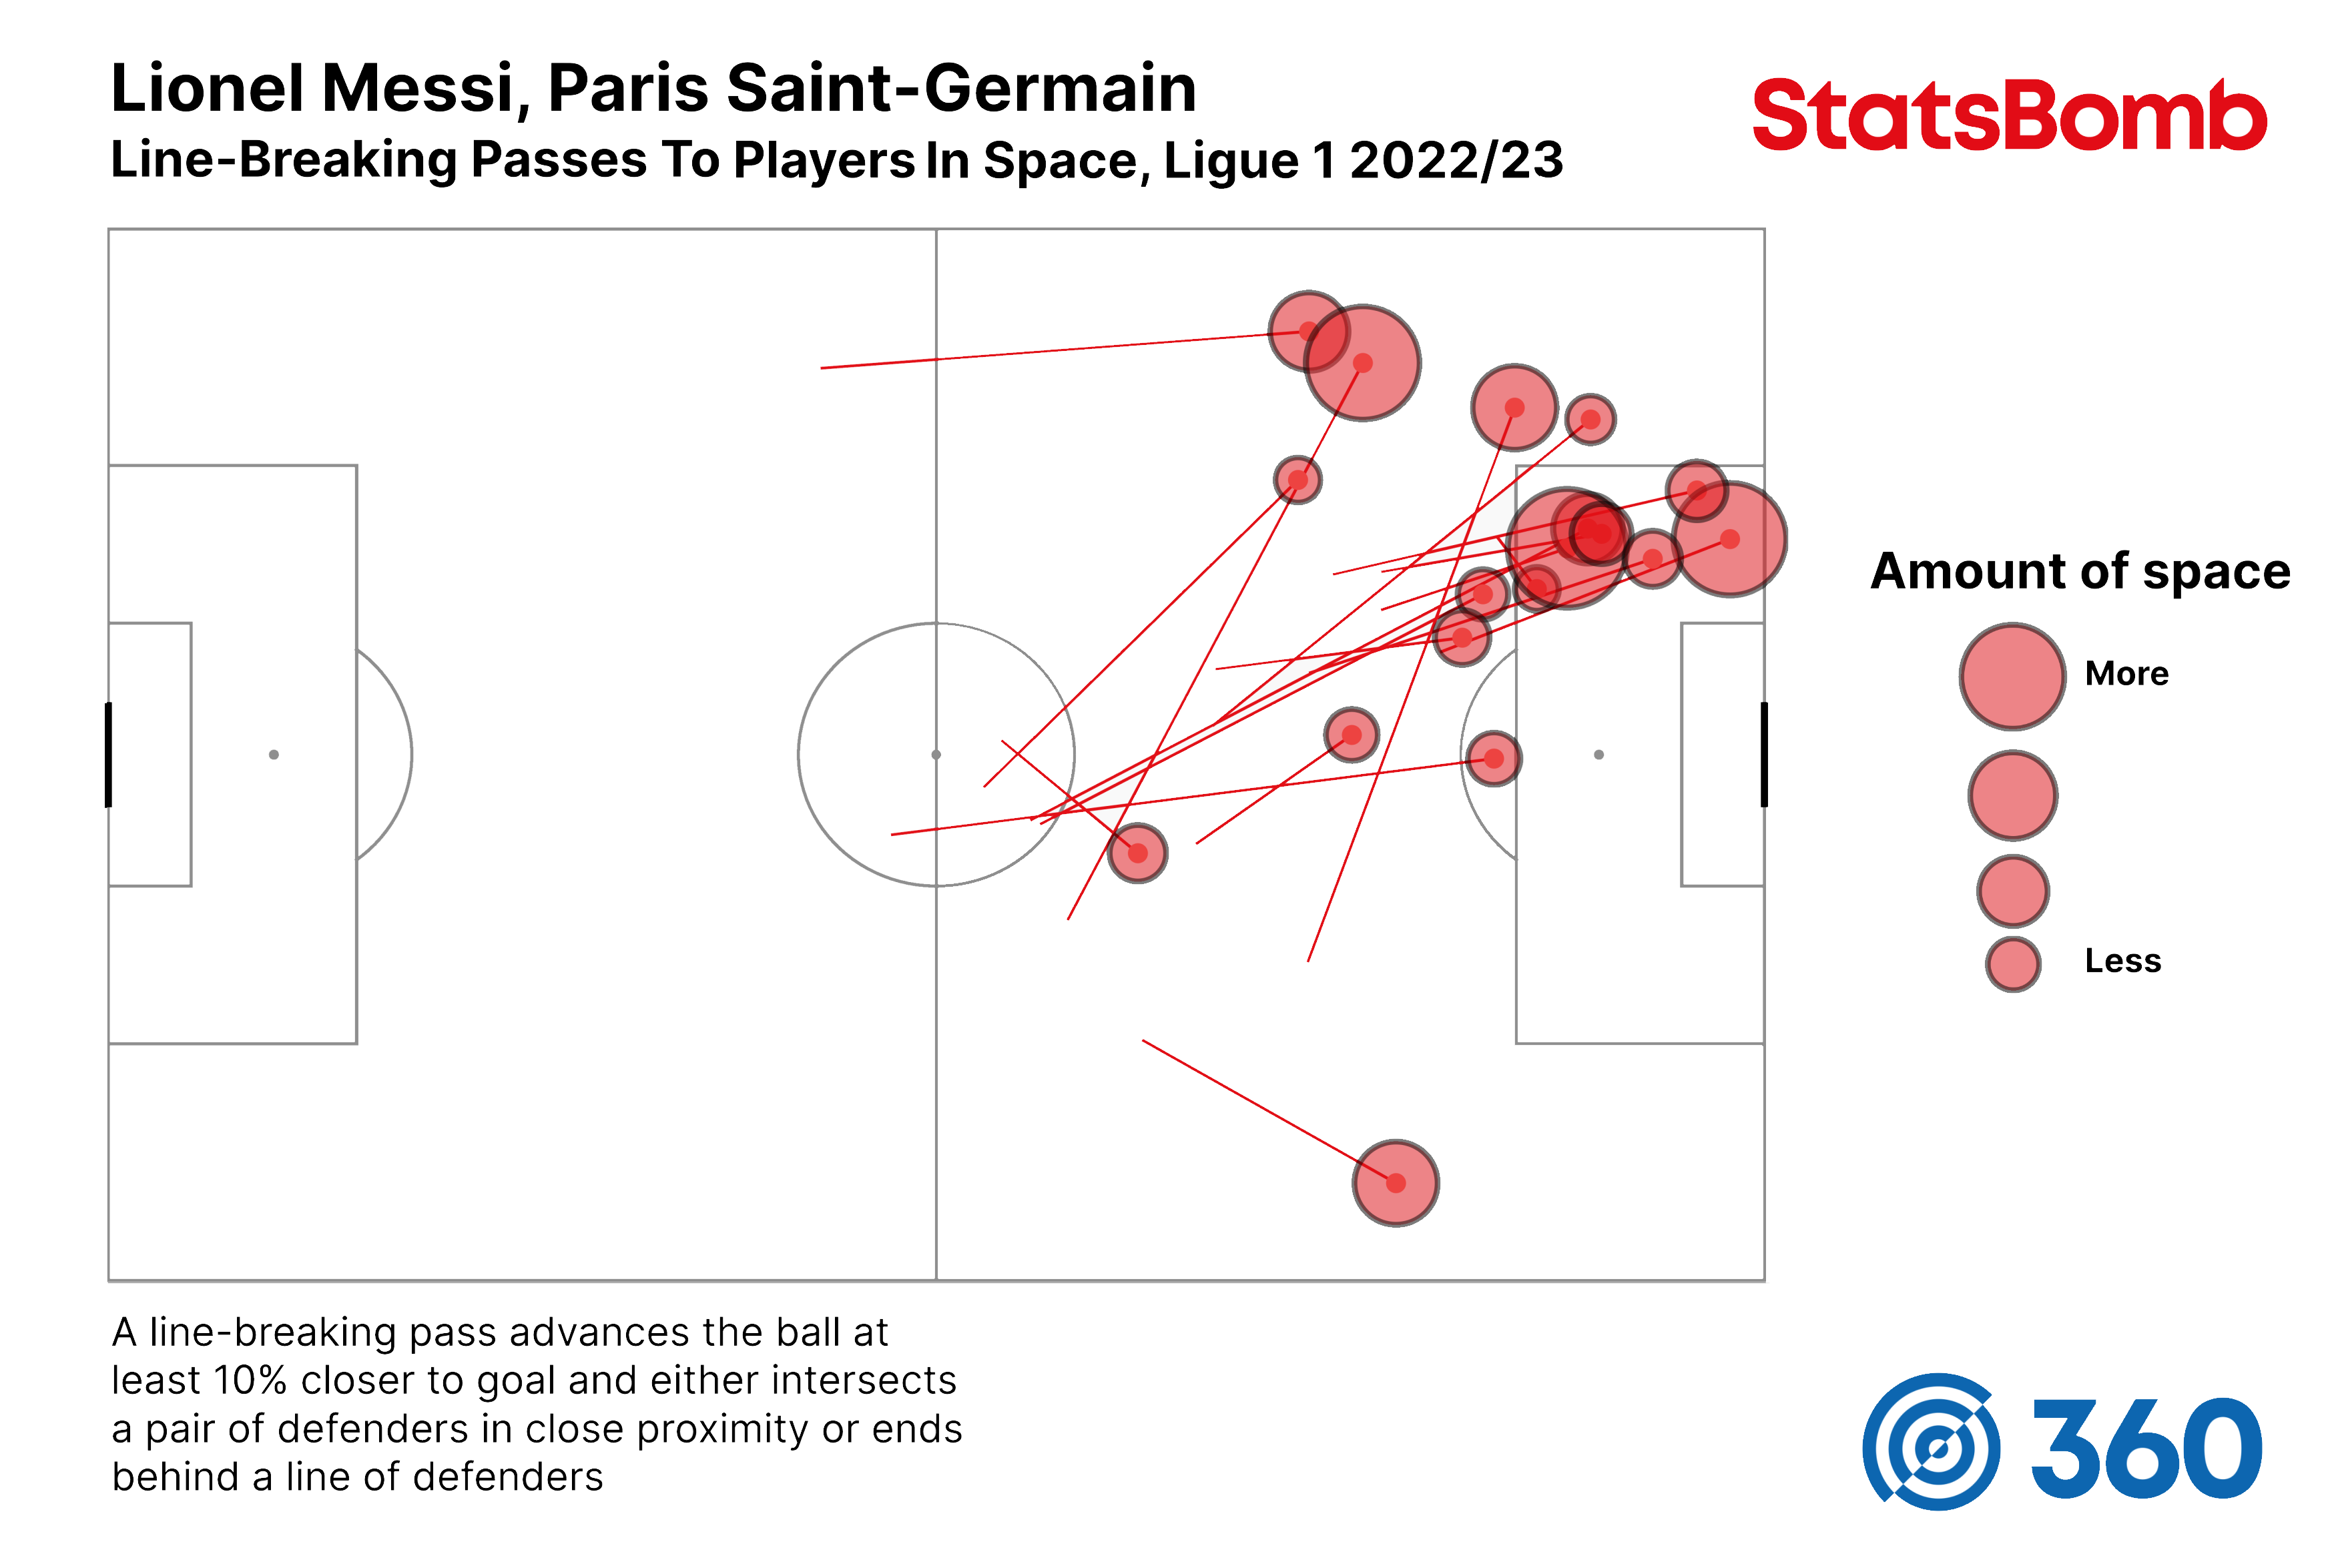
Being able to accurately measure players who can break lines with their passing is a step forward, but being able to confidently identify players who can find space to receive the ball is arguably a more exciting development.
Ball Receipts In Space
There are numerous use cases for the new Ball Receipts In Space metric on both a player and team level, but let's keep the focus on attacking players for now.
Besides the penalty box, the most valuable position on the pitch to have possession is considered to be the space known as 'Zone 14' (the central space outside the penalty box, for those unfamiliar with the term).
Like the penalty box, Zone 14 is also one of the most congested and aggressively defended spaces on the pitch. So being able to identify attacking players that can find space in that zone (and then measure the quality of their actions afterwards) is likely to produce lists of players that would be worthy of further scouting.
Here's the list of the most frequent ball receivers in space in Zone 14:
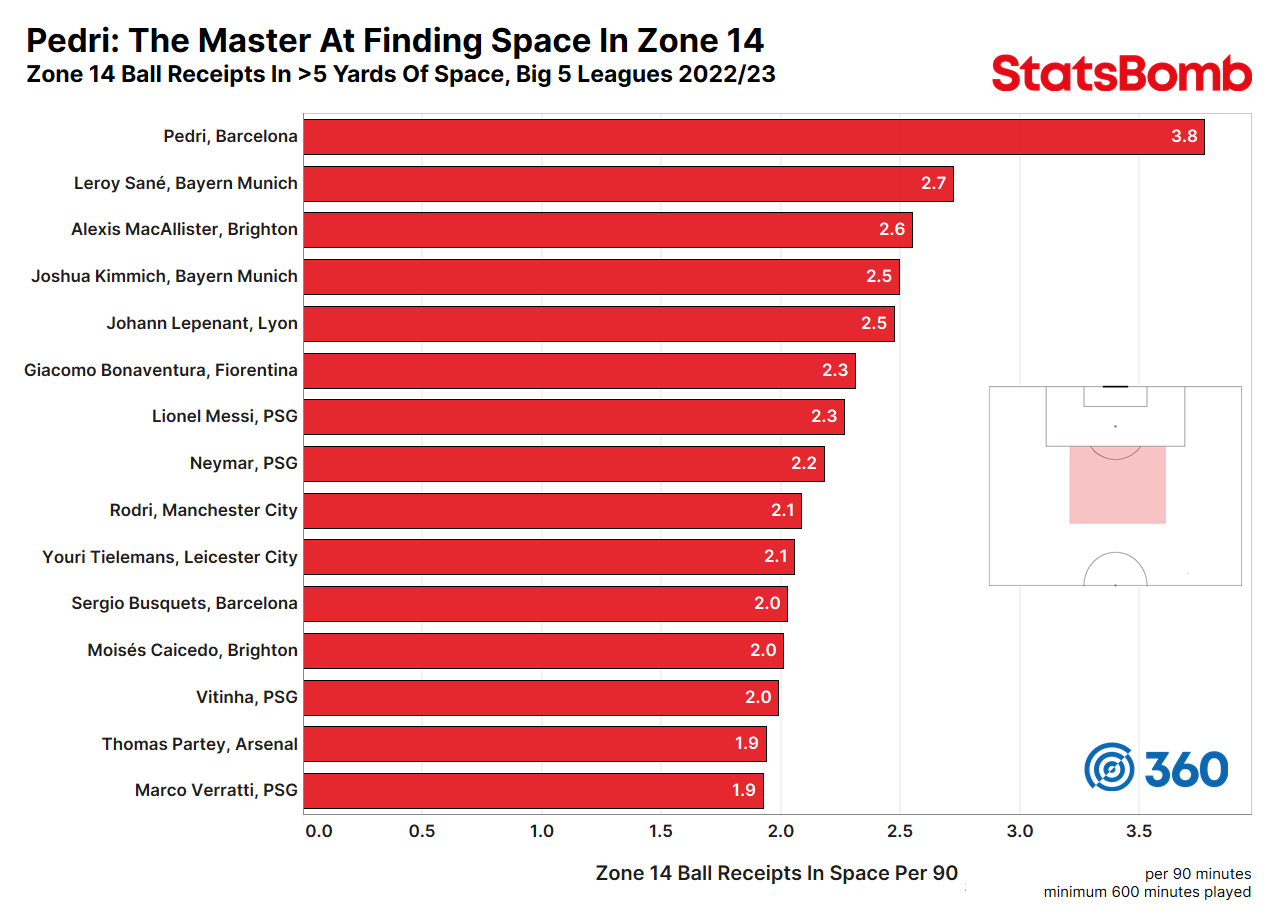
The presence of Youri Tielemans and Alexis MacAllister on this list should be eye-catching, as both were also present on the Premier League's top 10 line-breaking passers list earlier.
But it's Pedri we need to do a deeper dive on.
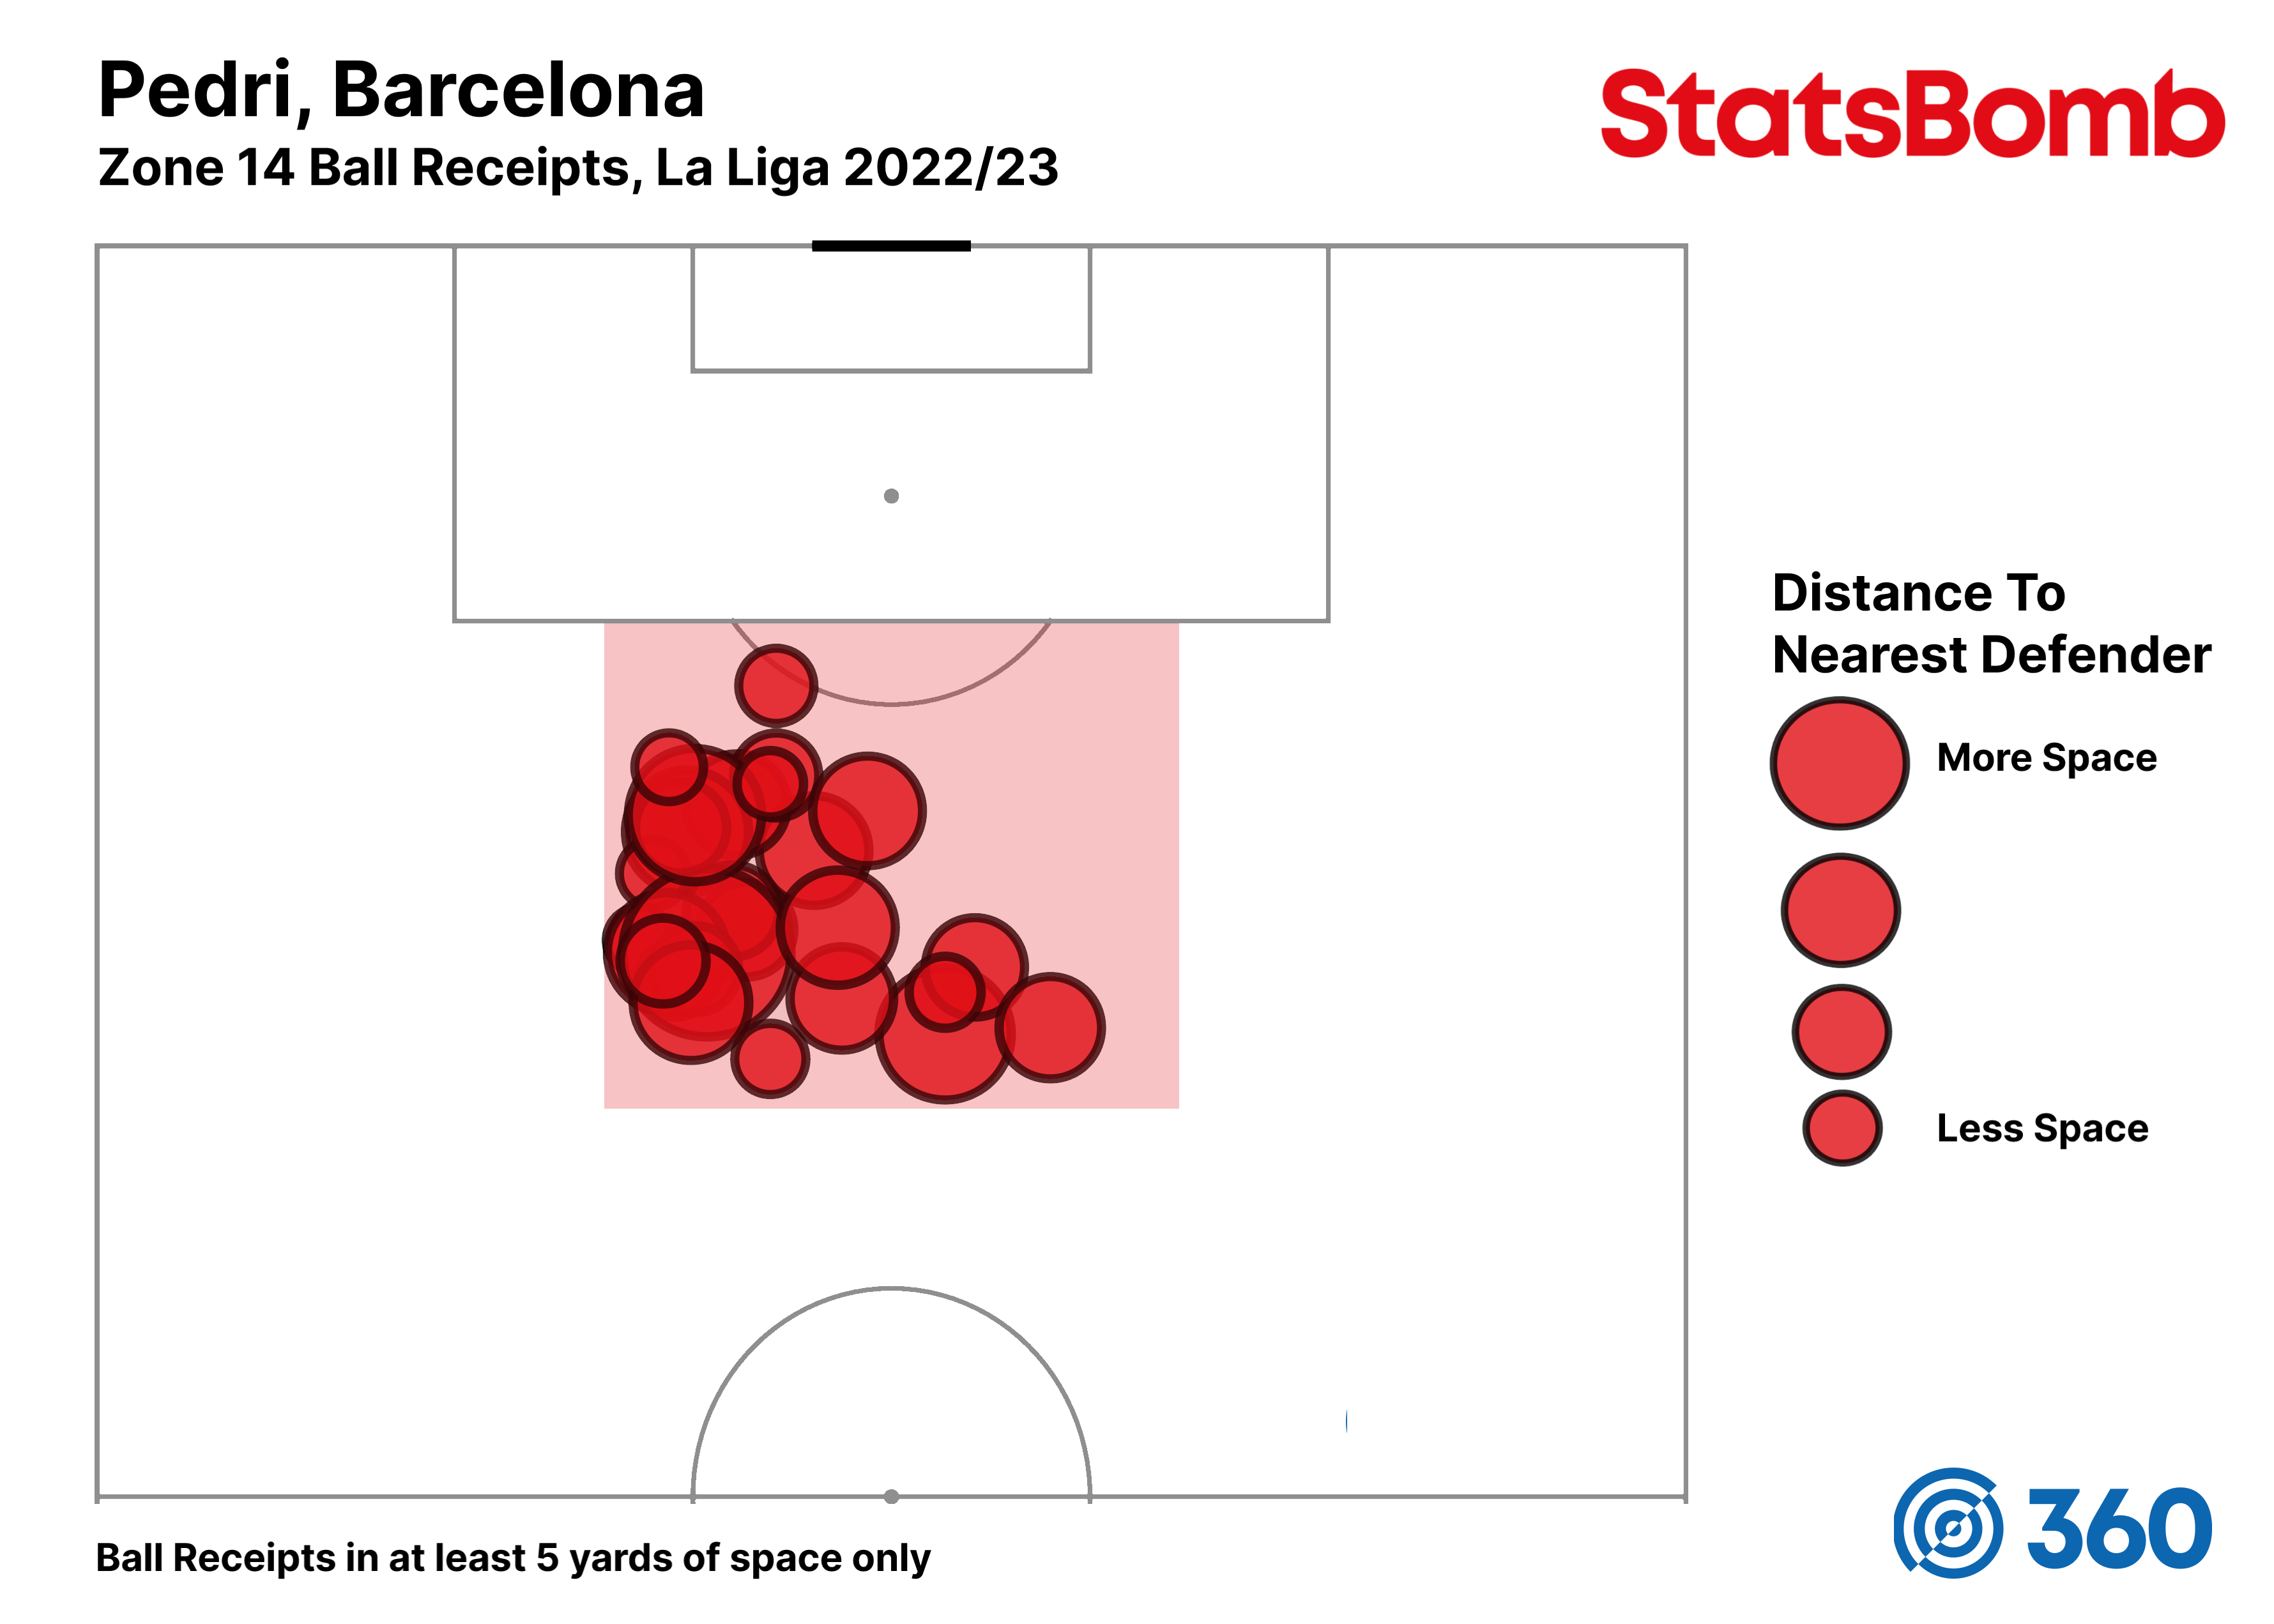
The Barcelona wonderkid has emerged as one of the highest potential players in world football, primarily due to his ability to make a metronomic contribution to Barcelona's possession game. He's able to pick passes and keep attacking moves going when on the ball, but his movement between the lines to get on the ball has also always been talked about as elite – and now we have the numbers to prove it.
Not only does he receive the ball in space in Zone 14 more frequently than any other player, but he also has an impressive ratio of how many of his total receipts are in space. 62% of all his Zone 14 ball receipts are in at least 5 yards of space (for comparison, Leroy Sané's rate is 32%).
To wrap this introduction article up, a quick example to show how we could apply the Ball Receipts In Space metric in a team analysis setting.
Here we're going to look at how often the opponent are able to pass the ball into a team's defensive Zone 14, and how regularly those pass receipts have a defender within 5 yards of them.
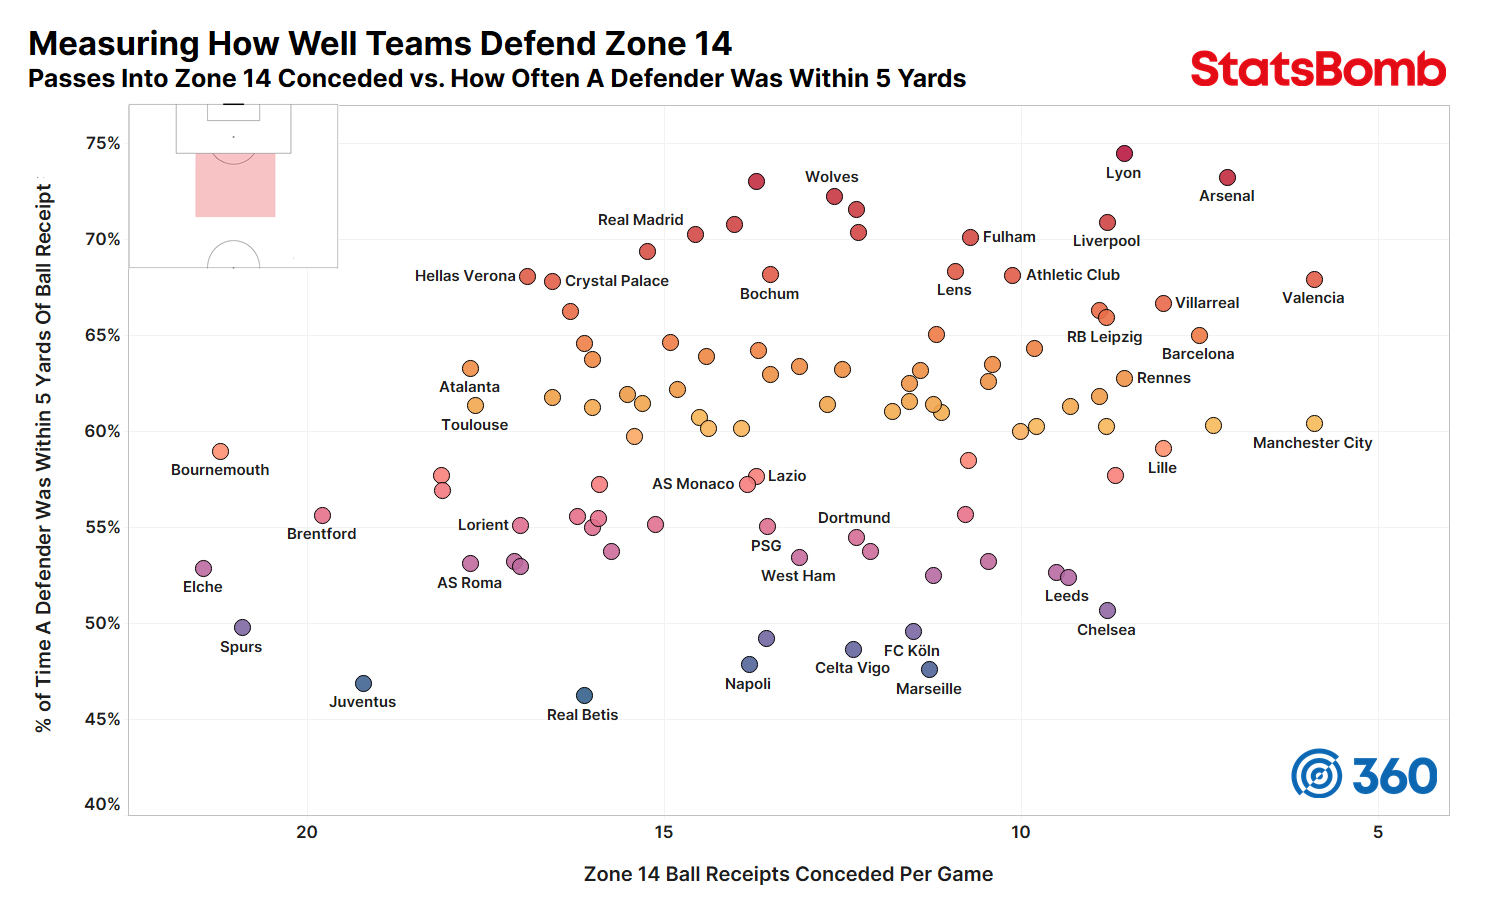
Let's go to North London to better explain what this graphic is telling us, whilst keeping in mind the effect team style will have on these numbers:
- Spurs concede 20.9 open play passes ending in Zone 14 per game. Arsenal concede 7.1.
- 73% of the time, Arsenal have at least one defender positioned within 5 yards of the ball receipt. For Spurs, it's 50%.
It's important to reiterate that right now Arsenal have the 3rd-best defence in the Premier League (0.83 xG conceded per game), while Spurs have the 4th-best (1.01 xG conceded per game). So something is clearly working for Spurs, and it's probable that the reason they concede so many passes in this zone without (relatively speaking) much pressure on the receiver is that Antonio Conte prefers to have them bunker down and defend their penalty box when the opposition get possession in the final third. While Mikel Arteta apparently prefers Arsenal defend that space more aggressively. Different strokes for different folks, folks.
This is just the beginning for StatsBomb 360 data and the enhanced analysis we and our customers are going to conduct with it. There are so many more ways to analyse teams and players even just using these two metrics alone, let alone the many more metrics that will shake out of 360 in the months and years to come. We're excited to see our customers continue to build these into their recruitment and opposition analysis workflows.
StatsBomb 360 covers 38 leagues worldwide, including each of the Big 5 leagues and their second tiers, and more leagues in Europe, North America, South America, and Asia.
If you work in a club, federation, media outlet or gambling organisation and want to learn more about the benefits of StatsBomb 360 and our other industry-leading products, please get in touch.
Este artículo también está disponible en español. Dieser Artikel ist auf Deutsch verfügbar.
