The work of demystifying the keeper position never ends.
Earlier this year StatsBomb released it’s post-shot expected goal model.
The idea was to use our keeper and defensive positioning to help build a model that accurately reflected the shots keepers were facing. Next we’ve one lots of work codifying distribution, trying to measure how and where keepers pass the ball. And finally, we’ve begun work on the third major area of a keeper’s game, command of his box. What we aim to do is bring the same level of context to keeper claims as we’ve done to shots and passing.
Let’s dig in.
Our basic conceptual approach was to look at balls that keepers have the opportunity to claim, similarly to how we might look at shots. Figure out how likely any given ball is to be claimed by the keeper and then, in light of that, evaluate how often keepers are coming to claim the balls they face against an average keeper. The idea here is to go beyond just looking at how often a keeper claims balls into his area and take into account how difficult those balls are to claim in the first place. That way we can avoid looking at a keeper who faces only easy crosses and thinking their dominant, while overlooking a keeper who manages to come for, and claim, a lot of more difficult balls. Look at the claimable balls a keeper faces, figure out how many of those balls a keeper would come for on average, and then evaluate an individual keeper against that average.
As always, with new data, some important caveats exist.
We don’t know how this data will act over the long term. We don’t know how much variance there is, what’s signal and what’s noise.
What it can do right now is help us better understand what keepers have done over the games that have been recorded. Saying “a keeper has been very aggressive coming for the ball” is a very different statement than saying “he is an aggressive keeper.” The data can tell us the first thing, it can’t, on its own tell us the second (at least not yet). Ok, enough preamble, here are some actual numbers and pictures and things you need to know. Keepers simply don’t, or can’t, claim the vast majority of balls. In our numbers, there have been over 10,200 claimable balls in the Premier League this season.
We’d expect, on average, keeper to attempt to claim only 788. They’ve actually attempted to claim 752. They’ve had an 88% success rate. Keeping is an inherently conservative business, one in which mistakes get punished by goals.
There is a general belief that you shouldn’t come unless you know you can get there. The data reflects that, by and large, that’s how keepers approach the game. This makes for a challenge when it comes to making fun pictures and charts, though. Putting all the balls that a keeper is very unlikely to go and get onto a visualization just makes things really ugly really fast. For example, here’s Petr Cech from last season, with every single claimable ball that came his way.
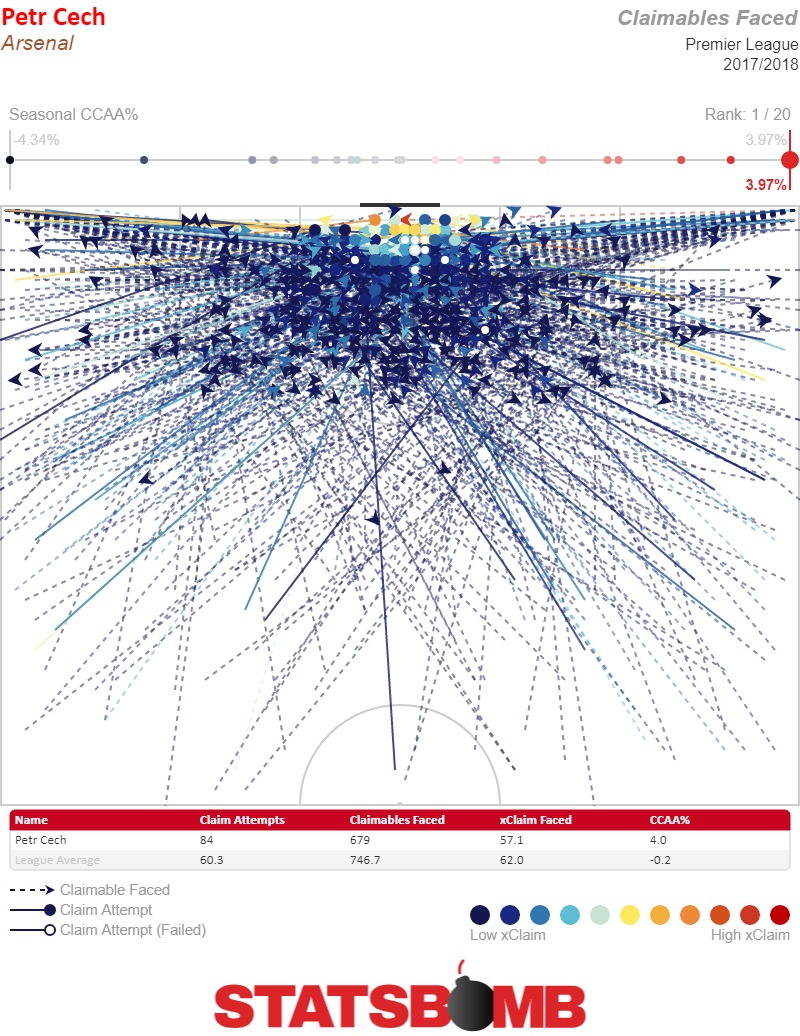
Yikes.
Filtering it down to only the higher likelihood balls makes everybody’s lives a little easier. Here’s how Cech faired that year on balls that had an expected claim value of 0.3 or higher (and look you can use the data however you want but I make sure to shout EUREKA!! In my head every single time I look at an xClaim value).
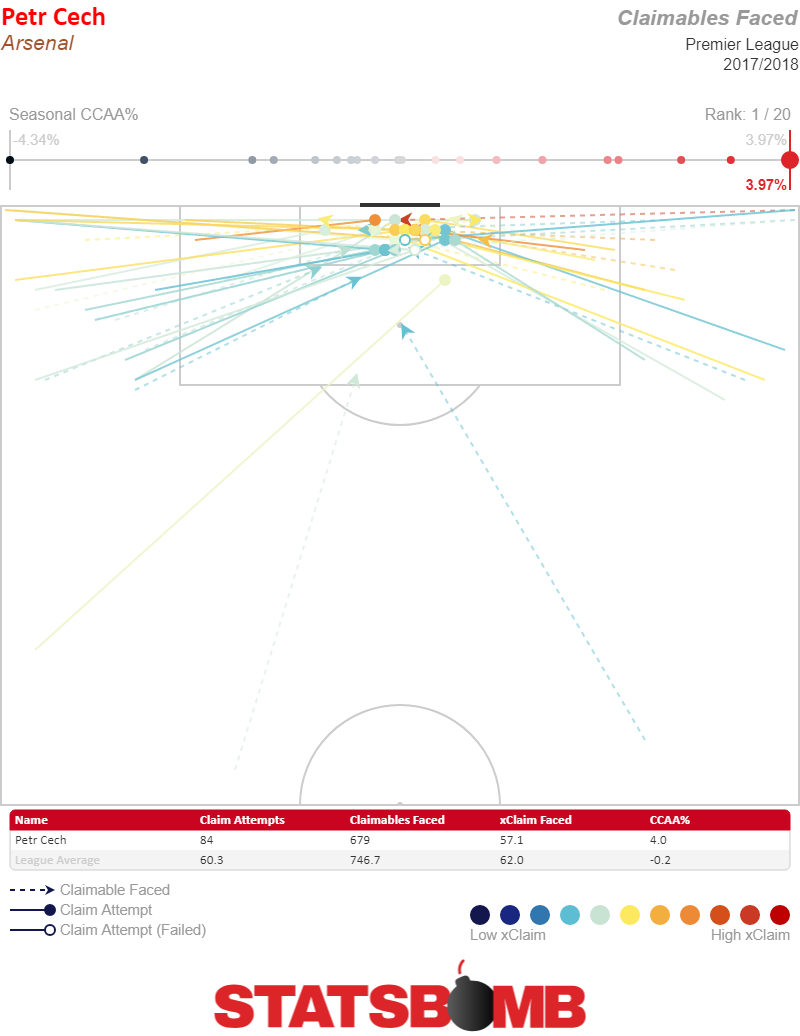
Voila!
Readability.
It’s a heck of a lot easier to look at the 47 possible balls there than it was to look at the initial map which had 679 claimable balls on it. Looking at that we can actually start to see some individual results from crosses, including a handful of the dreaded “claim attempt (failed)” variety. There’s no question though that there is a tradeoff here between granularity and completeness. On the flip side, if we’re not concerned with granularity we can just use heatmaps.
Hurray!
Want to know how aggressive Cech was at coming for balls as compared to the rest of the league. We now have a heatmap for that.
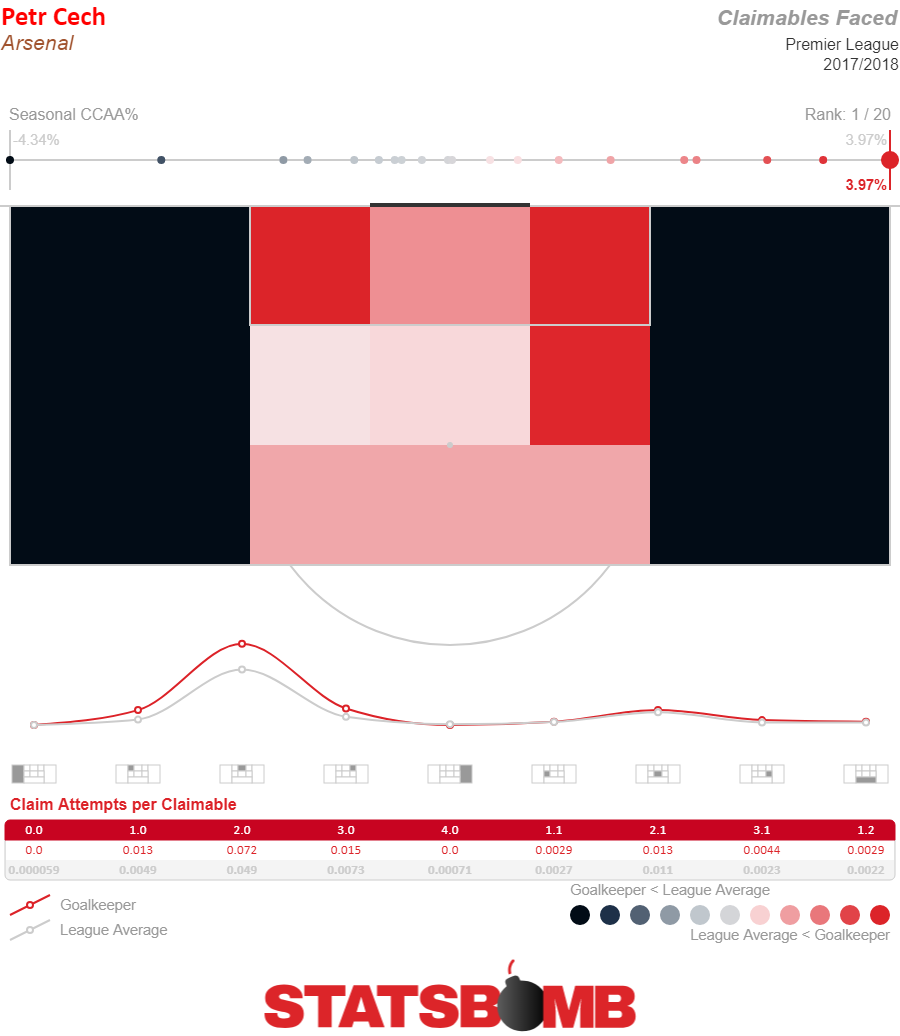
Cech, in keeping with his reputation, comes for a lot of balls. Now, here’s David De Gea from 2017-18 for comparison’s sake.
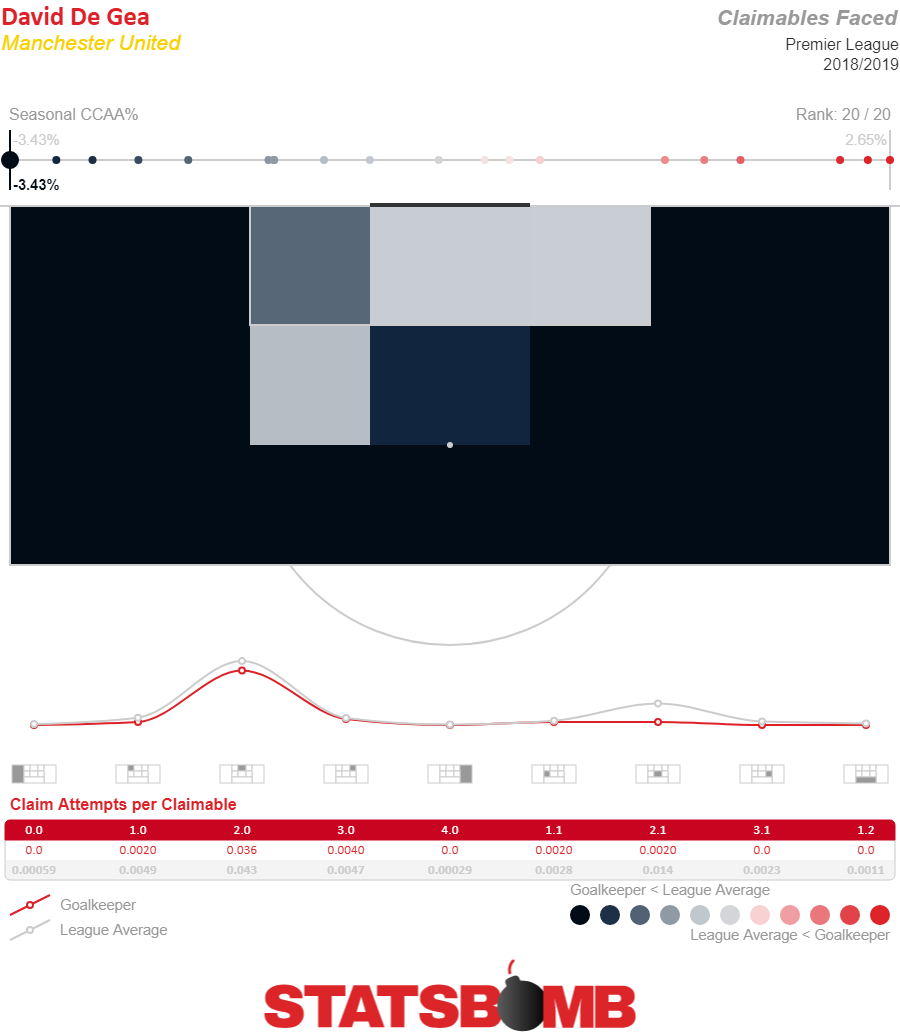
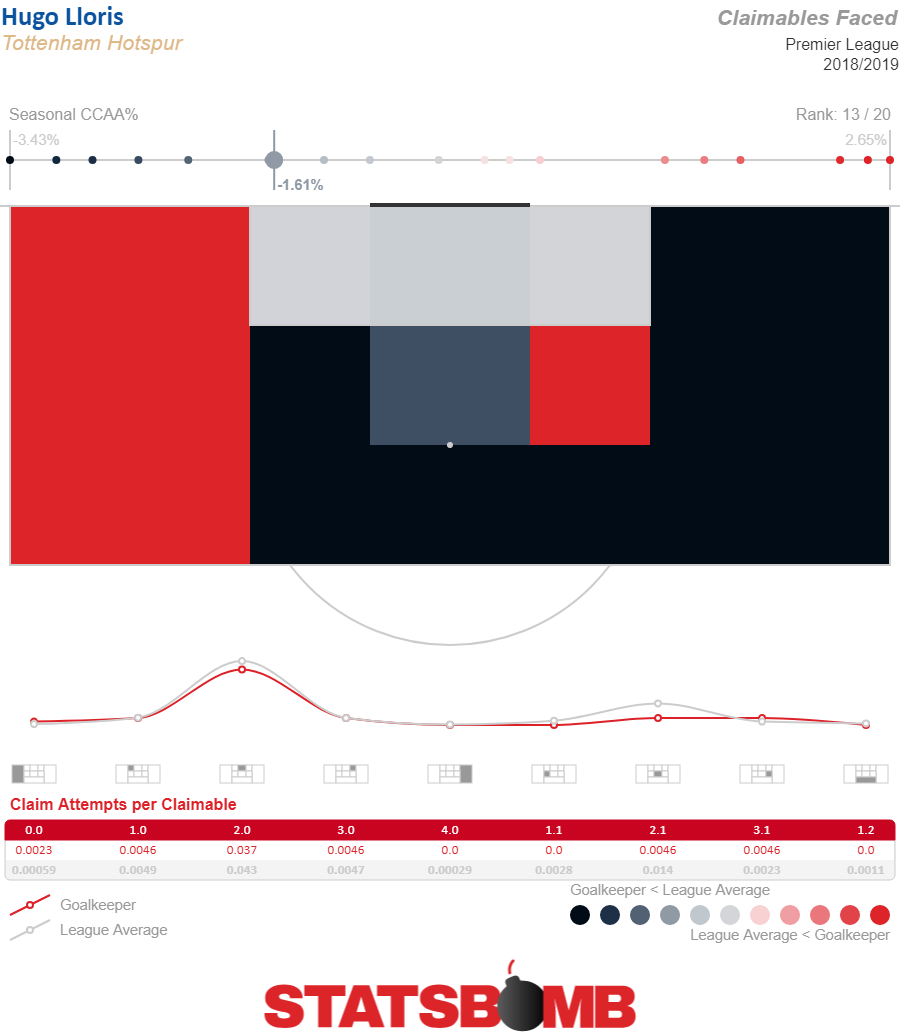
Well that certainly tracks. De Gea has a reputation for not coming off his line a lot and it turns out the data shows…he doesn’t come off his line a lot. Well done data. Ok, with the basics out of the way, how can we start using this data. One way is to help better nail down what players are doing well and poorly. A few weeks ago I wrote about how Hugo Lloris was having a great season. This is broadly true. Spurs defense has been pretty meh, they give up a bunch of shots, but they don’t concede a lot of goals.
It’s all there in the piece, and it all still applies. But a lot of people reacted with incredulity. It sure felt to watchers that Lloris was very error prone. Well, turns out claimables can shed some light on that. Here’s the Lloris heatmap. He’s not particularly aggressive. He comes for 1.61% fewer balls than xClaims would predict. That’s 13th most aggressive in the league.
But now, let’s look at them more granularly. Here are the claimable balls with an over 0.3 xClaim value.
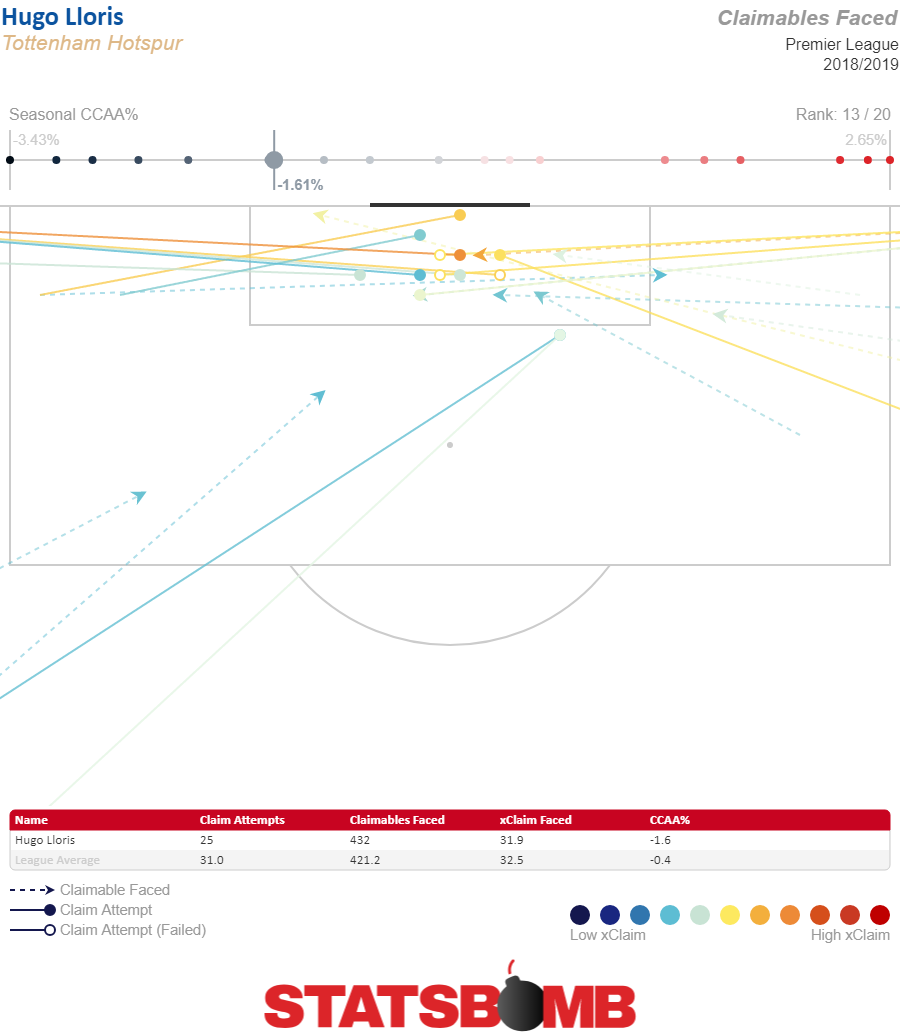
Of the 432 balls he’s faced, only 23 have cleared that bar, and he’s come for 13 of them, while xClaims suggests an average keeper would come for only 10. But, as you can see, right smack dab there in the middle, he’s missed three fat chances.
In fact, he’s only claimed 77% of these higher probability balls. We’re slicing things extremely narrowly here, so maybe it’s not great for drawing conclusions about overall performance, but Lloris flapping at three balls which are very gettable, and keepers come for between 30% and 60% of the time is certainly going to stick in the brain as not great.
There are lots of unknowns about that assessment of course. Obviously unsuccessful claims are a bad thing. But, exactly how bad they are is a complicated question. Clearly those errors haven’t really hurt Spurs this season. Are they lucky that’s the case, or is that normal. Rigorously translating keeper’s failing to claim balls that they come for into an actual relationship with goals and therefore results is a problem that’s beyond the scope of what claimables does (at least right now).
It’s a relief, however, to discover in the data an explanation for why Lloris has seemed to be error prone, even as we say with high confidence that error-prone vibe hasn’t impacted how good he is at keeping the ball out of the net. So, that’s your new keeper news. StatsBomb has a fun new tool to examine how aggressive keepers are. Keep it in your thoughts the next time the data request line is open.
Header image courtesy of the Press Association