
This article is also available in German here. Dieser Artikel ist auf Deutsch verfügbar.
Introduction
Goals are the most important events that occur in football. As such, most modelling attempts - namely, xG models - have been focused on estimating the likelihood of scoring from given situations. These models are able to quantify the quality of the chances that teams create, but it has long been of interest to assess which players play the most significant role in enabling the creation of high-value goalscoring opportunities. Particularly via their ball progression.
Several different approaches have been taken in the past to estimate this, some more accurate and calibrated than others. While ‘counting stats’ had some use in the early days of analytics - metrics such as Key Passes, Progressive Passes, and Packing - they have always lacked the required granularity and context needed to be an accurate measure of passing value. There are now a band of higher-level approaches that measure the value of passing far more effectively, rendering these approaches redundant.
It was for similar reasons that analysts moved away from shots and towards expected goals as a measure of attacking performance. It’s now universally understood that a simple shot count misses too much information and context to make it useful in isolation, and as a metric is far less predictive of future goals than xG is. Football is now making the same move with measures of passing value. Those still using counting stats will be left behind.
Of course, it's no good making a claim without justifying it with evidence, so we conducted some research: Which measures of passing value are most predictive of a team going on to score downstream in a possession? This approach makes sense given that with every action on the pitch a team is either trying to score a goal or prevent one from being scored and, when we look for the best ball progressors, we are ultimately trying to measure which of those players increase or decrease those probabilities. We found that:
- Packing numbers are less predictive of downstream goalscoring probabilities than event-based ways of measuring ball progression
- This is largely because Packing doesn’t contain information about where on the pitch events are occurring. Models that contain this information have more predictive power than those that don’t
- Using only start and end locations as a measure of passing value is less predictive than the current state-of-the-art models, which incorporate additional play context around each event
So what is the best way to measure passing value in 2022?
Current measures
Expected assists: If we have an expected likelihood for each shot resulting in a goal, we can look back at the pass prior to that shot to see which players played the passes that could have resulted in goals. This is more informative than just looking at assists, but has the limitation of being heavily dependent on the shot-takers being able to get their shot away following the high value pass, and only considers the pass immediately preceding the shot. Any passes that contribute significantly to the buildup prior to that are neglected.
xG chain: This is a logical extension of the expected assist approach. To overcome the limitation of only considering the pass prior to a shot, we can propagate the goalscoring likelihood for each shot back through all the passes in the sequence leading up to it. That way, players frequently involved in plays that result in high quality chances are still rewarded for their contributions. This approach has some benefits, but still assumes the presence of a shot-taker who is able to capitalise on the good buildup to take a high-quality shot. Moreover, this approach can conflate the contribution from teammates. For example, a player that reliably plays easy passes to a key playmaker will generally be highly rewarded by this approach, even if most of the buildup value comes from the playmaker.
Progressive passes: A less shot-centric approach to valuing buildup is to consider the number of passes that bring the ball closer to the opposition goal. These types of approaches typically define some threshold for progression, either number of yards forward or how much closer the ball gets to goal, as a % of starting distance. This allows the separation of players whose passes are mostly safe and cautious from players whose passes disproportionately drive the ball forward towards the opposition goal. This has been used successfully in the past to identify players who progress the ball well, but is still a relatively coarse approach. Fifty yard progressive passes are treated similarly to 15 yard progressive passes, and a 15 yard pass down the wing is treated the same as a 15 yard forward pass into the penalty box.
Packing: None of the other approaches above consider the location of off-ball players. One approach that does take this into consideration is Packing.
Packing measures the number of opposition players bypassed by a pass as the ball moves up the pitch towards the opposition goal. The rationale behind this approach is that any defenders bypassed in this manner end up behind the ball and have been “taken out of the play” by the pass. As such, through balls that break through a line of defence or long aerial balls that successfully bypass lines of defence to find a teammate are rewarded in proportion to the number of opposition players left behind the ball.
Several variations of this metric exist: one of them considers the number of opponents bypassed by the ball based on the distance to the opposition goal, i.e. how many opposition players were closer to the opposition goal than the ball and how did this number change as after the pass. Another variant of packing considers opposition players bypassed just along the x-coordinate (pitch length). Some versions also only consider defenders bypassed instead of all opposition players.
Regardless of the variant in consideration, none of the packing metrics explicitly consider the pass location or play context (open play, free kick, etc.). This means that a pass's value is considered equivalent if they overtake the same number of opposition players/defenders, regardless of whether the pass goes from the halfway line to a teammate on the penalty spot or it’s a 5-yard through ball to beat a high line close to the halfway line. The consideration of broader play context is also limited: the number of defenders available to “pack” in a counterattack will be considerably smaller than a settled possession.
Possession value models: Some of the more recent approaches to valuing events have involved explicitly estimating the change in goalscoring likelihoods as a result of the event, taking into consideration the start and end locations and contexts of play, sometimes including some possession history to provide the models with more play evolution context. There are several benefits to these sorts of approaches, which will be discussed below, but in many cases, these have the limitation of incorporating very limited amounts of off-ball player location information.
Pitch control models: Some possession value models do consider the location of off-ball players from tracking data. These are probabilistic approaches to estimate how much control each team has over each area of the pitch (likelihood that the team would retain possession if a pass was played there) and the likelihood of going on to score if the ball is successfully played to that area. This requires full tracking data to train and apply, and has so far only been developed and used by a small number of teams, most notably by Javier Fernandez and colleagues and Will Spearman, due to the scarcity of large quantities of tracking data and the significant technical expertise required to train them. Widespread research and adoption of these types of model are still mostly limited by relative scarcity of full-pitch tracking data, and their utility is also limited by the much narrower scope of leagues for which tracking data is available (compared to event data).
StatsBomb’s Approach: On-Ball Value (OBV)
Our current approach to valuing ball progression is with our own possession value model, On-Ball Value (OBV). Conceptually, OBV assesses ball progression value by estimating how much an event improves (or reduces) the team’s expected goal difference over the current and next possessions, which we can split into both attacking and defensive components.
We believe possession value models such as OBV have a few advantages over other methods of measuring the value/progressiveness of a player’s actions when in possession of the ball.
An intuitive and meaningful scale
A progressive pass will generally increase the chances of a team scoring, and reduce the chances that they will go on to concede if they lose the ball. One of the key benefits of using OBV to value progressive passes is that they have been trained on, and are explicitly measured in terms of net expected Goal Difference from the events - a well-calibrated fraction of the most fundamental meaningful unit of measurement in football: Goals.
This is more useful than the units some other approaches provide e.g. number of progressive carries per 90 mins or number of “packed” players per 90 minutes, which attempt to measure progressive buildup value via proxies correlated with goal rates: distance to goal and defenders between ball and goal. These can be directionally informative, but the real magnitude of the downstream impact of those numbers remains unknown.
Holistic approach to valuing events (and a common scale?)
While we can - and do - use OBV to assess the progressive value of passes, the OBV model is considerably more general than that. It estimates how much more likely a team is to score and concede as a result of any action. This can be applied to all passes to quantitatively assess their progressive value, but has the added benefit of also allowing us to compare values across event types e.g. value added from carries, interceptions, shots, etc., since the impact of all events are measured using a common scale.
With OBV, we can compare the value added by players who have different roles or action profiles. A midfielder who likes to get into the box and take shots, but doesn’t contribute much to progressing the ball up the field can be directly compared to a midfielder that does the opposite and tends to stay deeper and pass the ball forward, but rarely shoots themselves.
If we were to compare these two players using, say, packing and expected goals per game, it is not clear how much relative importance we should give to each of those two metrics. We can see that one player plays more progressive passes and the other is more likely to score, but we don’t know which way the scales tip when it comes to creating opportunities for others vs. taking scoring chances yourself.
Because OBV measures the value of each action in terms of how it changes the team’s expected goal difference, comparing these two different midfield profiles in terms of the value they add to their teams becomes possible. This means that any analysis we perform on top of OBV is in a common currency.
Risk and reward
OBV measures the value of a pass directly in terms of how it changes a team’s probability of scoring and conceding – if the pass is unsuccessful, the player is penalised according to the value that their team had built up before they lost the ball, and the probability that the opposition go on to score as a result of regaining the ball.
Directly tying ball-moving actions to team scoring in this way means that OBV is interpretable in terms of how a player changed their team’s expected goal difference via their movement of the ball. We think this is a more complete way of valuing ball-moving actions than the alternatives, which are more indirect measures of what we ultimately care about – the individual player’s impact on their team’s ability to score and not concede.
With this in mind, the ability to account for unsuccessful actions in our evaluation of players is very important. Counting the number of successful passes that were progressive or counting the total number of players bypassed through a player’s successful passes (packing) ignores all of the times that the player attempted to pass progressively or take out opponents, but failed and handed the opposition a chance to score. We want to understand a player’s contribution in terms of their net impact on their team’s goal difference, rather than focus solely on the number of valuable actions they perform. When a player takes a risk, do they tend to execute well enough for it to be justified?
Consistency
If the metric we use to judge ball progression doesn’t do so in a way that is directly linked to a team’s effectiveness, we can see inconsistencies in the way we evaluate players. Ideally, we want actions with the same score to have the same value, i.e. to contribute in the same way to the team’s effectiveness in games.
Not all progressive passes are created equal in terms of how they change a team’s expected goal difference/effectiveness. A successful pass 15 yards up the field by a centre back has a different influence on a team’s expected goal difference than a pass of the same distance towards goal that ends in the penalty area. Likewise, a pass that bypasses 4 players, 3 of which are on the other side of the field, has different utility to the team than one that bypasses a compact line of 4 midfielders.
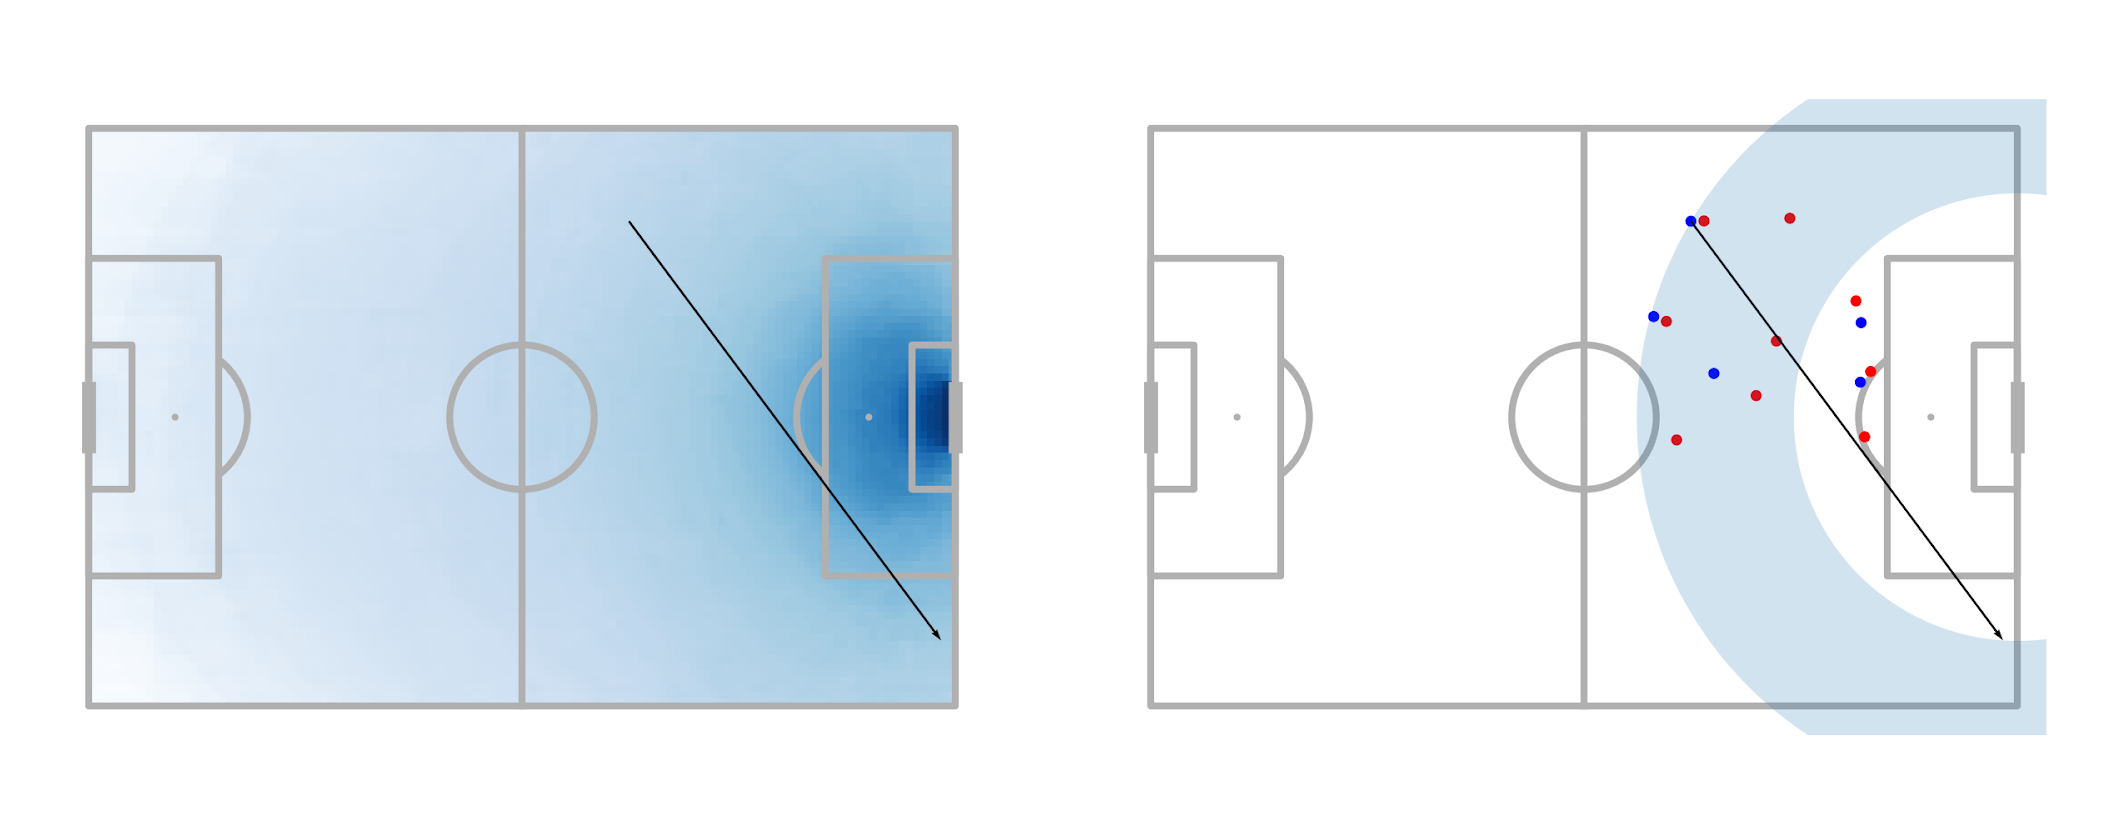
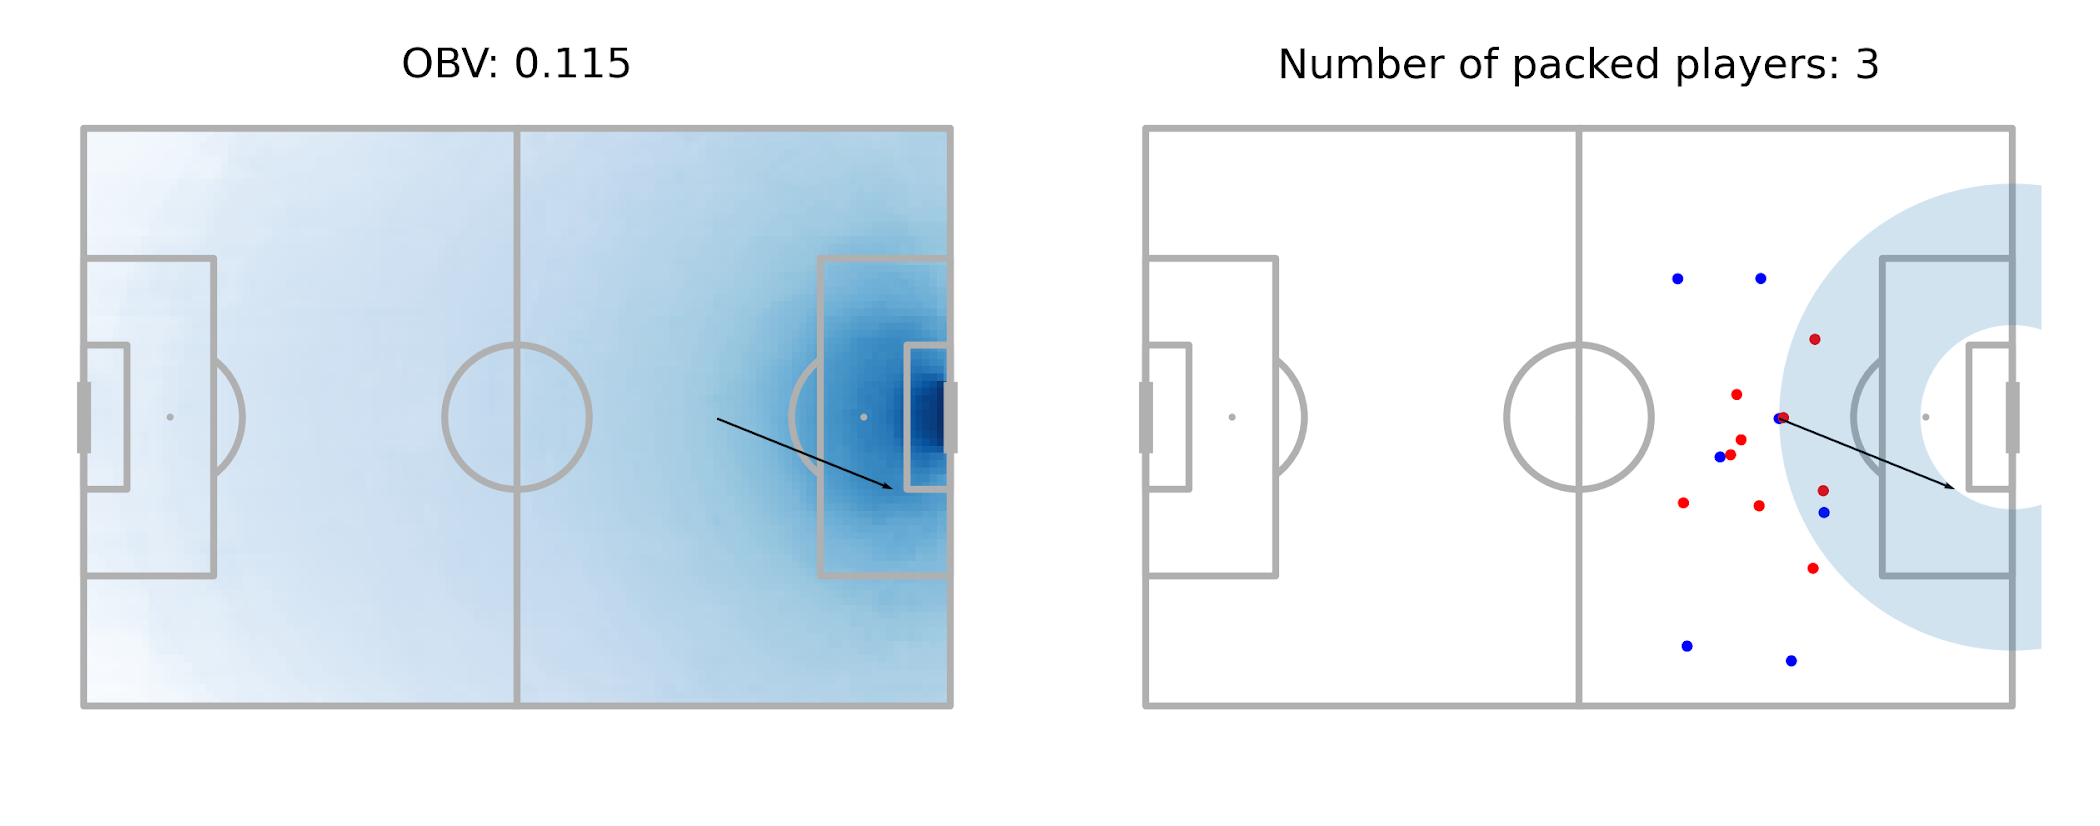
The visualisations below illustrate how the information used in OBV (left) and packing (right) leads to an estimate of the value of a pass. The heatmap on the left hand plot is the possession value surface as estimated by OBV (on a log scale), and the highlighted area on the right hand plot is the region in which players are deemed to have been packed.
One case where the importance of valuing actions in terms of goalscoring probabilities becomes particularly apparent is cutbacks. In the example below, the ball does not move a huge amount closer to the centre of goal, nor does the pass bypass many opposition players, but the increase in goalscoring probability is substantial.
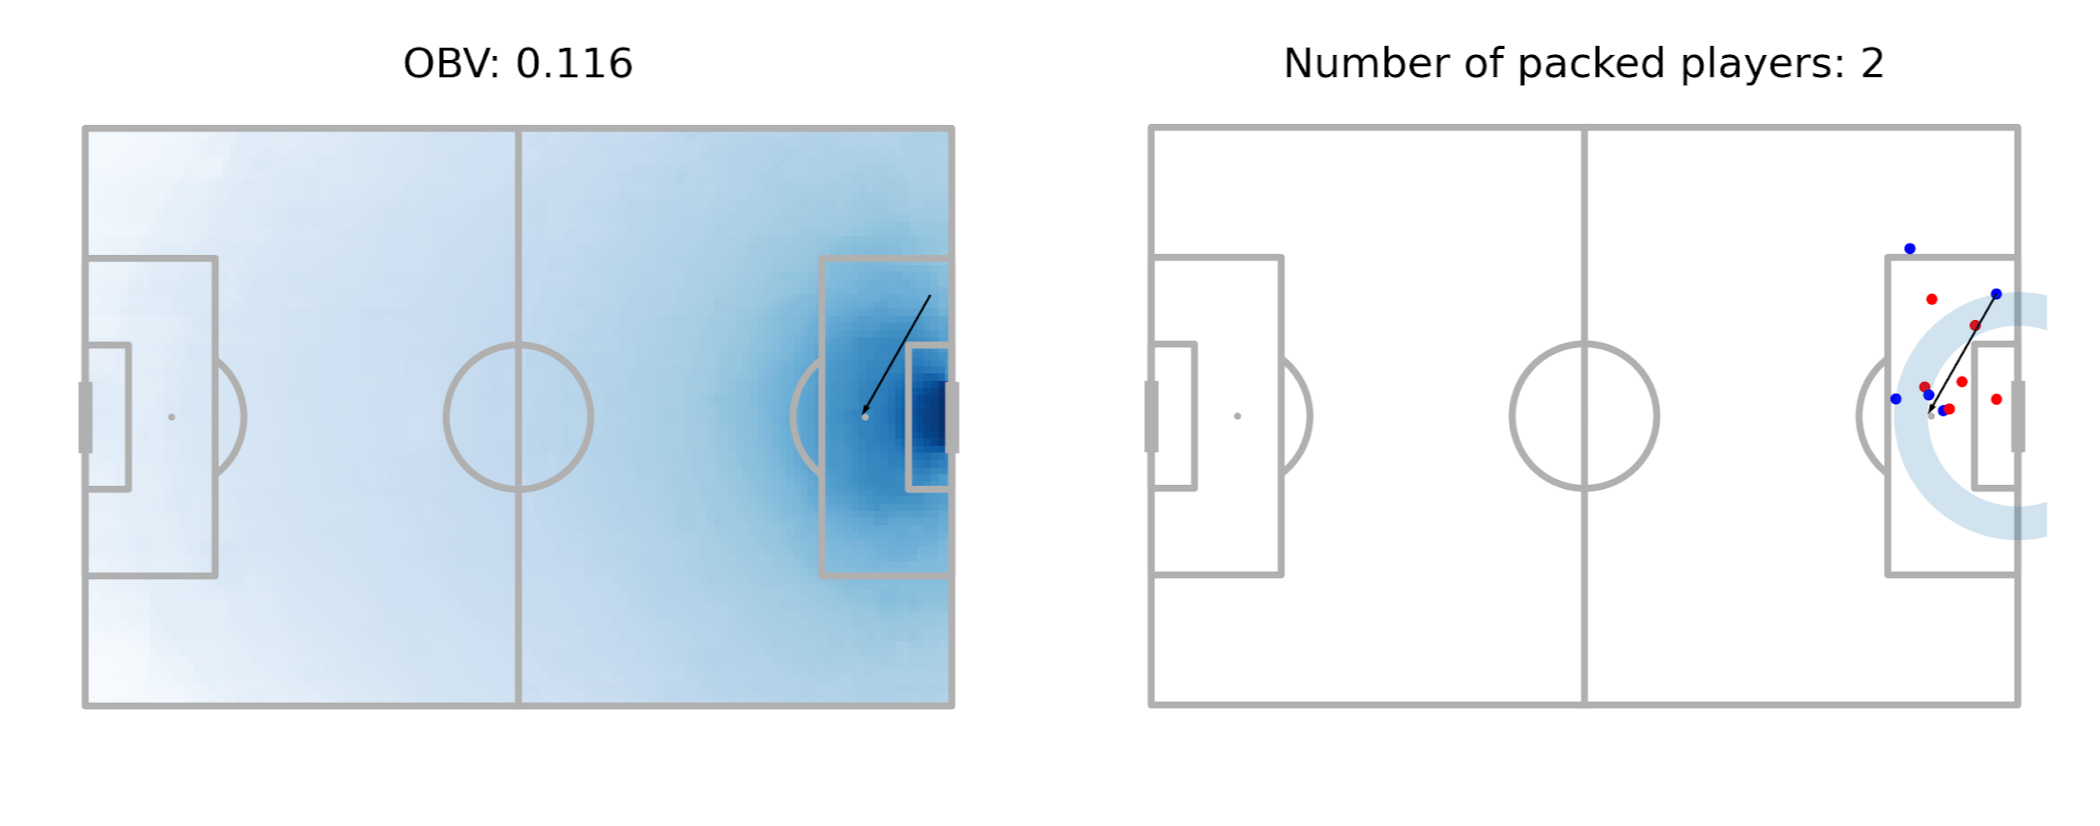
A pass with the same number of packed players can be very different in terms of how it alters a team’s scoring probabilities for and against, for example:
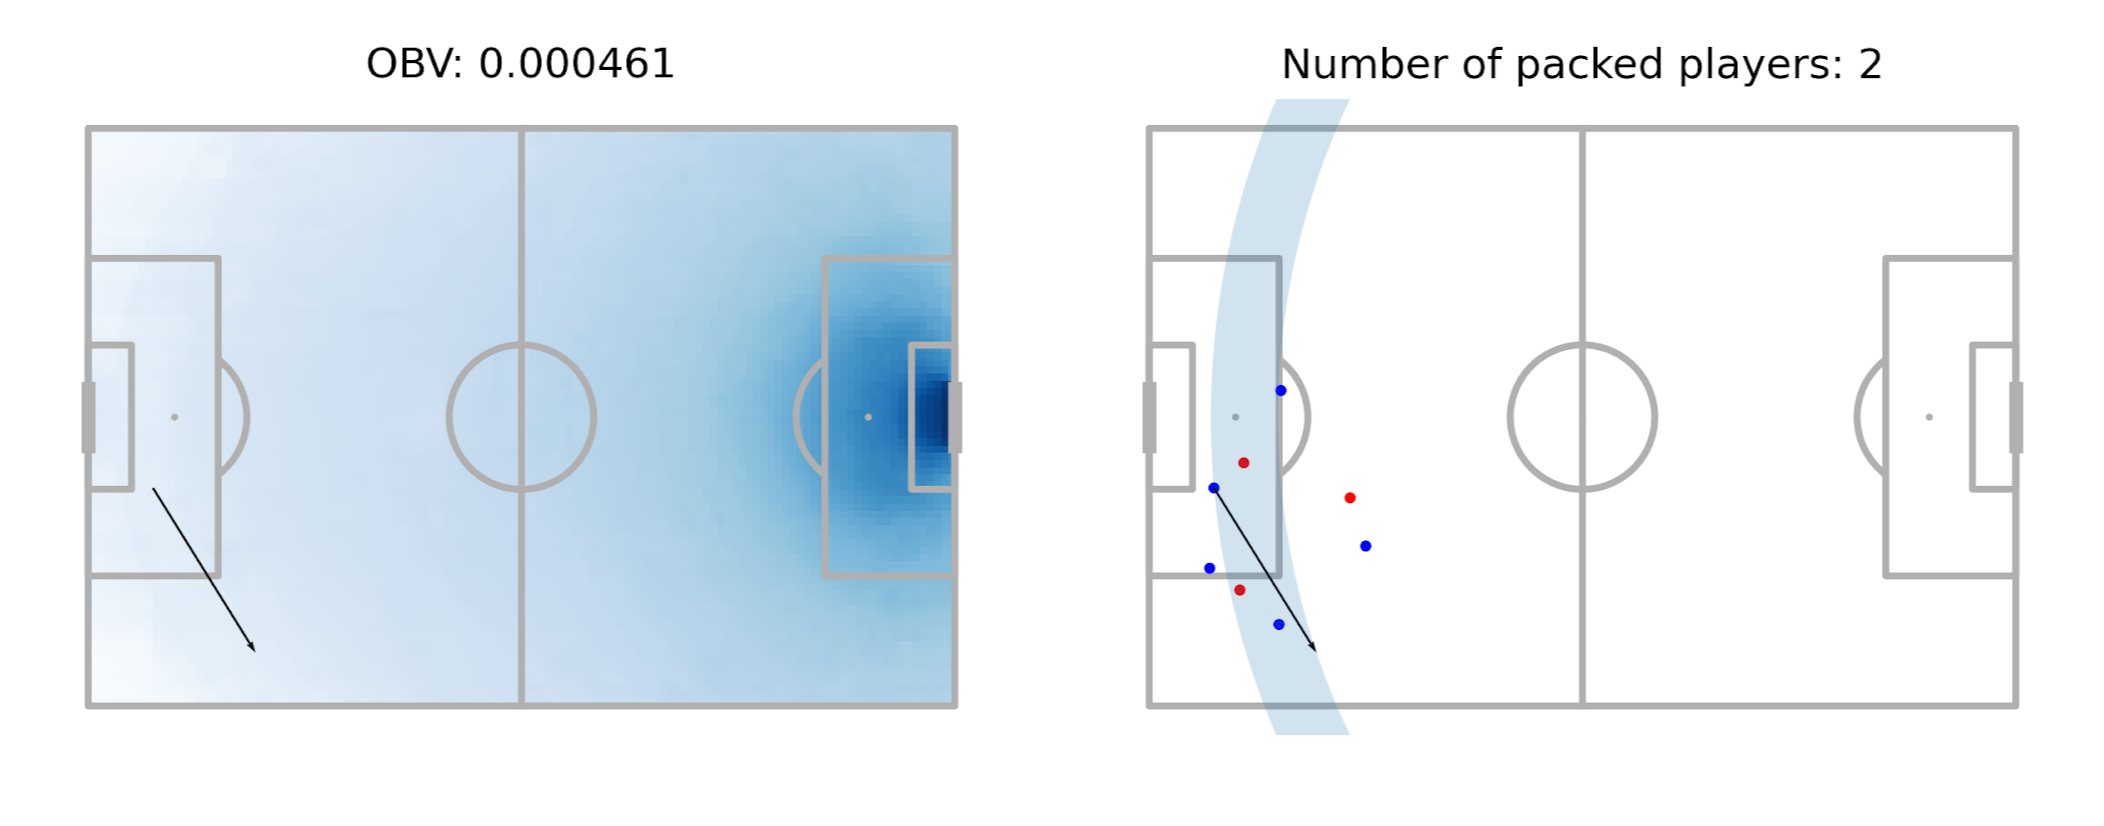
Similarly, two passes may be rated very closely by OBV, but have different values in terms of the “true” change in goalscoring probability as a result of the pass. In this example, the pass is a difficult threaded ball into the area – the “true” goal scoring probability before the action is relatively low.
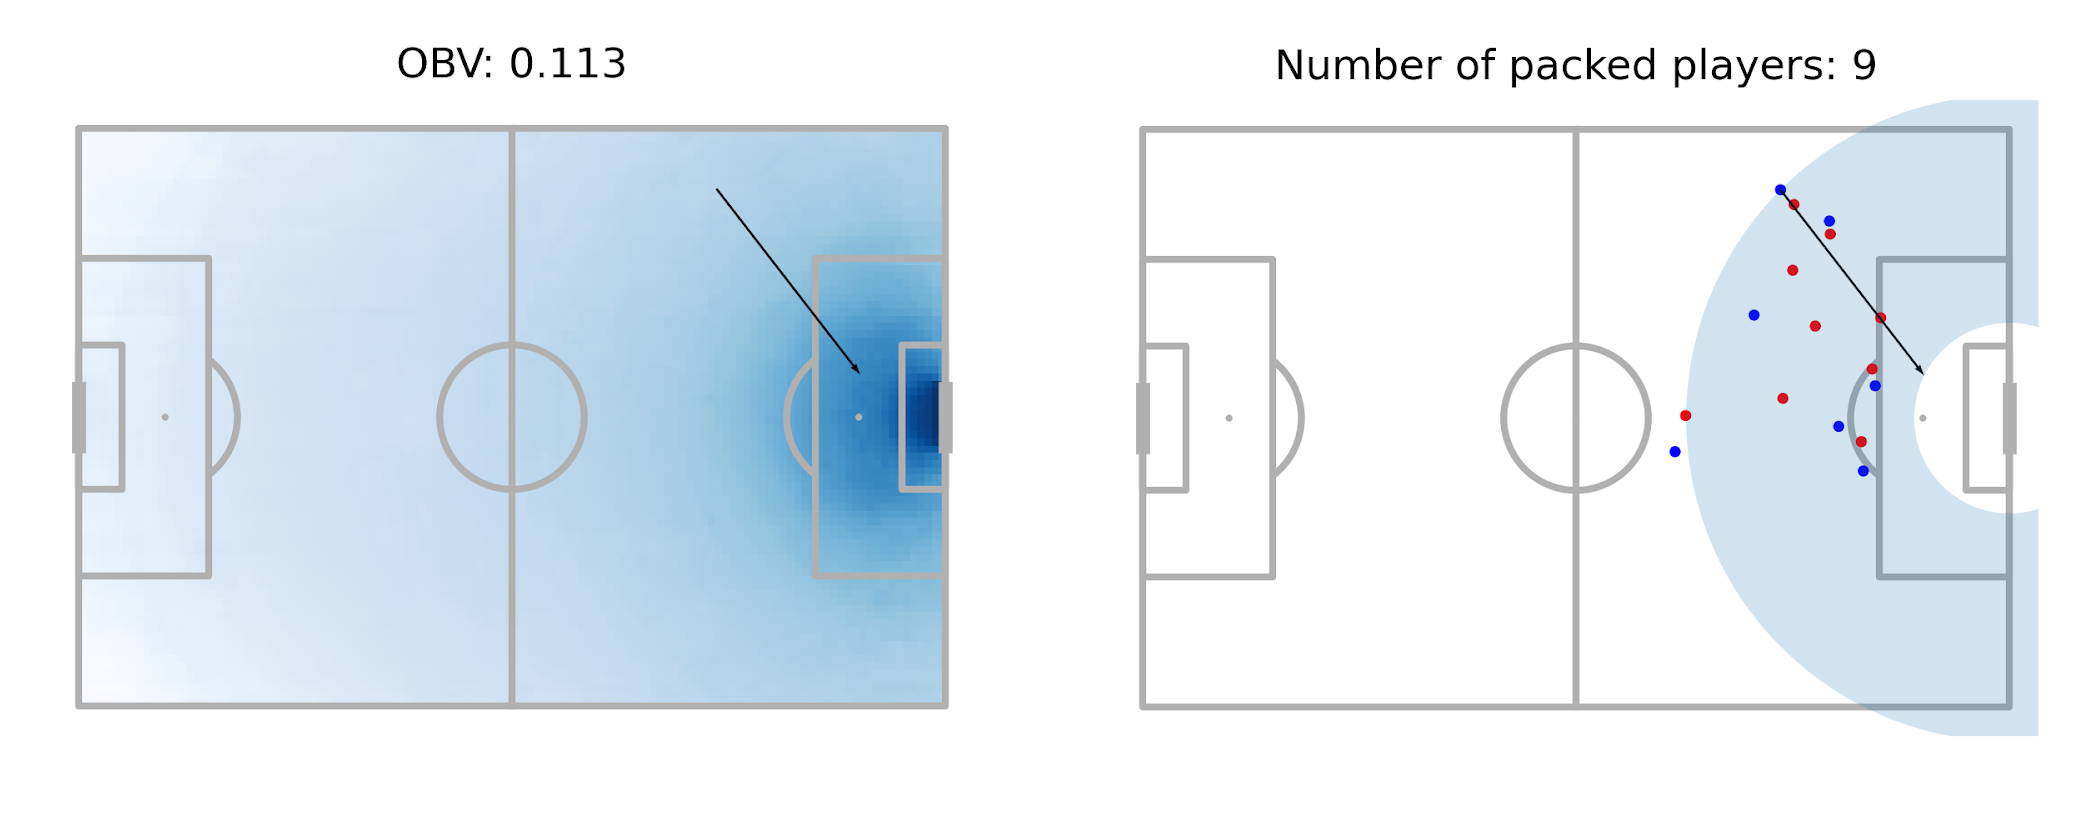
However, OBV, because it is blind to defender locations, values this much simpler pass very similarly:
Despite the conceptual merits of OBV, there was no objective, publicly accessible work comparing the relative importance of event and tracking-based information in evaluating passing value. We have performed a quantitative analysis to inform this comparison and deepen our understanding of different methods.
Methodology
Since all of the approaches are trying to evaluate the value of an action to a team, i.e. the extent to which it helps a player’s team to score, we’ll train a few models to assess the predictive power of different pieces of information that drive OBV and packing to see how predictive they are of teams going on to score downstream in a possession.
We’ll use generalised additive models (GAMs) to do this as they allow for non-linear relationships between the features and the target (so are more flexible than logistic regression) but are more robust to the choice of hyperparameters than, say, random forests or xgboost models. For getting a general idea of the predictiveness of each feature, simple models like GAMs should suffice.
Due to the limited availability of large datasets of positional/tracking data, we have developed a version of packing derived from StatsBomb 360 data for the comparisons against OBV. 360 data contains the location of every player around each event we collect from broadcast footage.
The dataset contains all successful, open play passes with 360 frames from the big 5 European leagues in the 2020/2021 season (around 1.1 million events). We’ll use various combinations of features derived either from the event or 360 data to predict the cumulative xG of the possession each pass belongs to. The model performance metrics will be computed 100 times by sampling binary goal outcomes using possession xG. We report the mean ± 2 standard deviations over the 100 resampled outcomes to obtain 95% confidence intervals around the predictive performance of a set of features.
It is important to note that this approach is not fully equivalent to a comparison with full packing data due to the partial visibility of the pitch in broadcast footage meaning that occasionally not all 22 players are accounted for in the 360 data. Having said that, the 360-derived packing numbers will be heavily correlated with full packing, so this comparison is still a useful indication of the relative predictive power of the factors that underpin OBV and packing, even if the results aren't definitively conclusive.
Results and discussion
Table 1: Model performance metrics.
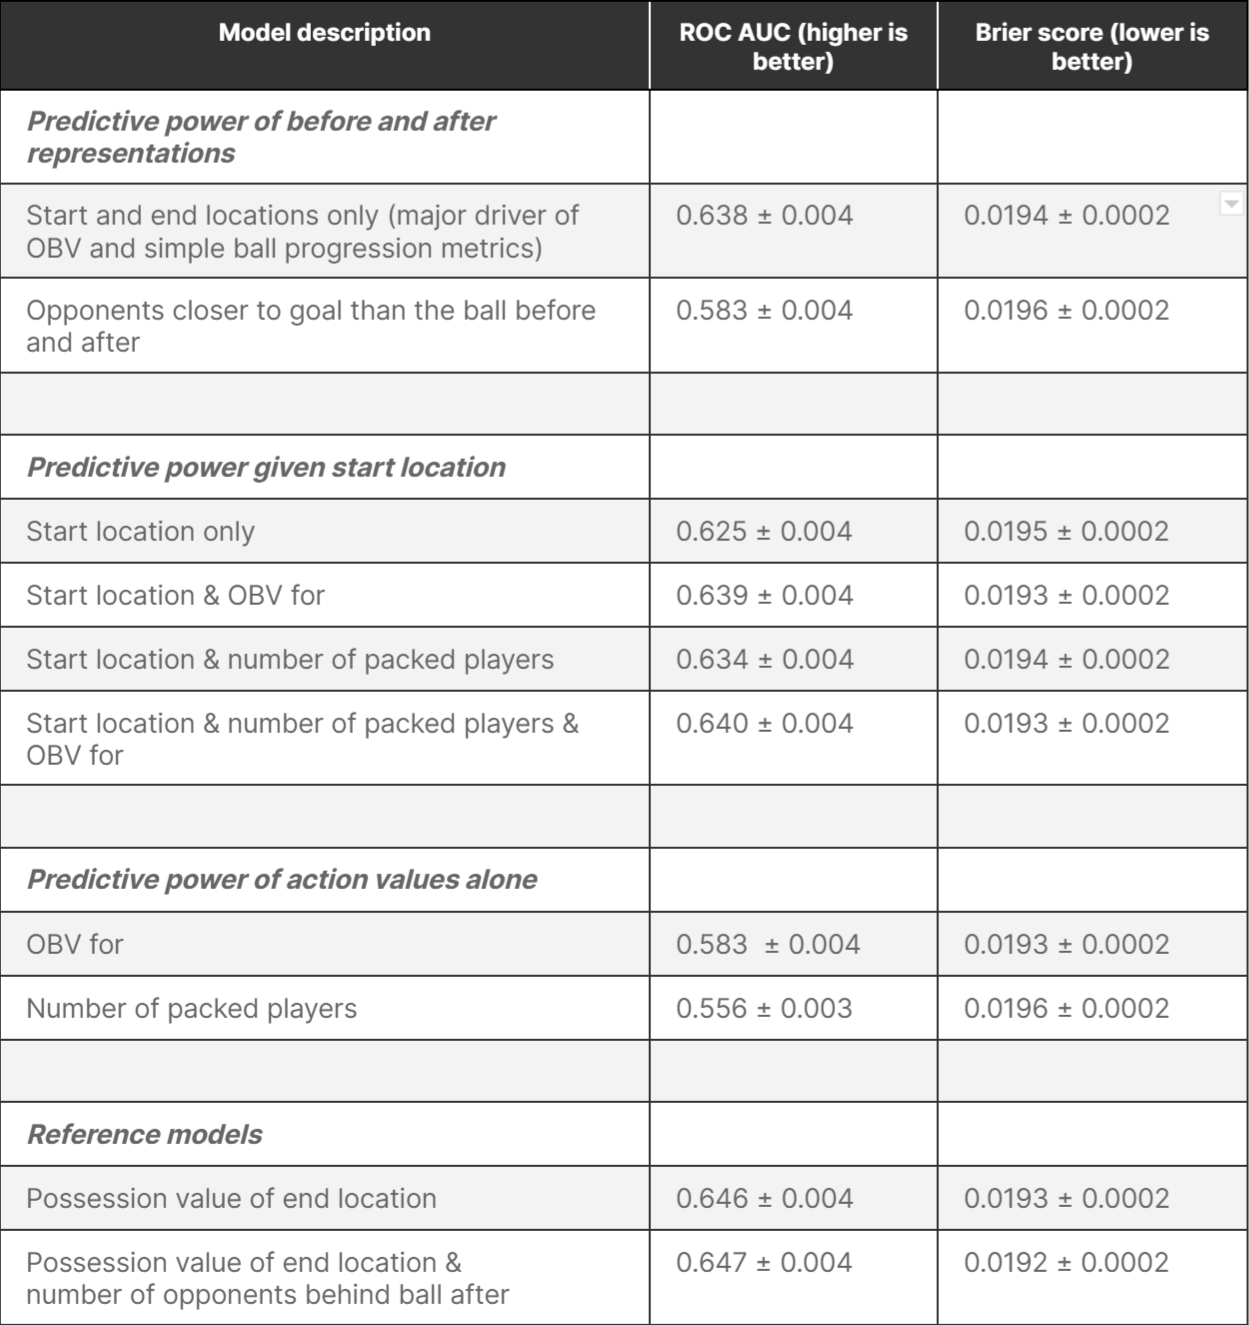
The ROC AUC measures how well a model can distinguish positive from negative cases (in this case passes that belong to a possession that ended in a goal vs those that don’t). A ROC AUC of 0.5 corresponds to assigning the same probability of a downstream goal to all passes, and a ROC AUC of 1 corresponds to perfect ordering of predictions (i.e. the predicted probabilities for passes that lead to goals is always higher than for those that don’t)
Models that include information about where on the pitch events are occurring have more predictive power than those that don’t. This suggests that the event locations capture most of the predictive power of progressive events in terms of how much they impact a team’s chances of scoring. Using only start and end locations is less predictive than the full OBV model (which also incorporates additional context about events).
We gain a similar amount of predictive power from both the OBV of the pass and the number of packed players, given the start location of the pass.
However, the increase in predictive power from adding the number of packed players to the existing OBV model is fairly small. This suggests that both OBV and packing are capturing similar information about whether or not a goal will be scored, so there's an indication that OBV already contains most of the predictive information that can be gleaned even if we were to include (360-derived) packing information in it.
This result appears to be consistent with previous work using different datasets. Bobby Gardiner found that packing was strongly correlated with progressive passing some time ago, and Kuba Michalczyk found that a binary line-breaking pass indicator could be predicted with a high degree of accuracy using purely event data.
The number of (360-derived) packed players on its own is predictive of subsequent goals, but not as predictive as OBV.
With the obvious caveats that we are not using packing numbers derived from full tracking data, it seems that 360-derived packing alone is less predictive than location-based or OBV-based features for predicting downstream goals within a possession.
Conclusion
We’ve discussed a number of qualitative and quantitative arguments around how we should measure ball progression and evaluate its utility to a team.
We think that valuing actions in football directly in terms of their (estimated) impact on goal scoring probabilities makes sense. We also found that (360-based) packing numbers alone are not as predictive of downstream goalscoring probabilities as we’d like, and that, in the aggregate, they don’t offer a great deal of benefit over event-based ways of measuring ball progression (in line with previous research around this topic).
This is not to say that the rich additional context provided by positional data is not useful, but in order to harness it, we probably need to go beyond packing.