By Ben Pugsley
1) Monday Night Football
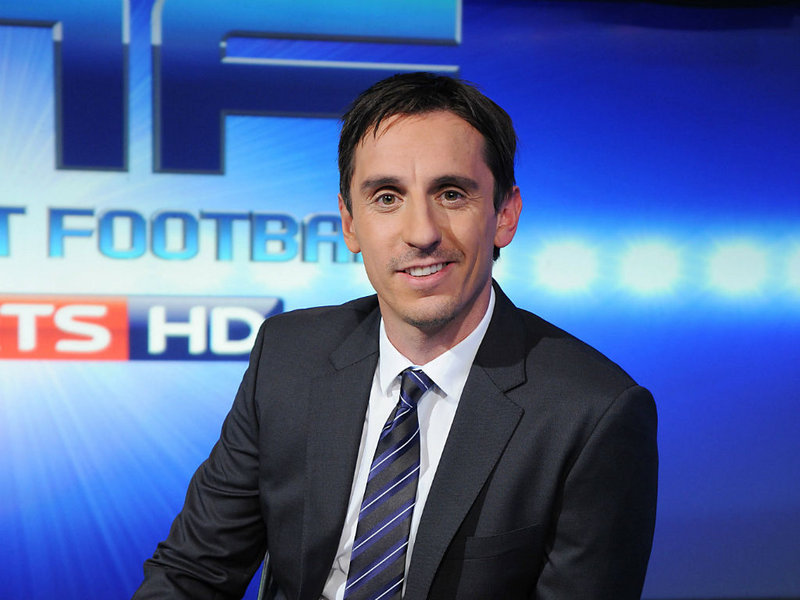
Remember a time when Monday Night Football was an afterthought? It is very far from an afterthought now. In fact, MNF is easily Sky's best football feature of the week. Ed Chamberlain anchors the program nicely, never overbearing or too talkative. The tech set-up is marvelous, but let's be honest - this is the Gary Neville show.
Neville is punchy in his analysis, short and concise in his explanations of the intricacies of the game of football. But it wasn't always this way. I distinctly recall Neville's debut on MNF, it was Man City v Swansea, and Neville looked nervous and uneasy, unsure of himself.
Neville has come a long way since then, and this gives us hope that Carragher can follow a similar path - initial nervousness and a steep learning curve, before finally settling in and becoming a pundit who can teach us as much about the game as Neville already has.
This is excellent.
2) Arsenal Win!
Panic over!
After an Arsenal loss in week 1 panic was rife. Wenger was lambasted for his failure to spend, the team wasn't good enough. Now, these arguments may have merit when looking at the bigger picture, but surely we can't draw such conclusions after a single game. Or even two games.
Arsenal may need to strengthen in order to compete for a place in the top 4 and the club does have issues when playing against quality opposition.
What Wenger excels at is setting up his teams to crush sub-par opposition.
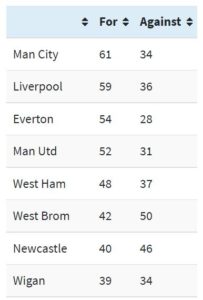
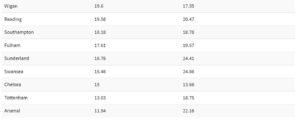
Arsenal's Fixture List With Opponents Shots on Target Ratio At The Time Of Fixture.

In 2012/13 Arsenal were a fine team when playing against opposition with a SoTR of less than 0.50. But problems arose when Arsenal played teams with a SoTR >0.50, a W 1 D 7 L 5 is testament to that.
In short, Arsenal's opening day loss to Villa may have simply been 'one of those results', Arsenal's win against Fulham was a return to normality and was completely expected. We shouldn't have read too much into the opening day loss and we shouldn't read too much into Arsenal's away win against what will likely be a sub-par shots team.
The above graph poses a question, though: Is Arsenal's failure to hold their own against >par SoTR teams a fault with Wenger's tactics, or do Arsenal simply not have enough quality players?
3) Final Third Passing Ratio
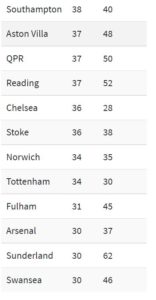
As usual, I am counting a huge amount of statistics for the Premier League in 2013/14. One of the new categories this year is Final Third Passes. Now if you count final third passes for and against we can calculate a plus/minus number. We can also calculate a teams ratio of final third passe. If you set your database up correctly you can also calculate home and away and moving averages for final third passes.
Here's what I have so far:
Final Third Passes
| Team | For | Against | + / - | Ratio |
|---|---|---|---|---|
| Man City | 368 | 137 | 231 | 72.87 |
| Everton | 372 | 182 | 190 | 67.15 |
| Tottenham | 302 | 187 | 115 | 61.76 |
| Liverpool | 337 | 216 | 121 | 60.94 |
| Southampton | 279 | 196 | 83 | 58.74 |
| Arsenal | 296 | 208 | 88 | 58.73 |
| Chelsea | 471 | 359 | 112 | 56.75 |
| West Ham | 248 | 215 | 33 | 53.56 |
| Sunderland | 242 | 218 | 24 | 52.61 |
| Man United | 284 | 292 | -8 | 49.31 |
| Swansea | 240 | 250 | -10 | 48.98 |
| Norwich | 266 | 299 | -33 | 47.08 |
| Newcastle | 201 | 262 | -61 | 43.41 |
| Stoke | 204 | 290 | -86 | 41.3 |
| Aston Villa | 308 | 452 | -144 | 40.53 |
| Palace | 194 | 288 | -94 | 40.25 |
| Hull | 210 | 332 | -122 | 38.75 |
| Fulham | 191 | 302 | -111 | 38.74 |
| West Brom | 187 | 312 | -125 | 37.47 |
| Cardiff | 151 | 354 | -203 | 29.9 |
In the coming weeks I will explain in a little more detail just how we can use final third passes to evaluate a team strength.
4) Man City And Corners
Joe Hart and his Manchester City team-mates are taking a little heat right now for the 3-2 loss at Cardiff. That loss featured two Cardiff goals from just three corners. You probably don't need me to tell you how rare conceding two goals from corners is in a single game. It's rare. By my count, Man United (away at Reading) and Man City (vs Ajax) are just two of the teams who managed the infamous feat last year.
Both of Cardiff's corner goals were created by excellent deliveries into the box, with Hart looking to be particularly culpable for Cardiff's goal that gave the Bluebirds the lead. I don't think anyone should over-react to the two goals that were conceded. Zabaletta switched off for Cardiff's first corner goal and Lescott, surprisingly, was beaten to the ball on the second corner goal. Neither of those lapses by Zabaletta or Lescott are common occurences.
Shit happens, conceding two set piece goals in a single game likely won't happen again all season. More on City defending those corneres can be found here (link).
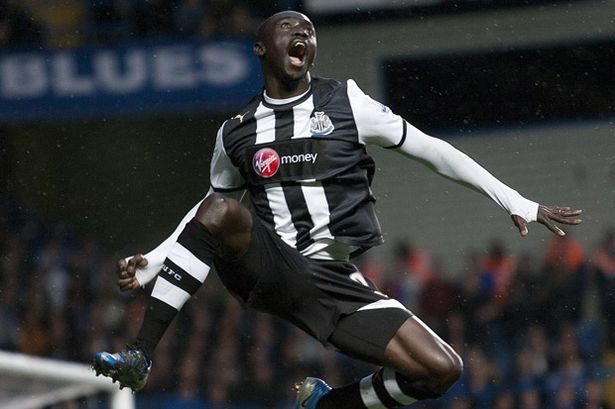
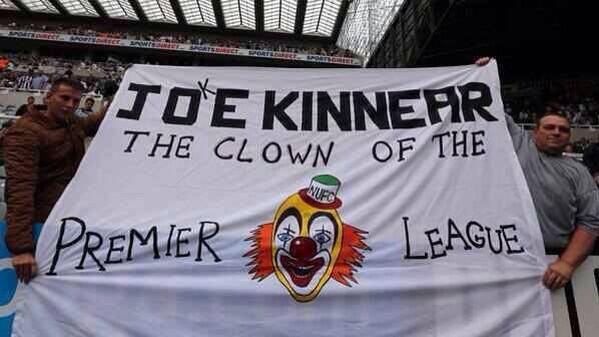
5) Newcastle Zzzzz
There are a lot of interesting things going on at Newcastle, Kinnear, lack of transfer spend, Pardew's job security. Unfortunately none of these things are taking place on the pitch, where Newcastle are doing their best 'early season Sunderland 12/13 impression'.
Newcastle have had just one shot on target in ~190 minutes of football this season. I can forgive them for the away trip to Man City, red card and hammerings et cetera, but West Ham were an easy game for a home team in 12/13 and I suspect they may well be an easy game once again in 2013/14.
Newcastle are at home to Fulham next Saturday. If Newcastle don't win, or at least put on an improved offensive display against another poor travelling team, then the polite early season atmosphere may become more toxic than darkly humorous.
6) One Nil To The Arsenal Spurs & Liverpool
Spurs and Liverpool both have six points on the board from their two games played, and although both teams may have been far from impressive in racking up their points totals, a win is a win. It is also worth noting that the early part of any season is a minefield. We have promoted teams, new managers and new players to bed in to new systems.
The newness can make early season form difficult to predict and considering Tottenham have the Bale distraction and about 39 new players to bed in, their results are just fine. Liverpool, well, they have new signings to integrate and are currently playing without their best player who, despite some of the protestations of the analytics community, will improve this team upon his return.
A win is a win at this early stage, worry about the underlying performance indicators after 7 or 8 games or so.
7) Gareth Bale
The Welsh Ronaldo. The shots volume monster. The one man team. I have written more words about Gareth Bale in 10 Points than any other player. I have been a huge admirer of Bale since I first created this weekend round-up - I implored City to buy him as early as last January - and these may be some of the last words I write about the player for the transfer deadline is approaching fast.
You know, Bale may shoot too much, he may be a greedy bastard, some of his goals scored may regress from last seasons high, but I still think this is a beauty of a player. He is 24, has all the physical skills that are so pleasing on the eye and Tottenham, although they have bought well, may have a hard time replacing his performance.
This (link) by the super smart @halfagain touches on the difficultly of replacing a outstanding player:
However, there’s another measure of value in football, one that’s ultimately more important: value per minute of available playing time. While their respective contracts and transfer purchase prices (Jovetic + Negredo < Cavani in total), will likely prove better value per dollar, and perhaps higher in absolute production, it requires minutes from two putative starter-ish players, rather than the minutes from one position.
If we replace Cavani with Bale and Jovetic & Negredo with Lamela and Soldado then the above quote clearly highlights the difficulty in replacing a superstars performance per minutes played. It may take two players to replace Bale's performance and that likely means an minutes played efficiency loss for Tottenham.
I'm gonna miss Bale, 40 yard shots and all. He is a rare, exciting talent who is technically out of this world and the Premier League will be a poorer without him. Or......he may well stay at Spurs for one more season. My Lord.
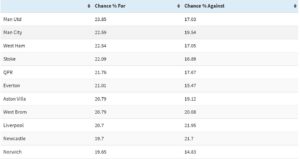
8) Shots On Target % Rating
Bear with me on this one. Over the last year or so I have ran Shooting Accuracy% (SoT%) for and against, this is simply shots on target/total shots. Shooting Accuracy% (SoT%) measures how efficient a team is ast getting it's shots on net and preventing the opposition from doing likewise.
This is where Shots On Target % Rating comes in. To calculate the rating we take each teams SoT% for and add it to that teams SoT% prevention number (if the opposition has 10 shots and 3 of them are on target the prevention% is 70%).
Add the SoT% to the SoT Prevention% and we end up with a table like the one below.
Week 2
| SoT% Rating | |
| West Ham | 117.26 |
| Palace | 117.11 |
| Southampton | 114.95 |
| Aston Villa | 111.43 |
| Everton | 109.05 |
| Fulham | 108.1 |
| Liverpool | 107.86 |
| Swansea | 102.98 |
| Stoke | 102.97 |
| Man United | 102.31 |
| Cardiff | 102.1 |
| Man City | 101.59 |
| Hull | 100.79 |
| Chelsea | 97.49 |
| Norwich | 95.24 |
| Arsenal | 90.09 |
| Sunderland | 88.87 |
| West Brom | 80 |
| Tottenham | 58.97 |
| Newcastle | 58.61 |
Yes, Tottenham's number is correct. League average rating is 100, and although we are only two weeks into the season some teams have a nice rating number.
This may well be something I come back to once a few (8) more game weeks have elapsed. I have these numbers by Game State too, which may well tell us some cool things about score effects and defensive shells. Again, we'd need more data first.
Any thoughts?
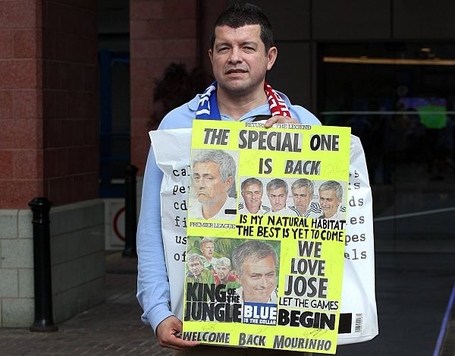
9) Kolo Toure
I don't really know what is going on here, but I liked it. Via @Green_Scouser Obviously I was struggling to fill point #9!
10) Goal Of The Week
An honourable mention to Danny Sturridge but Dzeko takes it. A slight deflection?