The Summer of 2013 in football analytics was dominated by strikers shots performance and their conversion%'s. Colin Trainor and Constantinos Chappas created their Expected goals metric (link), the 11tegen11 was the first to look at expected goals and, more recently, Devin Pleuler has begun tweeting out information on expected chance quality.
Added to those smart pieces of work was information on shot quality and shot location (Colin Trainor) and all in all it was a tremendous leap forward in the investigation of quantifying striker performance. The one question I have with some of this work is repeatability or test-retest reliability over a number of seasons.
Now, I know it's not an entirely fair question as a lot of the data that these new metrics are built with is, well, relatively new. We don't have 4 years of shot location data or shot placement data. Still, I wanted to know something about the ability of a striker to repeat a previous seasons performance. I have a little historical data on strikers so I thought I would take a look at which aspects of a strikers performance are repeatable and which are not.
These are the metrics I will be focusing on, all penalty goals and shots are removed:
- Scoring% (goals/SoT)
- Shooting Accuracy% (SoT/Total Shots)
- Goals Per 90
- Assists Per 90
- Shots Per 90
- Shots On Target Per 90
I searched through my database for strikers who played in the Premier League in consecutive seasons (year 1 to year 2) and found 174 data points, some of the outlying data points will be removed on certain charts. What we are looking for is a relationship between a strikers performance by a given metric between yr 1 and yr 2 (2011/12 to 2012/13 for example).
In short, are players who post, say, a high scoring% in year 1 likely to repeat that performance in year 2. There are some interesting results. I'll start with the metrics that have the strongest year to year correlation.
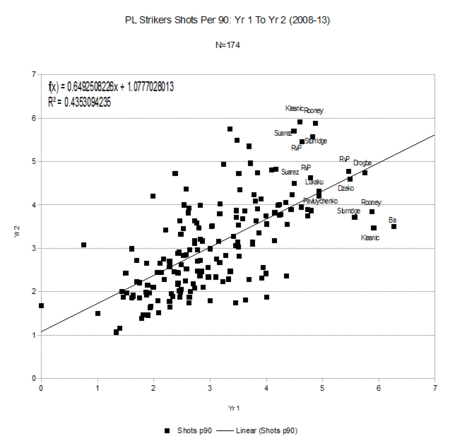
Shots Per 90. R2=0.435
Shots per 90 has an R2 of 0.435 and although the correlation isn't all that impressive, it's the strongest correlation between year 1 and year 2 of any of our metrics listed in the introduction. If you are going to pick out any aspect of a strikers performance that may be repeatable year-on-year then shots per 90 should be the metric you use.
A striker is more likely to reproduce his shot volume year on year than any other countable aspect of his performance.
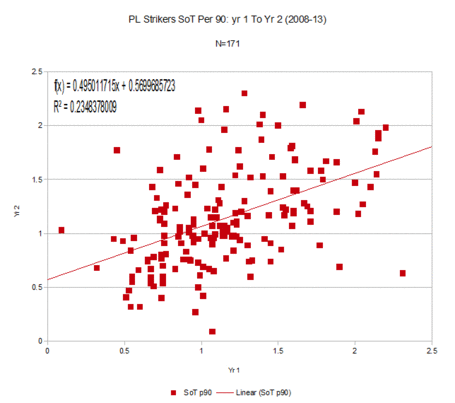
Shot On Target Per 90. R2=0.234
Shots on target per 90 is is the second most repeatable aspect of a strikers performance, although the correlation between year 1 and year 2 has dropped sharply. SoT per 90 has a correlation of 0.242, and although that number is far from impressive, it's out of this world compared to some of the correlations you will see shortly.
I've long said that shots and shots on target are the two metrics I would prefer to use in order to predict a strikers future performance. I wouldn't want to use goals scored or scoring% for we know these regress heavily. The correlations above, and below, bear this out.
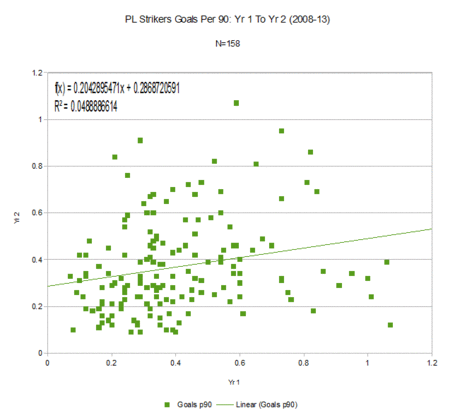
Goals Per 90. R2=0.048
Outliers have been stripped out.
This chart is simply all over the place, the year-to-year correlation is virtual non-existent. There are obviously outliers here, players who can reproduce goals per 90 year-on-year but those players are mighty rare, even in the Premier League.
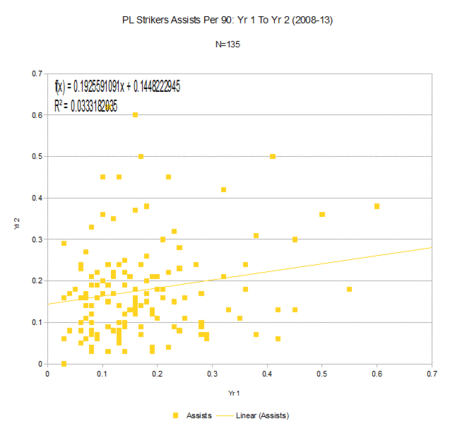
Assists Per 90. R2=0.033
Again, I removed the outliers who didn't record an assists in yr 1 or yr 2.
This is a pretty similar chart to the Goals per 90 one featured above. It's a mess, there's little repeatability in comparison to shots or shots on target.
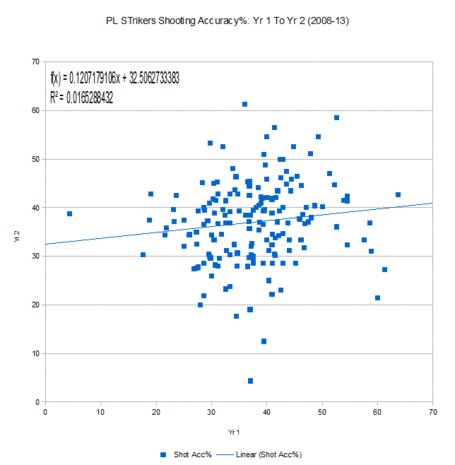
Shooting Accuracy%. R2=0.0165
This is shooting accuracy%/SoT%. It's another scattered set of data of points with virtually zero repeatability. This is the one metric that stunned me a little for I was always under the impression that a striker had some control, some form of skill in getting a certain percentage of his total shots on target. Obviously not.
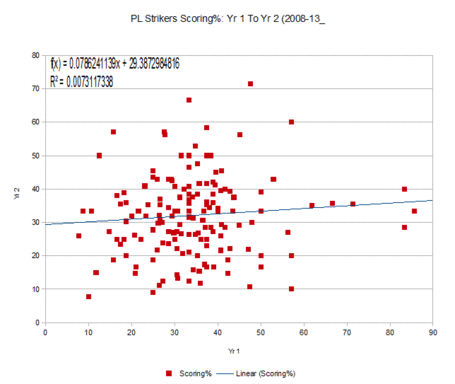
Scoring%. R2=0.0073
Finally, we get to scoring% which is goals/shots on target.
I removed the extreme scoring% outliers by controlling for a minimum number of shots. Scoring% is not to be confused with Shooting%/Conversion% which uses Total SHots and not Shots on Target.
There is virtually zero relationship between a striker managing to convert his shots on target into goals in year 1 to year 2. We have sent out warnings before about backing strikers who rode high scoring%'s to their impressive goal tally.
A quick recap: don't bet on a striker who had a high scoring% in year 1 to repeat that percentage in year 2. This likely means a drop in goals scored, unless the players shots on target per 90 can be boosted. Scoring% is random, it's true in football and it's true in hockey.
Conclusion
There isn't one metric that we use to evaluate strikers that has a particularly high level of repeatability from one year to the next. But if we are to choose any of the metrics to try and predict future performance then shots per90 and shots on target per 90 are clearly the two we should use. The percentage metrics - shooting accuracy% and scoring% - are, to borrow a turn of phrase from MC79, a crapshoot.
We know these metrics are predominantly luck driven, we know they regress heavily and it would be folly to predict the future performance of a striker using either of those metrics. Would controlling for the location of shots, say in box shots only, strengthen the correlation between yr 1 and yr 2 scoring%?
I would have thought so, but @footballfactman ran the numbers and central in-box shooting% (goals/total shots) had an r2 of just 0.02. One last time, if we are looking for a repeatable aspect of striker performance, then all roads point us in the direction of a players shots and shots on target, not his goals per90 or shooting accuracy% or even a players scoring%.
