Defensive measures are a peculiar thing.
Unlike attacking measures, where it is accepted that more is better (think of shots or possession), the same logic just doesn’t hold true for defensive metrics. In this piece I’m going to concentrate on interceptions and tackles as the main defensive measures.
In essence a tackle is pressing the man in possession of the ball whereas an interception is caused by a player anticipating where the ball will be played and moving into its line.
In other words:
Tackle = Pressure on Man
Interception = Pressure on Ball
Current Metrics
If you lead the league in numbers of tackles or interceptions does that mean that you are very good at tackling or making interceptions?
It may do, but it may also mean that your team is so bad at holding onto possession that you get substantially more opportunities to attack both the ball and the man than better teams do.
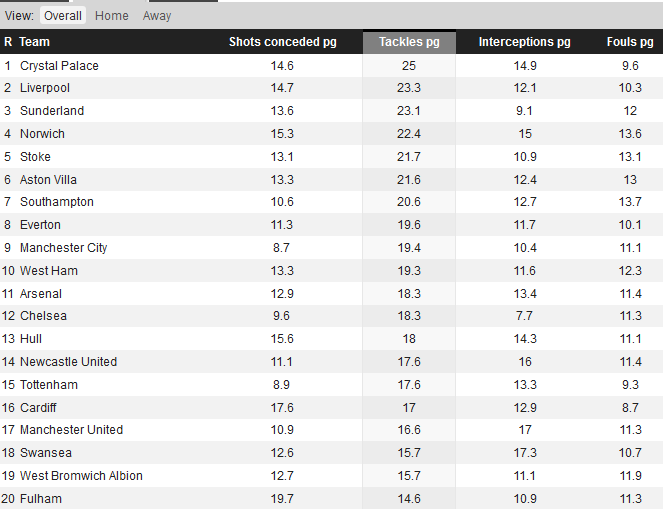
Here, courtesy of whoscored, is the current EPL table for tackles, and it has been ranked in descending order.
Is Crystal Palace really the best team at tackling in the Premier League?
No, I don’t believe they are, and this is the point. There has been a lot of work in the last year or so on the attacking metrics in football (examples include Expected Goal values, per90 figures and shots from Prime locations) but so far the defensive side of the game has been largely ignored. There are many reasons for this, including defending being more about a team unit than individual actions and positioning data arguably being more important in trying to understand defence than attack. But in my opinion there is another more basic problem with trying to ensure that people begin to look at the defensive side of the game from an analytical point of view. According to wikipedia, a league table is defined as:
"A league table is a chart or list which compares sports teams ….. by ranking them in order of ability or achievement.”
Due to the metric that is currently common place, the use of absolute values, the league tables that rank defensive measures don’t achieve their basic intention, ie ranking the teams in order of ability. This is a fundamental flaw and one that needs to be eradicated.
In order to achieve the aim of ranking teams on ability, a different system of measuring the defensive actions needs to be introduced. We need to normalise the defensive actions carried out by each team.
Normalising Defensive Actions
I propose normalising the defensive actions by reference to the number of passes that each team concede. A tackle or interception can only be attempted when the opposition is in possession of the ball. So by looking at defensive or pressing actions compared to the number of passes that each team conceded we will have a fair basis on which we can rate each team’s ability to tackle or win the ball via an interception.
The table below shows the total number of Interceptions, Tackles, Combined Pressing Actions (sum of Tackles & Interceptions) as well the number of passes conceded by each team during the first 7 games of the 2013/14 EPL season.
The stats for the above table have come from StatsZone and Whoscored, both of which are powered by Opta
PAPI – Passes allowed per Interception
PAPT – Passes allowed per Tackle
PAPPA– Passes allowed per Pressing Action
The final 3 columns in the table show the number of passes that each team has conceded on average for every interception, tackle and combined pressing action (either an interception or a tackle) they have made.
NOTE – In the final 3 columns in the above table the lower the number the better, ie teams allow fewer passes before they perform the Pressing Action.
Take Arsenal as an example. On average they have made an interception every 33 passes they have allowed, a tackle every 24 passes and either a tackle or an interception every 14 passes.
Feel free to play around with the table by sorting the various columns.
Tackles
Revisiting the Tackles table as presented by whoscored we remember that Crystal palace topped the table. Using the PAPT (Passes allowed per Tackle) measure I would suggest that 6th place would actually be a fairer reflection of their tackling prowess. The team that allows the fewest number of passes (less than 18) before they are able to get at tackle in is Southampton. This fact instinctively seems correct as the Southampton manager, Maurico Pochettino, insists on a high press in an attempt to ensure that the Saints win the ball back quickly.
Other teams to note are Man City, Liverpool and Everton who just trail behind Southampton in their efforts to put the opposition under pressure by way of tackling.
At the wrong end of the scale is Fulham who need to see 33 passes being made against them before they are able to apply pressure to the man in possession (tackle). Perhaps this can help us to understand just why Fulham have been so poor this season.
It is understandable that teams with lower budgets struggle from an attacking point of view, but it is much more difficult to understand why teams such as Fulham and West Brom are so far behind on their tackling rates. The type of player that can make an impact on how often a team can tackle can be obtained for fractions of the cost of top attacking talent.
Interceptions
Man United top the Interceptions table by snaffling the ball once every 23 passes. Interestingly, there have been approximately 50% more tackles than interceptions in the EPL so far this season, yet the top two teams on the PAPI (Passes allowed per Interception) metric, Man United and Swansea, actually managed to achieve more interceptions than tackles. This fact is quite significant and it perhaps suggests that these two teams play on the counter attack by being more interested in breaking up the opposition’s attack by way of an interception which should then lead to a more effective counter of their own.
Seeing Chelsea right at the bottom of the PAPI table seems like a surprise. It’s not normal to see one of the stronger teams at the bottom of any league table. Unfortunately for Sunderland, the same can’t be said of them and they hold the same place in the PAPI table as they do in the real league table.
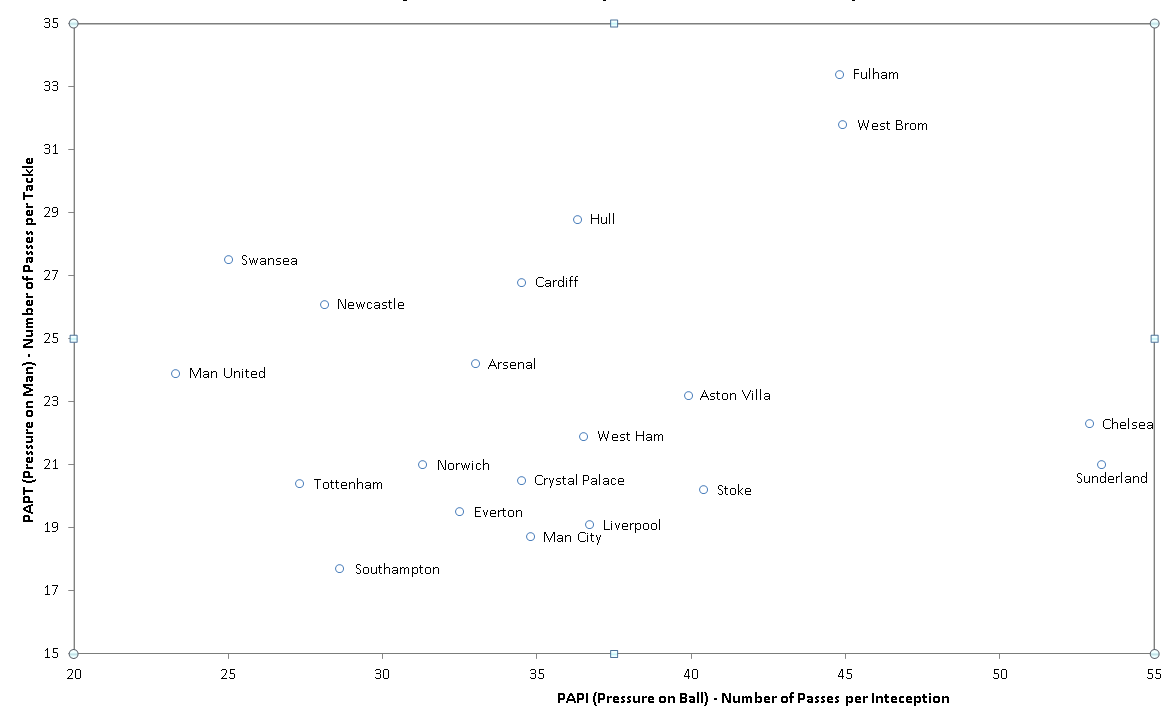
The teams’ style of defence can be quickly seen and compared in this Scatter Plot:
(The chart can be clicked and opened in a separate window for clearer viewing)
Visually a few things jump out at us from that image.
- Chelsea and Sunderland defend using the same styles?
- As a Mourinho team (counter attacking) I wouldn’t have expected to see Chelsea’s with virtually the most infrequent rate of interceptions – they are at the opposite end of the scale to Man United.
- Fulham and West Brom defend in the same way. By this I mean they neither pressurise the ball nor the man.
- Swansea and Southampton are often grouped together as being pressing exponents, but it is clear that, at least over the opening 7 games, Swansea put much less pressure on the man in possession than they do the ball.
Combined Measure
The PAPPA (Passes allowed per Pressing Action) is an aggregated measure that tells us how aggressive a team is in defence on the basis of both tackling and forcing interceptions.
As with the PAPT table, Southampton takes pride of place at the top of the heap and they are being chased up by AVB’s Tottenham with Man United close behind in 3rd place.
Foundation
The figures presented in this piece are the foundation that I believe will lead to further analysis, quantification and understanding of defensive styles and strategies. The hope is that metrics that actually mean something are brought into use on the defensive side of the game. Undoubtedly this will then encourage a deeper understanding of how teams defend and the merits of each type of defensive system.
For example, Liverpool and Man City seem to have plenty of aggression which allows them to execute tackles at a high rate (pressure on the man), but they don’t feature as prominently in the PAPI (pressure on the ball) rankings. Man United are the opposite and then there are teams like Southampton, Tottenham and Everton who are fairly aggressive in both defensive facets.
Are there defined strategies at work here, or with just 7 games played is there still an element of variance in the numbers in these tables? Time will tell.
Conclusion
I’m conscious that there are many ways to defend, and teams that employ an aggressive high press will tend to appear at the top of these metrics. That’s not to say that this is the correct way to defend.
The aim of this piece was to begin to quantify and attempt to develop the use of meaningful defensive metrics. As a result we at least can understand show many more passes a team will be allowed to take if they play against a deep lying passive defence (Sunderland) compared to a high energy tacking defence (Southampton) and we can think about making informed decisions about which defensive style is appropriate.


