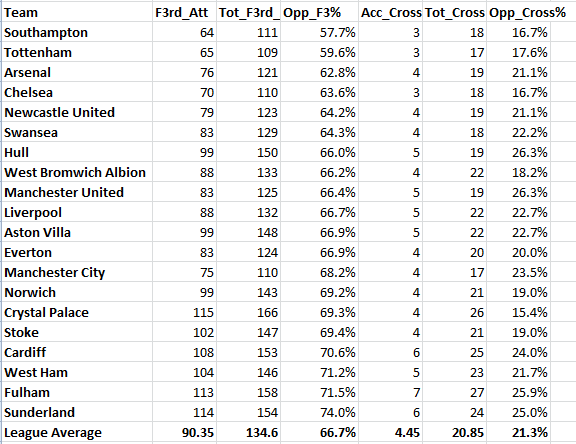
Defense is probably the most important element to focus on in football. It’s important for title winners. (*Glances toward Liverpool* Okay, most title winners.) And it’s really important when trying not to get relegated. Yet our understanding of defense, or even the various ways we track it statistically, is awful. We have almost nothing to go by when evaluating team play except goals and shots conceded. Do tackles matter? Do interceptions? Clearances? Blocks? There’s research going on in these areas, but needless to say, this has been bugging me for a while and I’m not happy with the breadth of the data we currently evaluate. Today I want to simply introduce a couple of additional defensive metrics we should be examining at the team level. This is not rocket science stuff – it’s basic info that up to this point most people have not had access to. Tomorrow I’ll start layering in some additional contextual info, plus adding some historic data, and maybe at some point we can draw conclusions. For now, just check it out and see what you think. (Note: all of this assumes that I sliced and diced the data correctly. That may be a large assumption. I don’t have any real baselines to compare to, but these mostly pass the eyeball test.) Opponent Passing Percentage So we track how well teams pass the ball, but for whatever reason, the inverse information is not available anywhere. If passing and possession are part of attack and game control, then preventing your opponents from doing the same should also be important. Here is the EPL table for opponent passing percentage through April 21st. 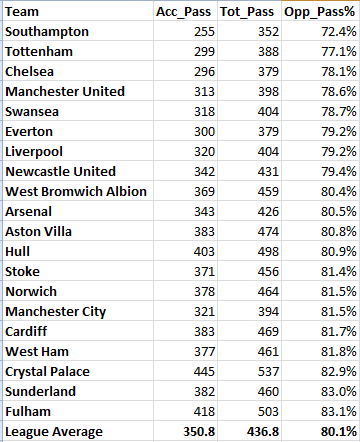 So this table looks at accurate opposition passes, total opposition passes, and the percentage, all on a per game average basis. Seven of the bottom eight teams have been relegation candidates at one point this season. The other team in that bottom eight… are small favorites to win the league. Ooookay. What about if we look at this same metric in Germany?
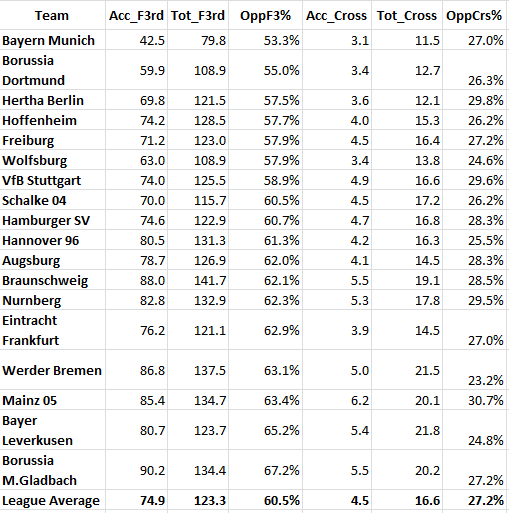
 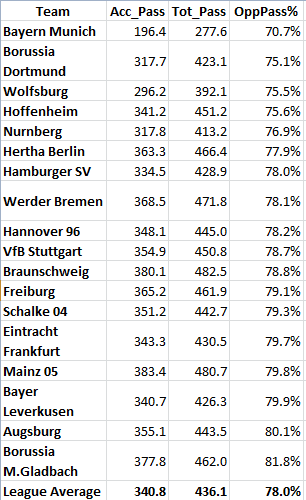 The top 3 teams here have either clinched a Champions League spot or are battling for the final one. But the bottom 4 are battling for European slots as well. Hrm… How about Spain?
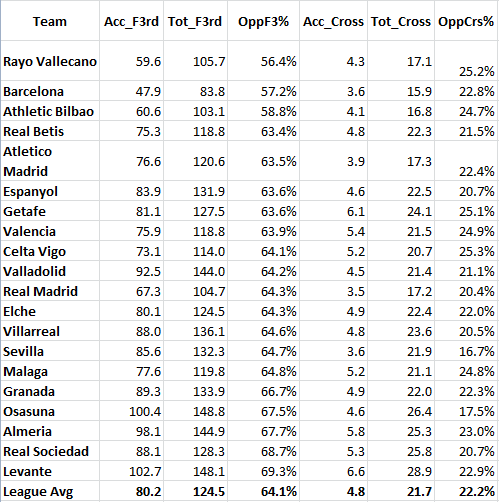
 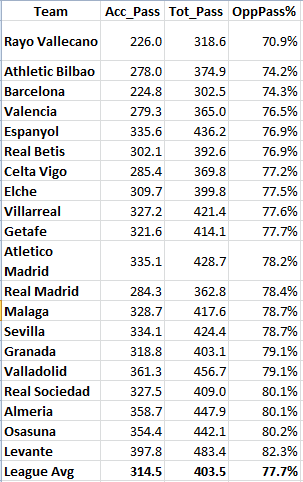 Rayo, Bilbao, and Barcelona all have pretty hefty deviations from the mean in the positive direction, but beyond that I don’t see much to draw on. Right now we don't know how much this correlates to other defensive metrics like goals and shots allowed. It may be that this tells you more about style of defense, and which teams employ a regular press, but it's something for people to explore in the future. Opponent Final Third Accuracy Obviously what happens in the final third is the most important bit defensively, but different teams employ different tactical schemes to try and prevent their opponents from being effective. Does that show through in these stats?
 Anyway, expect to see more about this type of stuff from us (and hopefully others) in the future.
2014
Building Better Defensive Metrics – Opponent Passing
By admin
|
April 29, 2014
