The rules of football are very clear. Law 7, “The Duration of the Match” states that “A match lasts for two equal halves of 45 minutes”. The rules also make an “Allowance for Time Lost”, in which they list the following scenarios where allowance should be made for all time lost due to:
- substitutions
- assessment and/or removal of injured players
- wasting time
- disciplinary sanctions
- stoppages for drinks or other medical reasons
- any other cause, including any significant delay to a restart (e.g. goal celebrations)
It appears that, according to the rules, no allowance is to be made when the ball goes dead (ie. out for a goal kick, corner, throw-in or for the award of a free kick), unless the referee deems that there has been a significant delay to the restart. It therefore follows that the rules makers never intended there to be 90 minutes of actual play, but due to the combination of a varying number of dead ball events, differing interpretations of what represents “a significant delay to a restart” as well as the leniency (or otherwise) of the referee with respect to time wasting we are now in a position that the amount of actual playing time from one game to the next can fluctuate wildly. These fluctuations can be seen between one league and another, but they can also be seen from game to game within the same league.
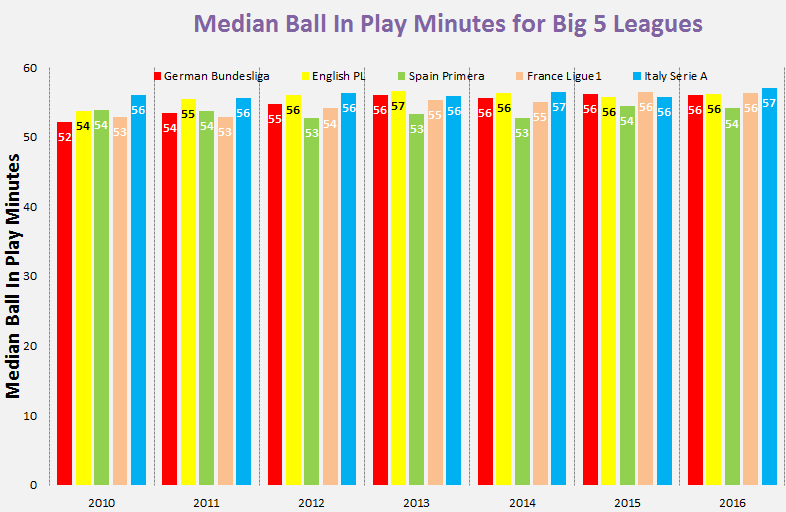
The image below shows the median time, in minutes, that the ball was in play for in each of the traditional Big 5 European leagues since the 2010/11 season:
The first thing to note is that the median Ball In Play (BIP) value across all leagues never exceeds 57 minutes (the minutes values displayed on the chart are rounded to the closest minute).
Almost 90% of games have an effective BIP duration of less than 60 minutes. That, typically, more than 1/3rd of the allotted playing time per the rules of the game witnesses no action on the pitch isn't very intuitive. Is that what the rules makers intended when the laws of the game were laid down?
If we look at the last two or three seasons we see that the Spanish Primera Liga is an outlier in terms of the actual time played when compared to the other leagues. While the other four leagues have a median observed BIP time of 56 – 57 minutes the Spanish league typically sees 2 – 3 minutes less actual playing time per game.
How Much Time is Actually Added On?
Although, excluding Spain, there is a certain consistency in the actual minutes of football played between the leagues, the leagues follow a very different path in arriving at their typical 56 – 57 minutes of action.
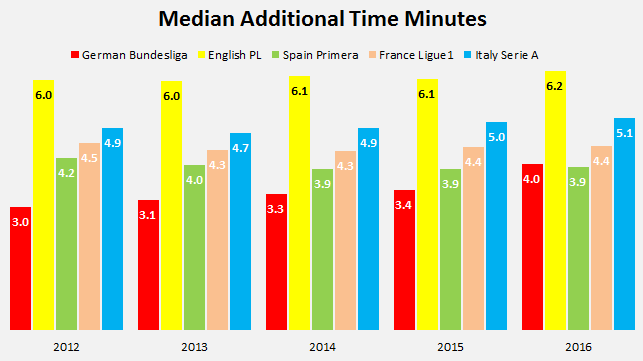
The chart below shows the median amount of time that is played over and above the mandated 90 minutes. Note that this is not the time that the fourth official displays on the board, but the actual time that is added on.
To give an example: A fictitious game sees the first half end with 46mins 20 secs gone on the clock and the second half end at 94mins exactly. The amount of additional time actually played in this game was 5mins 20 secs (or 5.33 minutes).
We can see that each of the last 5 seasons follows a similar pattern in terms of additional time played across the leagues.
Games in the English Premier League consistently see much more additional time played than in the other leagues. It’s interesting that despite, on average, playing one more minute additional time than the other leagues, the English Premier League doesn’t actually see a greater amount of playing time. This additional amount of time added on is merely needed to match the other leagues in achieving a BIP time of 56 minutes.
Following the EPL, we see that Italy consistently has a median value of additional time of approximately 5 minutes per game, with France following slightly behind with about 4.5 minutes.
The amount of additional time added on to Spanish La Liga matches is revealing.
We saw in the first chart that Spanish games consistently see the lowest amounts of time that the ball is actually in play. So, unlike in England, the Spanish referees are not adding on sufficient amounts of injury time at the end of each half. In comparison with the other leagues, it would appear that the Spanish arbiters should be playing another couple of minutes additional time per game.
Despite less additional time being played in Germany, fans of the Bundesliga haven’t witnessed (at least for the last 3 or 4 seasons) less minutes of actual playing time than their European peers. By definition, this can only be due to a lower duration of stoppages during the regular 90 minutes.
1st Half Additional Time
I wanted to take a look at how the additional time is apportioned over the two halves.
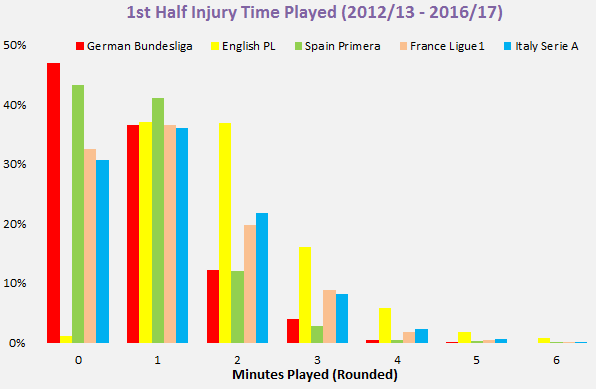
The chart below shows the distribution of time that each league has added on at the end of their first halves over the last 5 seasons. For display purposes, the amount of additional time has been rounded to the nearest minute in the following charts.
47% of German Bundesliga games had less than 30 seconds added on to the end of the first half; this compares with just 1% of English Premier League games. Here we can see the first part of Spain’s issue re the lack of additional time; 43% of Spanish games has less than 30 seconds added on at the end of the first half. In fact, 85% of Spanish games had less than 1.5 minutes of first half additional time; this compares rather unfavourably with England’s equivalent figure of just 38% of games.
The Spanish whistlers also seem loathe to play more than 2.5 minutes of first half additional time. Only 3.6% of Primera league games seen its clock tick round to 47mins 30secs. Even the German Bundesliga has a greater percentage of first halves lasting longer than that; and almost 25% of EPL games seen additional time of at least that duration.
No matter how we slice this, it’s clear that playing a fairly short amount of added time is just a thing that the Spanish top flight does.
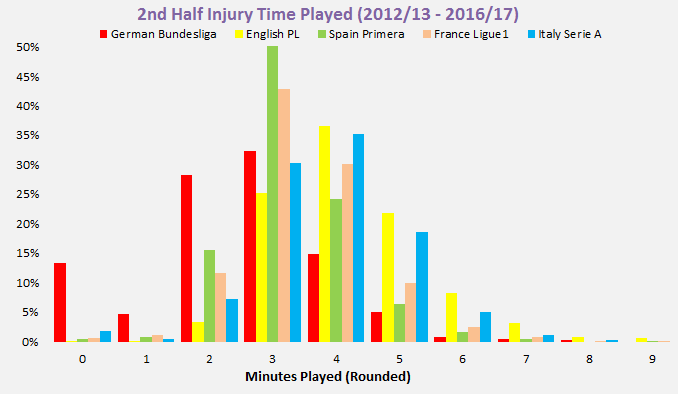
2nd Half Additional Time Below is a similar chart, this time looking at the 2nd halves of games:
I have previously read on my Twitter timeline of the default 3 minutes additional time shown the end of games in Spain. The analysis undertaken for this article has shown this assertion to have considerable merit as just over 50% of Spanish top flight games had 3 minutes (rounded) of additional time played at the end of the second half.
The German Bundesliga displays similar 2nd half tendencies as we seen earlier when looking at the 1st halves. I was somewhat surprised to see that 13% of Bundesliga games had less than 30 seconds additional time played at the end of the game. In fact that we find that almost half of all German Bundesliga games play less than 2.5 minutes of additional time once the 90 minutes are up; compare this with only 1 in 30 EPL games having less than 2.5 minutes 2nd half additional time!
England and, to a lesser extent, Italy are the two leagues where its spectators are most likely to see more than 3.5 minutes of additional time played in the 2nd half. This analysis would suggest that Spanish fans deserve to see longer periods of additional time played at the end of each half, but for whatever reason they just aren't getting it.
English Premier League
Thus far, I have implied that English Premier League referees are doing a pretty good job (compared with the other leagues) with their timekeeping as they generally play the greatest amount of additional time. This ensures that the typical EPL match sees as much actual ball in play time as the other main European leagues. I have favourably compared it to Spain where the referees do not seem to be as fastidious in their as their English counterparts in adding on sufficient additional time at the end of each half.
However, even within the EPL there are significant differences in how much actual time is played from game to game.
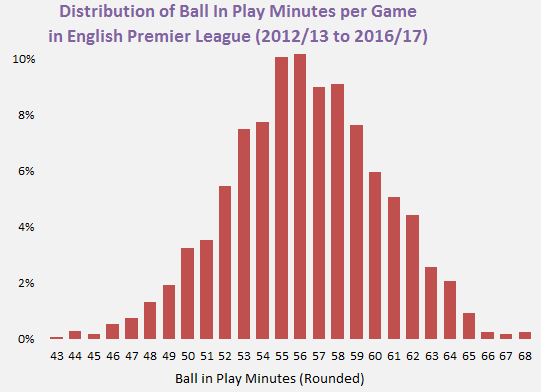
The chart below shows the distribution of actual in play minutes in the Premier League over the last 5 seasons:
It’s no surprise, that we see that 55 and 56 minutes are the BIP minutes that have been most common in the Premier League, but that there have been games with BIP minutes ranging from as little as 43 to as much as 68 amy surprise some readers. It would seem barely plausible that two games played under the same rules in the same league could differ in their actual playing times by such an order of magnitude.
Swansea in November
Earlier this season, during last November, Swansea played a couple of games at home that could hardly have been more different in terms of actual playing time; and I have taken a look at those two games in some detail.
On November 6th Swansea hosted Man United at the Liberty Stadium, lost 3-1 but the fans at that game gorged on 64 minutes of seeing the ball move around the pitch. However, just three weeks later the Swansea fans experienced a totally different experience when they beat Crystal Palace in a barnstorming, never to be forgotten, 5-4 thriller. However, (according to my methodology) that thrilling game experienced just 44 minutes of actual moving footballs!
For the two games mentioned above I went through each Opta action in chronological order and produced a summary showing the approximate number and duration of each stoppage that occurred in the games.
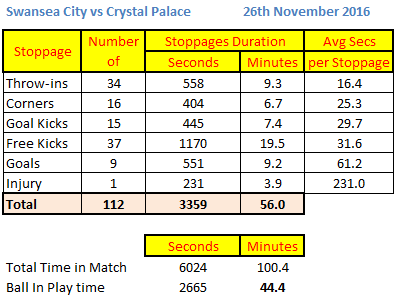
The following charts categorise the stoppages. Note that there aren’t separate categories for the issuing of cards or making substitutions as those delays are built into the stoppage where the event happened.
Remarkably, even though more than 100 minutes of time was played in the match, we can see the stoppages that resulted in less than 45 minutes of actual ball in play time.
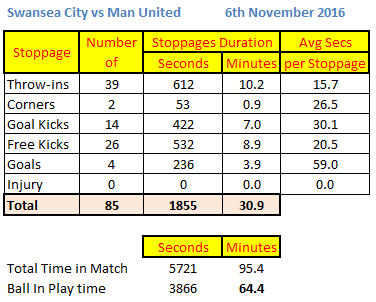
In total, I calculated that there were 112 stoppages. We can see that, unsurprisingly, the length of break in play is largely dependent upon the type of stoppage. Before we look in depth at the various stoppages, let’s compare Swansea’s game versus Crystal Palace with their game played three weeks earlier at the same venue against Man United:
The Man United game had only 95 minutes of playing time, but that still resulted in approximately 64 minutes when the ball was in play.
Across the two games we can see patterns emerging in terms of how much inactivity we can expect to see as a result of a given dead ball situation:
- Each goal results in approximately 60 seconds of no action
- On average, each time the ball goes over the end line (either for a corner or goal kick) we see a break in play of about 30 seconds
- Throw-ins take about 15 seconds on average to restart play
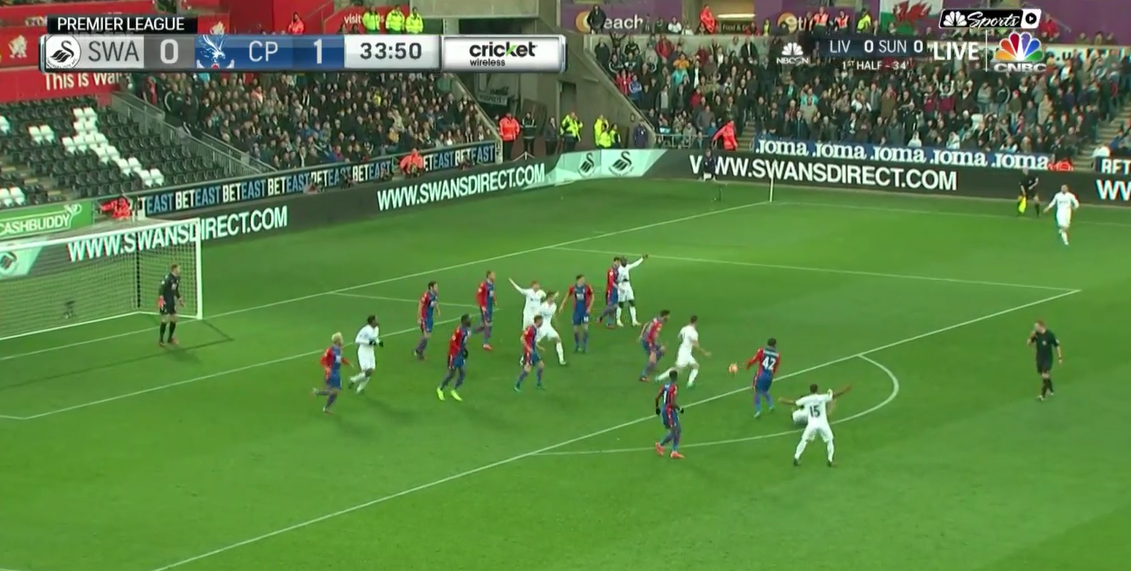
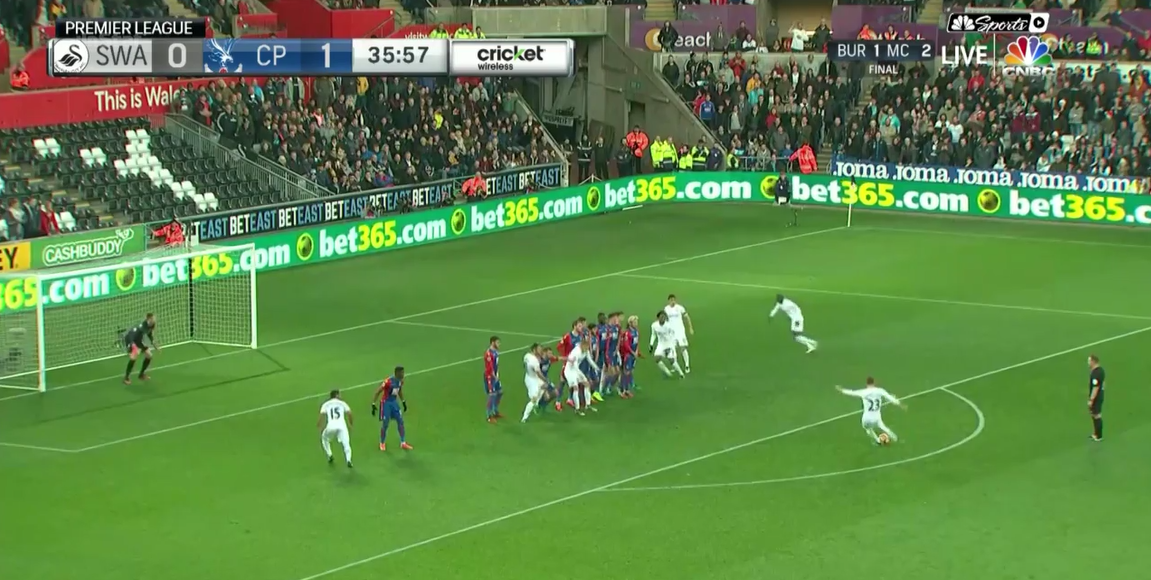
The average duration of breaks in play arising from free kicks differed greatly in these two games. The average free kick in the Crystal Palace game took 31 seconds out of the game, while the equivalent was 10 seconds less in the Man United game. I ascertained that a large part of the reason for this is that in the Crystal Palace game Gylfi Sigurdsson had two direct free kick efforts at goal. The first one was struck more than 2 minutes after the free kick was awarded (some screen caps are included below). As well as the usual spray painting by the referee there was some messing about in the wall which resulted in Yohann Cabaye being called out from the defence and receiving a lecture. The second one was struck 50 seconds after the foul. In contrast, there were no direct shots at goal from free kicks in the Man United game.
In terms of providing a rough ready reckoner for how we can have 64 minutes of play in one game, and then only 44 minutes in another I would reduce the 20 minutes less football played in the Crystal Palace game to:
- 5 additional goals = +5 minutes
- 5 fewer throw-ins = -1 minute
- Additional delays attributable to free kicks = +10 minutes
- 14 additional corners = +6 minutes
What should be done in such instances?
That we can have two games in the same competition where one sees 44 minutes actual play, and the other 64 minutes doesn’t seem equitable. Obviously the example I have used here includes two fairly extreme cases, one at either end of the scale, but they are real, not illustrative.
The first half of the Swansea v Crystal Palace game had less than 3 minutes additional time. However, one series of events shows just how inadequate that additional time was. From the screen cap below we can see that Jack Cork was fouled on the edge of the opposition’s penalty area at 33mins 50secs.
Gylfi Sigurdsson scored directly from the subsequent free kick, which was taken at 35mins 57secs, after a delay of 127 seconds.
Crystal Palace took the restart following the goal, after another full minute expired to allow the celebrations to pass. So, over a period of about 3mins and 5secs the only action that took place was Sigurdsson striking the free kick. That one series of events from the 33rd to the 36th minutes had longer stoppages than the additional time played at the end of the half!
Given the considerable differences in playing time it does seem like one possible solution would be to operate a 60 minute stopped clock, instead of the current “we’ll call it 90 minutes but there is no telling how long we’ll actually play for” duration. Such a change from the status quo would see more football being played in almost 90% of games; but the main advantage would be that all teams would be on a level playing field. What is there not to like about that idea?
Timewasting would not continue to be rewarded, as the perpetrators would know that every second the ball wasn’t in play we would see an equivalent amount of time being added on at the end. Right now, this definitely isn’t the case.
I appreciate that such a move to a stopped clock will not be easily made, however the Liga de Fútbol Profesional (LFP), the organisation that runs the Spanish Primera league, have a much easier change to make. Armed with the information in this analysis they need to have a look at their lack of additional time in comparison to the other big European leagues and instruct their referees to add a little more additional time than they currently play.
By doing that, the Spanish football fans will begin to see as much football as their peers in the other European countries.
