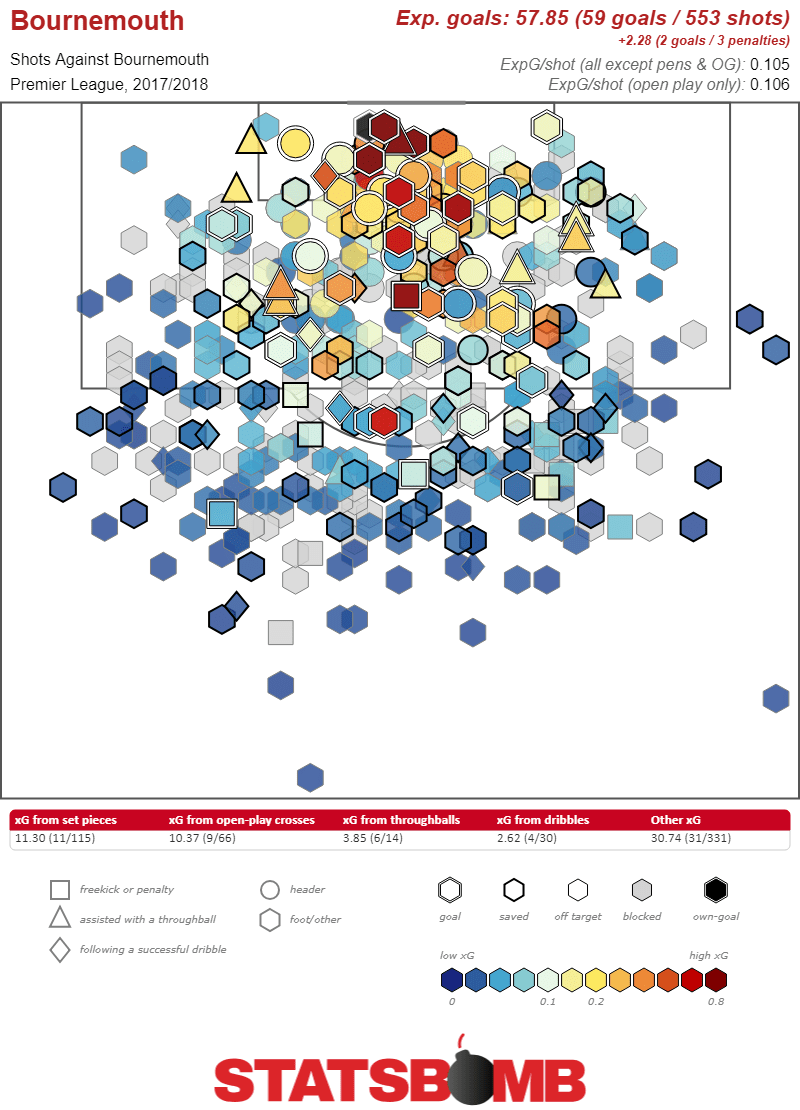
Let’s talk about stopping shots. One of the most challenging aspects of data analysis in football is figuring out just how good goalkeepers are at keeping the ball out of the net. The vast majority of analytics to date has built backwards from shots. Start with a shot, figure out how valuable that shot is, and then extend that to other areas of the field. How valuable were the passes that led to the shot? How valuable were the defensive actions that prevented shots? How much money was spent on the players who took the shots, or made the passes, or prevented the shots, or prevented the passes from leading to the shots? And on and on and on.
There has been some work that applies to looking at what happens after the ball leaves a player’s foot. Traditionally, post-shot expected goals models have been built to look for shooting skill. The theory is, maybe if we looked at how frequently players were able to put their shots in the corner of the net we might be able to tell if some players were better at kicking the ball than others. Maybe there’d be some secret finishing skill that those models could detect that regular old expected goals couldn’t find. The result of that modeling has been, at best, mixed.
It’s possible to try and turn that work around and apply it to keepers. But, it’s awkward. For starters, expected goals is built using every single shot, keepers only face the shots that end up on target. This messes with things. Let’s take a real world example. During the 2017-18 season Bournemouth conceded 59 goals, and just under 58 expected goals.

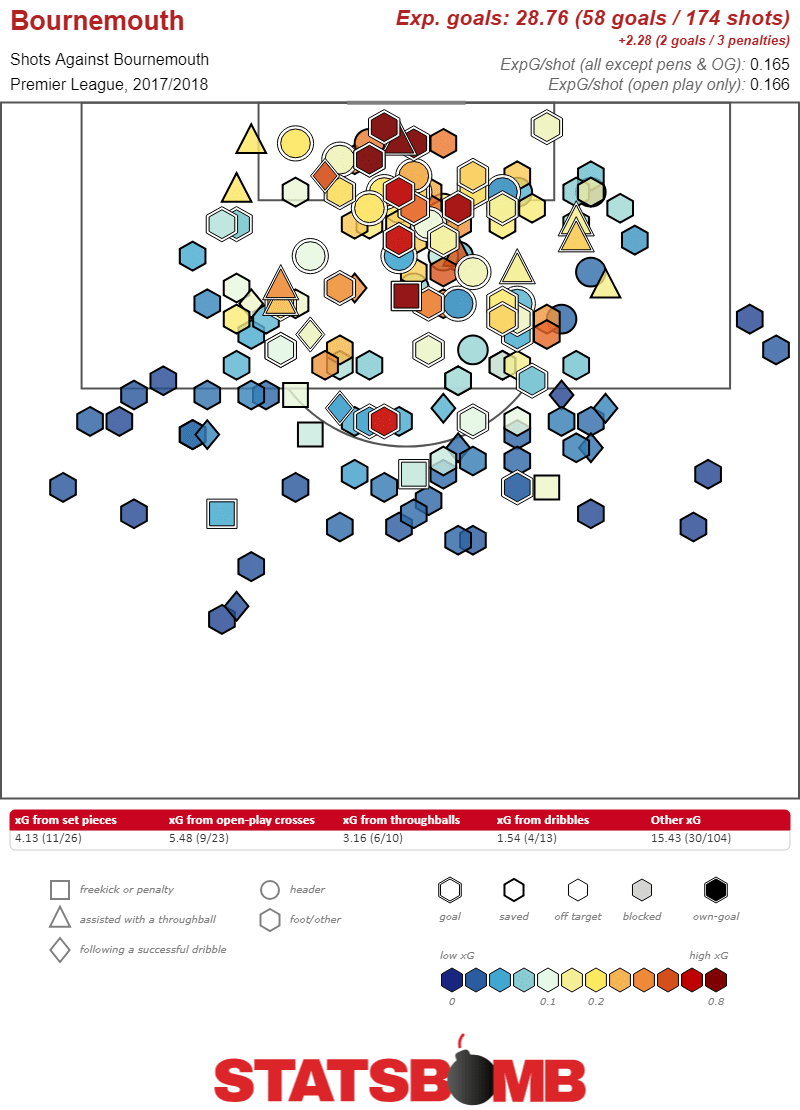
Easy enough. Now, look at their shots on target and they conceded 58 goals (thanks to a magically disappearing own goal). But those goals came from only 28.76 expected goals. What exactly are we supposed to do with this information?

Logically this makes sense. There are a whole bunch of shots (379 of them in this case) that go off target. All of those have expected goal values above zero, all of them don’t become goals. All of the actual goals come from only the shots on target, while the expected goals measure all total shots. Every single keeper in the history of creation allows more goals than expected goals from shots on target. It’s how the measure is designed to work.
There are, of course, ways to math yourself out of this particular problem. You can do all sorts of normalizing and averaging and equation-ing to try and use the existing expected goals model to figure out how well a keeper should have done. That’s useful, and helpful, and can tell you some stuff. But none of it changes the basic underlying problem. The expected goal unit that you’re using is one that’s fundamentally designed to evaluate shooters. It’s taking the average value of each shot (taking into account tons of different factors) and producing the likelihood that it becomes a goal. To evaluate keepers, we’re then taking those shots which end up on goal, and evaluating how the keeper does against them. We can do better.
What we’ve done is built a new expected goal model which includes post-shot data. Again, logically this makes sense. From a shooting perspective what we’re measuring what’s likely to happen to a ball when it leaves a player’s foot. So, we stop at the point of the shot. That’s not what we’re doing with keepers. With keepers we want to measure the likelihood that a keeper keeps the ball out of the net. So, naturally we want to include in our model as much of the data that a keeper has as possible. That includes all sorts of post-shot information about where the ball is going.
So, how did we do that? Well, technically, it’s technical. Here’s our data scientist and model constructor extraordinaire, Derrick Yam to explain:
The PS xG model is trained almost identically to our SBxG model. It is also an extreme gradient boosting model and functions as a typical tree based learning method. The main difference between Post-Shot xG and Pre-Shot xG is that Post-Shot xG uses information after the shot has been taken up until the shot were to pass the goalkeeper. Therefore, we train the model using information about the shot’s trajectory, speed and other characteristics. For instance, we can calculate the y and z location where the shot is estimated to enter the goal mouth. These are often the most important factors predicting goal probability and offer a clear proxy for the save difficulty.
Since we know the shot’s trajectory, we restrict our sample to only shots that are saved or scored, as all shots that are blocked or miss the frame would have a Post-shot xG of 0, no probability of scoring. Despite the added information, the constrained sample to only on target shots makes the construction of an accurate model much more difficult. On top of making classification hard, we also need to focus on the calibration of the model. If there is a systematic flaw in the calibration of the model, our estimates for Goals Saved Above Average% will be biased and untrustworthy. The calibration is how accurate the model’s predicted probabilities are to the true probabilities. This is so important because if the calibration was off and low probability shots were estimated too high, or high probability shots were estimated too low, when we are aggregating PS xG across an entire season for a goalkeeper, goalkeepers who face a lot of low probability shots will have their GSAA% inflated while goalkeepers who face a lot of high probability shots will have their GSAA% deflated. In the,After doing the work, we see our model is calibrated well and there is no systematic flaw which would lend us to believe our GSAA% is untrustworthy and a biased metric.The estimated xG was very close to the true proportion at all estimated probabilities from 0 to 1.
It is also important to note, that since we are interested in the goalkeeper’s performance above average, we do not include any information about the goalkeeper’s position in the PS xG model. We cannot include goalkeeper information, because goalkeeper’s who are typically positioned better than others will consistently have lower PS xG and their GSAA% will be deflated, despite the low PS xG value being a result of their quality positioning. We will explain how we investigate goalkeepers positioning in the next phase of our goalkeeper module.
Nice and simple. Start with an expected goals model, take away the stuff that isn’t on frame, add some post shot information, and voila, you’ve got yourself a brand new post-shot expected goals model. So what can we learn from it?
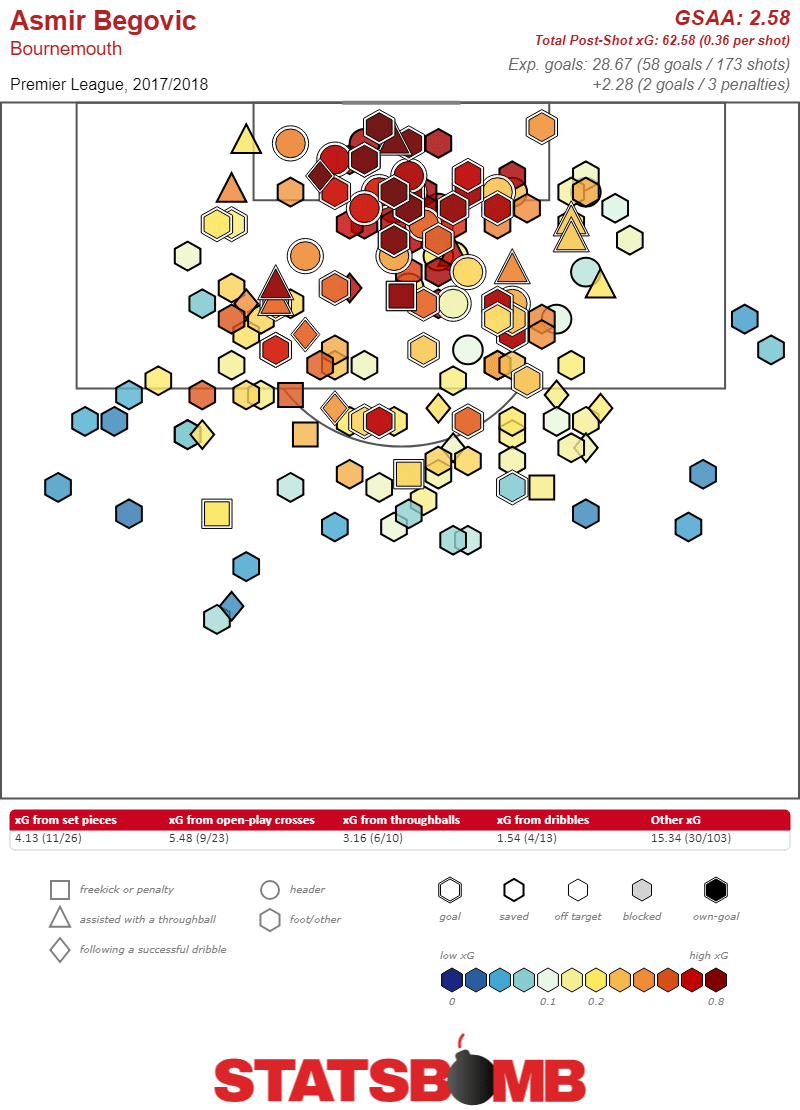
Well, let’s go back to Bournemouth last season. Now we have an idea about the value of the shots that Asmir Begovic faced. Using our post-shot xG model we get something very different. Those 58 goals he conceded, rather than being from 28.67 expected goals, now we can see that from Begovic’s perspective they actually look like just over 60 expected goals. He actually saved a little bit over two goals more than an average keeper would be expected to save. The model lets us figure out how many saves a keeper should make on average, and consequently his goals saved about average (GSAA), or in save percentage form his GSAA% (the difference between a keeper’s save percentage and the save percentage the model expects him to have).

This concept is weird and complicated. How can one set of on target shots actually have two different expected goal values? So, let’s work through it from one more perspective. Imagine your favorite midfielder letting fly from 35 yards out. As a faithful reader of StatsBomb I’m sure that by this point you have developed a Pavlovian groan response to these speculative efforts. And rightly so. Most of the time that shot is going to cannon harmlessly off a defender, or end up as a larger threat to low flying aircraft than the goal. Expected goal models understand this, and they give the shot a low likelihood of becoming a goal.
Also, sometimes your favorite midfielder will hit that ball as sweet as sweet can be, she’s your favorite for a reason after all. When that ball goes flying into the top corner at maximum warp, the post-shot model will rightly see a very high xG effort that no keeper in the world can save, while the normal xG model will see a normal 35-yard speculative effort. They’re both right, they’re just measuring different things. Add up all those differences and you have a keeper model that tells you a lot.
Of course, the model isn’t only useful in extreme cases. It’s also useful to help separate out great saves from average ones. This is a huge step forward in being able to describe games statistically. Right now, we will frequently look at how teams are performing against their underlying expected goal numbers as an indication of how they might perform in the future. If they’re scoring fewer goals than their xG, well that’s a good sign that things are going to turn around. But exactly what went wrong was unclear.
Now we can get a more granular look. Using the post-shot model we can differentiate a team which spent ten games launching balls hither thither and yon from one which ran into a string of hot keepers. We can look at a team which just gave up fifteen goals in a month and separate out whether the keeper was miserable or the shooters they faced had magic boots. We can look at a game where a keeper was busy making ten saves and differentiate between one where he rescued his team from an embarrassing performance, and one where he just routinely gathered a lot of uninspiring potshots.
One thing I’ve been careful to do here is speak in entirely descriptive terms. That’s because while we know what the model can show us, what the model we’ve built says about the future is less clear. On the shooting side of things we know that players don’t really outperform expected goals over meaningful sample sizes (and to the extent that they do it’s quite small as compared to everything else that goes into goal scoring). We don’t know that yet on the keeper side. We don’t actually know much of anything.
We don’t know if this data will show us that shot stopping is a clearly repeatable skill that the noise of other data has kept hidden. We don’t know if the data can show us whether different keepers have different strengths and weaknesses. Maybe there’s actually little to no difference at all when it comes to keepers stopping shots. We just don’t know yet.
What we do know is that we have a lot more information today than we had yesterday. And now, for the first time, we can look at the goals a keeper has given up and compare them to the appropriate baseline. And that’s pretty cool.
