A deep dive into Liverpool is coming soon but today we are talking shots.
It started with Benik Afobe. I find that's true of the majority of my ideas nowadays. In this case, I wanted to know how many shots Bournemouth were likely to take against Crystal Palace so I could determine if Afobe was a good pick for my fantasy team. I wound up making a gut call but then came back around later to check if there was a way to easily estimate. There won't be anything groundbreaking here and it's possible or probable that most of you already mentally do this basically correctly: but it was interesting to see the data for me, so I'll share.
The Wrong Way
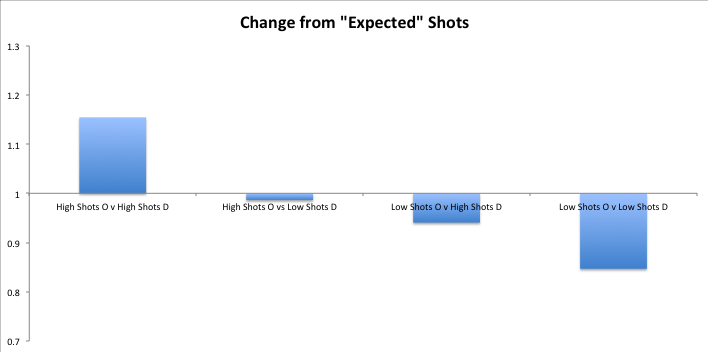
The first thing that came to my mind was just averaging shots for from the attacking team against shots for from the defending team. I did this for each set of games (home and away) between teams in Ligue 1 and La Liga from last season. I then sorted the teams into high shots (top 5) and low shots (bottom 5) offenses and defenses. I then simply compared how many shots were actually taken in buckets of games involving these teams to what we'd expect with the simple average. As you can see, this simple average is a badly mistaken assumption.
The graph shows how using this method consistently underestimated the amount of shots high shot teams took against high shot defenses (actually took ~15% more than rough average) and overestimated how many shots low shot teams would take against low shot defenses (actually took ~15% less than rough average).
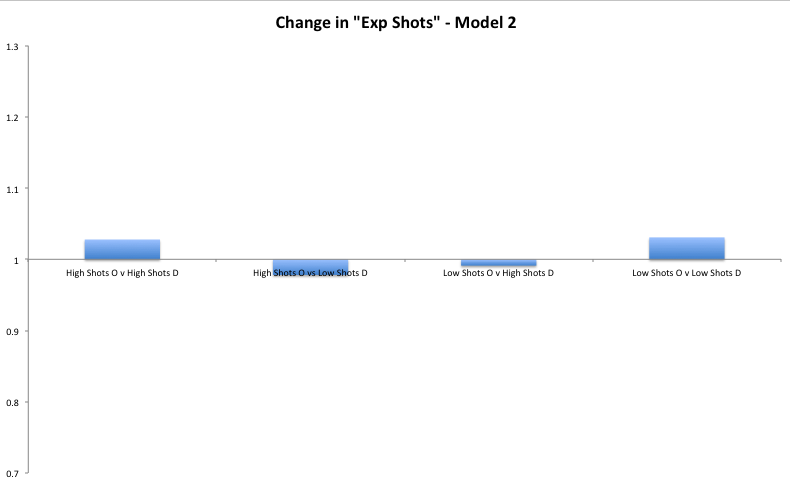
So what was the problem? If you get a team that shoots more than average, going against a defense that allows more than average they feed off each other like loud-mouthed hecklers and Donald Trump. If you have an attack that shoots more than average (like Marseille's 15.2 compared to Ligue 1 average of 11.5) and a defense that allows more than average (like Guingamp's 12.6) you expect a total of [(3.7 + 1.1) + 11.5]*2. This is the difference from average for the attack and defense times 2 for the 2 games they play. So in this case you expect Marseille to take 33 shots total in the two games, they took 32. When you use this method, you get results that closely track with reality:
Each bucket has an n of ~100 games. You can predict shot totals as a group pretty close to exactly using this method. None of the groups are more than 5% off the reality.
Why Is This?
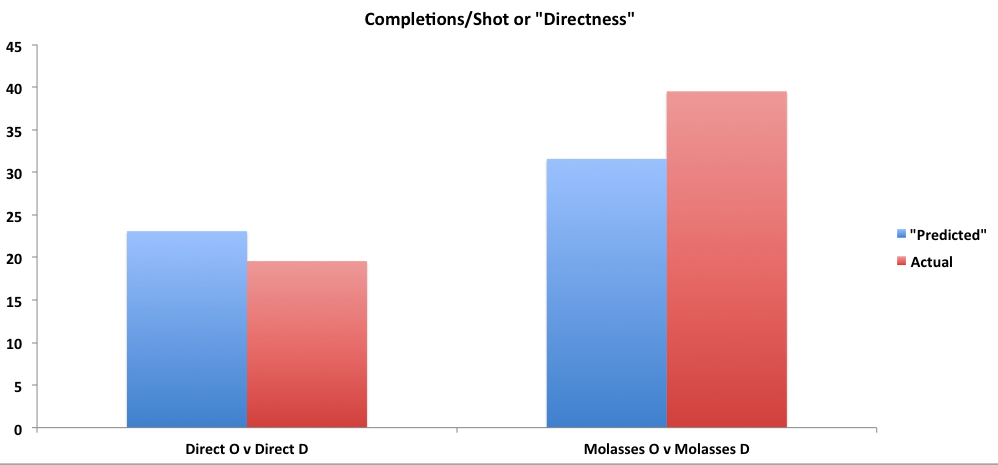
I wanted to know the mechanism that allowed this sort of coupling effect. The most obvious place to start was completions per shot, a measure of how direct a teams attack and defense are. You can learn a lot about how a team attacks and defends checking this metric. Atletico Madrid's fearsome defense last year forced opponents to complete 38 passes for every shot they allowed while Marseille's chaotic high press acted as a sieve at (many) times, allowing a shot every 20 completions. Teams had to string together twice as many completions to get a shot vs Atleti as they did vs Bielsa's Marseille or Paco Jemez's Rayo. So I figured that this metric was what I should check first to explain the shot conundrum. It turned out some interesting results. When very direct teams play defenses that allow very direct attacks, things get positively linear. We also see when we have two slow or "molasses" teams, we wind up seeing attacks at an even slower pace than you would expect.
"Predicted" means what you'd expect averaging the two. So when Espanyol's direct attack (22.5 comps per shot) took on Rayo's wide open defense (19.1) we expected 20.8 completions per shot. In reality Espanyol took 20 shots on only 335 completions (15.8 completions per shot). We do this for the top 5 most direct and least direct teams in each league to create the buckets. So sometimes teams can get more shots than you might expect from a certain amount of possession simply because the tendencies match up. They don't have to work near as hard to get them.
Obviously, possession also plays a big part in how teams get shots and we aren't dealing with that here at all. I've seen models that try to predict possession, and have dabbled in it a bit but never tested anything. If we can build an accurate model of who is going to have the ball and how they are going to work to get a shot off, that's a good bit of the way toward modeling a game in a detailed way that I haven't seen done too often. Of course, once someone scores you then have to re-adjust all those numbers based on the teams tendencies at different game states but that's for another time.
What Does This Mean (for Leicester)?
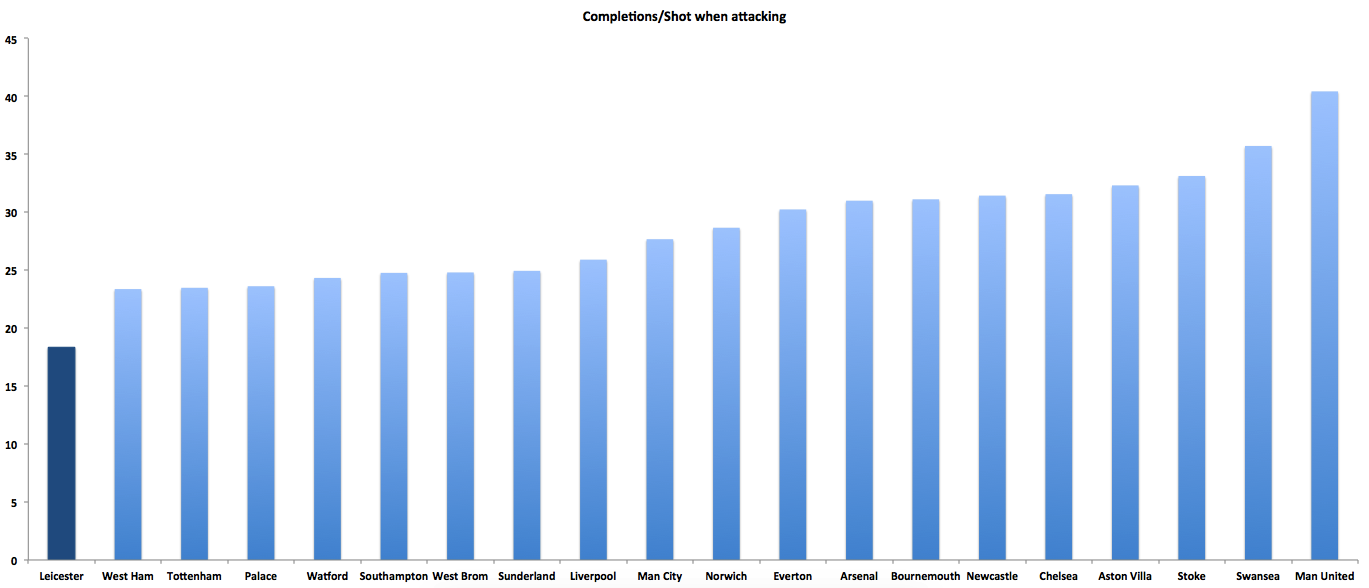
It's the time of year for special Leicester stats, and here's my contribution.
They are the most direct team in the league, which isn't surprising. We see United and Swansea on the other end, also unsurprising. So when Leicester plays Newcastle, Stoke, and West Ham (the most "direct" defenses) they are set up pretty well to get their shots with less work, so if they can keep their possession levels at expected levels they will get more shots. When Swansea faces United (the least "direct" defense, they have to work that much harder to get each shot off.
Does this knowledge help a manager?
Knowing how your opponent passes to get shots should be a minimum for any pregame scouting. Knowing how your own defense amplifies those tendencies is another piece of knowledge to keep in mind. If you are van Gaal and know Swansea is coming to town, you can pretty much count on your team being able to slow their attack to a crawl. Maybe this gives you a reason to pick a smarter, better in the air, ball-playing center back instead of the one with more pace. Maybe this means you tell your fullbacks to get forward quicker knowing Swansea's buildup will allow them more time to retreat if caught upfield. Of course you have to weigh this with a lot of other factors and I'd assume many top managers have a good intuition for things like this already, but the information can't hurt.
If you are Crystal Palace (the team that allows the quickest shots per pass) facing Leicester, you should be aware that you are even more at-risk to their lineup of direct sprinters, they are poised to strike even quicker than normal to get a shot off. Maybe you change how you approach corners or tell your players to play a few less risky passes.
None of this is groundbreaking, but it wasn't something I went into games aware of before. Now I have a better pregame framework for which teams will be taking a lot of shots and how they will move the ball to take those shots. This wouldn't have changed my thinking too much on the agonizing Afobe-or-not-Afobe decision but it's good to know for the future.
Home vs Away Coda
I didn't factor in home and away for any of the above calculations because I was looking at both legs in total. But, if you want to know a bit about the home/away breakdown: Home teams generally take 55% of shots in any given game. Home teams are also more likely to put those shots on target (34.1% to 33.6%) and score more of their shots on target (G/SOT of 31% compared to 29.5% for away teams). Home teams take shots from closer in (19.3 yards compared to 19.9 yards) while the only edge away teams get is a lower % of shots that are headers (12.5% compared to 14.1% for home teams, though even those come from slightly further out 10.3 to 10 yards).
Data provided by OPTA


