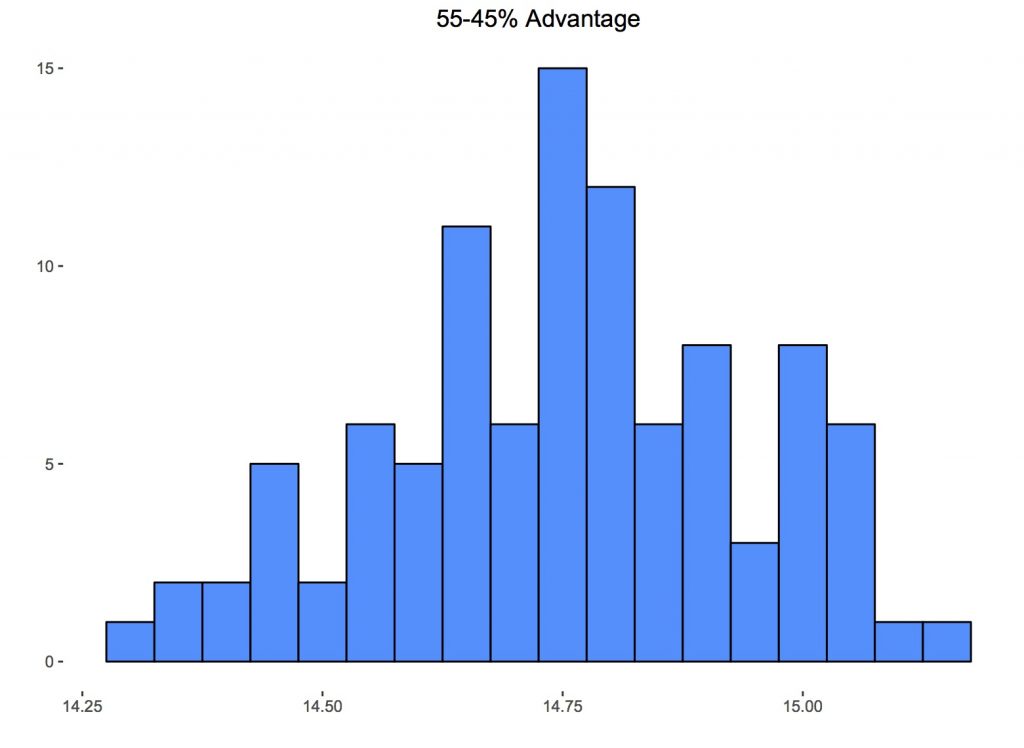
 If you happen to own a football team and you employ a General Manager or a Director of Football or some position with similar authority and that person thinks data analysis isn't worth it because it only provides a 55-45% advantage, fire that person. You should probably even do it before lunch. The genesis of my first foray into amateur HR actually comes from something site proprietor Ted Knutson retweeted. https://twitter.com/ianlynam/status/818581172900872192 Admittedly, that tweet is about the other football. The Marathe in question is Paraag Marathe. According to the San Francisco 49ers team website, he's the team's Chief Strategy Officer & Executive VP of Football Operations. This isn't really about Marathe (or his employment status), or Ian Lynam (the original tweeter). It's about the difference between 55 and 45. Obviously, that's a huge advantage. Right? Seems like it. I even replied as much. Thing is, when I did that, I actually had no idea (beyond intuition) about what a 55%/45% mismatch might look like. It turns out—and now we're dealing with the football as the rest of the world knows it—it looks like this.
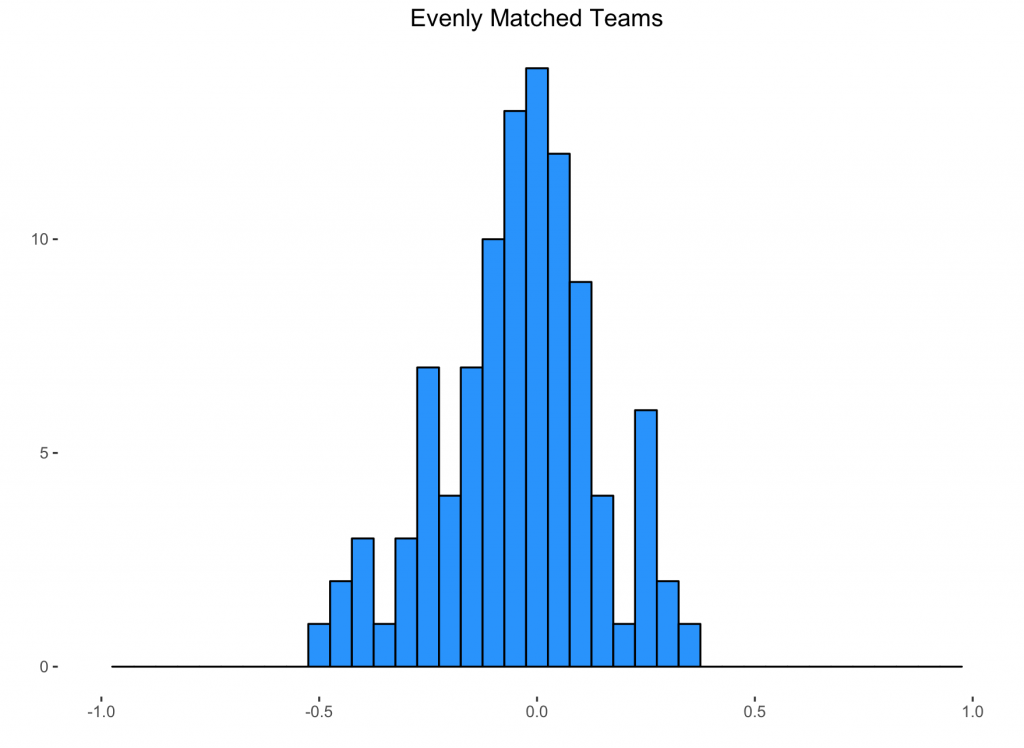
  That's 100 different 38-game seasons with a 55/45 match-up sim'ed 10,000 times. So what exactly is that? Let's explain by starting with some assumptions. The first of which is that there are about 2.5 goals scored in a game of football. This isn't so much an assumption as an approximation of what happens in the real world. From this chart here you can see that the top four Euro leagues have all converged to just a tad above 2.5 goals per game. The Dutch don't want to seem to play nice (or defense as the case may be). Let's further assume that we have two evenly matched teams. That means when they play, they split the 2.5 goals per game. Even Steven. But goals in real games are discrete—one goal, two goals, etc.—you can't score a fraction of a goal. You can, however, accumulate 1.25 worth of expected goals1. Now, even though these teams can be equally good, they are almost certainly never identical. They won't 'score' 1.25 expected goals the same way. One team might score like this: 0.148, 0.057, 0.079, 0.007, 0.082, 0.060, 0.098, 0.206, 0.088, 0.219, 0.049, 0.045, 0.021, 0.092 The other like this: 0.324, 0.074, 0.046, 0.018, 0.177, 0.088, 0.219, 0.135, 0.112, 0.020, 0.037 If the teams were equal in identical ways, each would win the same percentage of games. But here they aren't identical. The first team clearly has Phillipe Coutinho on it. If you run 10,000 sims with the above numbers, the first team wins 35.58% of the time and the other 36.02%. By just tweaking the individual shot probabilities we're trying to mimic some of the randomness inherit in the game even between similarly matched teams. 2 That's our starting point—we have two teams with equal total goal probabilities3. Next we do an expected value calculation for points based on the outcome. Numerically that's: (3 * .3558) + (1 * .2840) = 1.3514 points (3 * .3602) + (1 * .2840) = 1.3646 points Here the first team gets 0.0132 fewer points out of this game. That's practically nothing. Do it 38 times; that's one season. Do one hundred seasons and you get this:
  Notice most of the data is right around zero (our x-axis is showing the point differential between the teams over an entire season). This is a really involved way of showing that if two evenly matched teams play a lot of games, they generally end up generating the same amount of points. Shocking, right? Well, the beauty of doing this on a computer is that it takes about 65 seconds, instead of 6500 years4. That's if nobody sleeps. Hope one of the teams signed Alexis Sanchez. And that he's immortal. The more important beauty of doing it this way is now that we've created a baseline, we can see easily see what movement away from it looks like. Oh, actually we've already done it. That's the graph up top. For it, we took those same two even teams and said, 'Okay, now instead of being equal, let's give one a 55%/45% advantage over the other.'5 This is the advantage that was dismissed in our seed tweet. In football (still fútbol), that works out to 14.75 points on average. That's a lot of points (more than I would have ballparked anyway). In fact, last season, if you had given 14.75 points to a plucky little mid-table team like, say, billionaires Chelsea, it almost would have put them in the Champions League. Almost. Banter aside, 14-15 points is usually right around the point differential from missing out on Europe entirely to sneaking in to the last CL spot (in England... I didn't look at that other leagues). Now, one team getting 5% better doesn't necessarily imply the opponent getting 5% worse. I mean if the 5% is a global sort of improvement, then maybe. But making your offense 5% better doesn't necessarily imply you also made your defense 5% better. But here, to meet the terms of the original tweet, that's what we did. We increased one team's expected goals performance in a game by 5% and decreased the opposition by 5%. If you just get 5% better (without any impact on your opponent) the increase is half of the 55/45 split, about 7.4 points. The average point differential this century from the last Champions League spot to the next place on the table (read: usually Tottenham) is only 4.6 points. Ten percentage points is ridiculously large. Given that it comes from a character-limited medium it begs for a little context. It does ultimately involve the San Francisco 49ers. They might have usurped the mantle of the least functional front office from Cleveland (where they might finally be making not-terrible decisions). So nothing would be too surprising. Still, that smart, hyper-competitive people would causally dismiss any advantage like that is a little baffling. To bring it back to the global game, advantages can be small and have an enormous impact. If the movement from 'equal' is just +/- 1%, that's worth almost three full points. The mean advantage is 2.954. The difference between safety and relegation in the EPL has been more than three points only four times in the last 15 seasons (it was exactly three in 12-13, 13-14, and 14-15) with the average being 2.4 points. Just to be clear let's reiterate: the average distance between relegation and staying up is 2.4 points. The average gain from a 1% improvement (and that's both offensively and defensively) is just under 3 points. The latter is larger than the former. True, we did this assuming an average team. And the bottom end of the table is usually populated with bad teams. Average teams don't need three points to stay up and bad teams don't score 1.25 expected goals per game (although 03-04 Leicester, 10-11 Blackpool and 11-12 Blackburn went down scoring 48, 55, and 48 goals respectively; both of which are more than 1.25 actual goals per game). But consider that, in six of the 15 completed seasons this century, relegation was decided by one or zero points. That's 40% of the time. Massive edges (say, 10%) might not be realistic but if you're not very good, and the difference between staying up and going down (and the loss of a cut of the EPL's £5.14B TV pie that goes with it) is pretty tiny—and often it's literally one goal—you kinda can't afford not to employ people who can help you get that 1%. None of this is particularly new to people doing analytics. In fact, it's probably getting tiresome in the way that talking to a wall probably gets old. If there's anything novel here, it's that I had never made even a cursory attempt to quantify what a small advantage might look like. But man, as the financial stakes get larger, at some point poo-pooing even the smallest edge will be indefensibly foolish. If it's not already.
1 'Hey wait, aren't you that guy that hates expected goals?' Let's go with 'Yes' for now as it's a shorter conversation. But I did also say (paraphrasing): there are absolutely situations in which putting a probability on a shot is very valuable. This falls under that. 2 When looking at shot probabilities how they are distributed matters. If you don't understand why that's the case, read this post, paying attention to the part about Team Coin and Team Die (you should read the post anyway because it's really good and contains a lot of useful information). Even if teams are even and identical it changes their expected points. In other words if each team scored 1 goal on two shots of .5 probability, each team would expect to win 35% of the time. If each team scored 1 goal on 10 shots of .1 probability, each team would expect to win just 31.25% of the time. 3 These aren't even 'real' probabilities. Using a beta distribution I mimicked what a shot probability profile looked like. A beta distribution basically gives us probabilities of probabilities so adjusting the shape parameters we can approximate an average team. Anyway, we're randomly sampling from that distribution. 4 It's 38,000,000 total 'games'. 5 How you even quantify 'we're 5% better' in many areas is something I'm not even sure how to do. For the sake of ease, and to make this doable in a very simple way, the entirety of the increase or decrease is manifest entirely in shot quality. So moving from 50-50 to 55-45 is moving from 1.25 v. 1.25 in cumulative expected goals to 1.375 v. 1.125.
2017
What's An Advantage Actually Worth In Football?
By admin
|
January 13, 2017