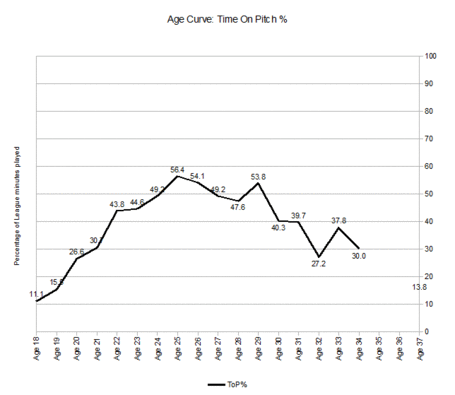
Earlier in the day Ted Knutson published this (link) on age and value in the transfer market. It's a terrific piece with a focus on Man City's Summer spending and the problems with signing players who, at 28 years old, may have already peaked. Now I know that using words like already 'peaked' when talking about 28 year old athletes may seem like crazy talk but some of the information I collected on this topic shows that the average forward is already starting to decline. To start us off let's look at the age curve. To do this I want to use Time On Pitch % which is the percentage of minutes a player features in divided by the total available minutes (league only).
Age Curve
 This chart shows us some cool information although I must repeat the warnings we posted in the previous article that this is only a 5 year sample. More data is desperately required. Here are some quick thoughts from the Age Curve graph:
- Young players do not log heavy minutes in the Premier League. An apprenticeship is required, and it is only at the age of 22 that forwards start to play anything approaching regular minutes.
- The age 29 bucket is strange. It does feature a smaller sample, but it could also be the death rattle of desperate forwards struggling against the dying of the light. Or, maybe it's something to do with power forwards/target men.
- If we cast aside that 29 year old bucket, which is a smaller sample anyhow, the we see a peak for ToP% between the ages of 24-27 with a slight Autumn peak at age 28. Depending on your outlook peak years in terms of percentage of playing time could be 24-27 or 24-28.
- If you are a forward aged 30 or over then you can expect the ToP% to fall away quite rapidly. In fact, on average, forwards over this age haven't played this little football since they were 21 or under.
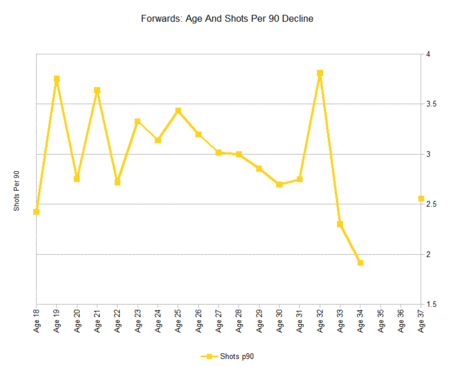
We have the age curve figured out, now I want to show you Shots per 90 and Shots On Target Per 90 performance by age.
Shots Per 90 And Age
 Yet again we see weird peaks and troughs in the early and late age buckets due to small sample size and talent outliers. The bigger samples are between the ages of 22 and 30.
- The ability of forwards to generate shots falls between the ages of 23 and 26.
- From age 27 shots per 90 is in decline.
- Arguably shots per 90 is in terminal decline but for the the 32 year old bucket, which has some survivor bias and small sample issues.
- For reasons unknown, players from the age of 27 onwards just cannot generate shots per 90 at the same rate they once did.
Shots On Target Per 90 And Age
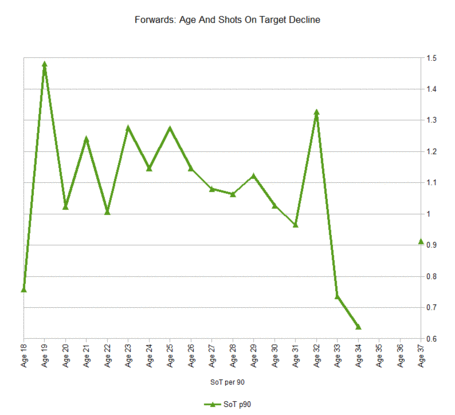
 This chart looks at Shots on Target per 90 performance of forwards. We see very similar patterns to shots per 90 with volatile spikes for younger players.
- Peak years are between 23 and 26 years of age.
- From 27 years old we see a gentle decline in shots on target per 90 output. Then we have an out of place spike at age 29 and a huge small sample spike at age 32.
Final Thoughts
