NOTE: Following Hudl’s acquisition of Statsbomb, its football platform is now called Hudl IQ. Learn more about the acquisition here.
March Madness has been especially mad this year in both the men’s and women’s tournaments. No top 3 seeds in the men’s Final Four for the first time ever. The first time since 1985 that there is a women's Elite Eight without UConn, Tennessee or Stanford. There have been some memorable moments throughout the tournament (Angel Reese’s taunting/celebration sure ignited Twitter on Sunday), but there have been a few plays that stood out a little extra to me, and to football coaches across the country.
A popular trend in the tournament was lining all 5 basketball players off the court. The ref hands the ball to one of the basketball players (the quarterback), and the other four players (receivers) run coordinated paths in an effort to get open (routes). This looks a lot like the bane of line coaches across the country - the incorrectly named drill 7 on 7 - where 5 offensive players run routes against as many as 8 defenders. While this worked on the basketball court and helps get pass routes timed up in football, 7 on 7 drills leave out a large chunk of players: the offensive line.
This is nothing new, offensive linemen are often overlooked, forgotten about, and get very little attention from the media. A prime example of this comes in the form of football statistics. Most stats credit a player for something good they’ve done: yards, touchdowns, tackles or passes broken up, however, offensive linemen are the Eeyore of statistics. Offensive linemen typically only receive negative statistics, such as the number of sacks and pressures allowed, and possibly the number of penalties committed, which all indicate poor performance on a play. If completion percentage over expectation (CPOE) were a statistic for offensive linemen, it would be called completion percentage under expectation (CPUE).
With that in mind, it is often difficult to analyze offensive line play. With that in mind, the NFL Big Data Bowl competition this year was focused on line play. There were numerous incredible projects, and it was great to see linemen starting to get some credit from the stats side of things. At Hudl IQ, our data not only replicate the frequency of NGS data at 10 Hz, but we also collect data around each block an offensive lineman makes (as well as for other players that start in the box such as WR, TE, and RB). We use this data to create metrics and surface new levels of data. Through this, we finally have some positive stats for offensive linemen.
NFL Draft
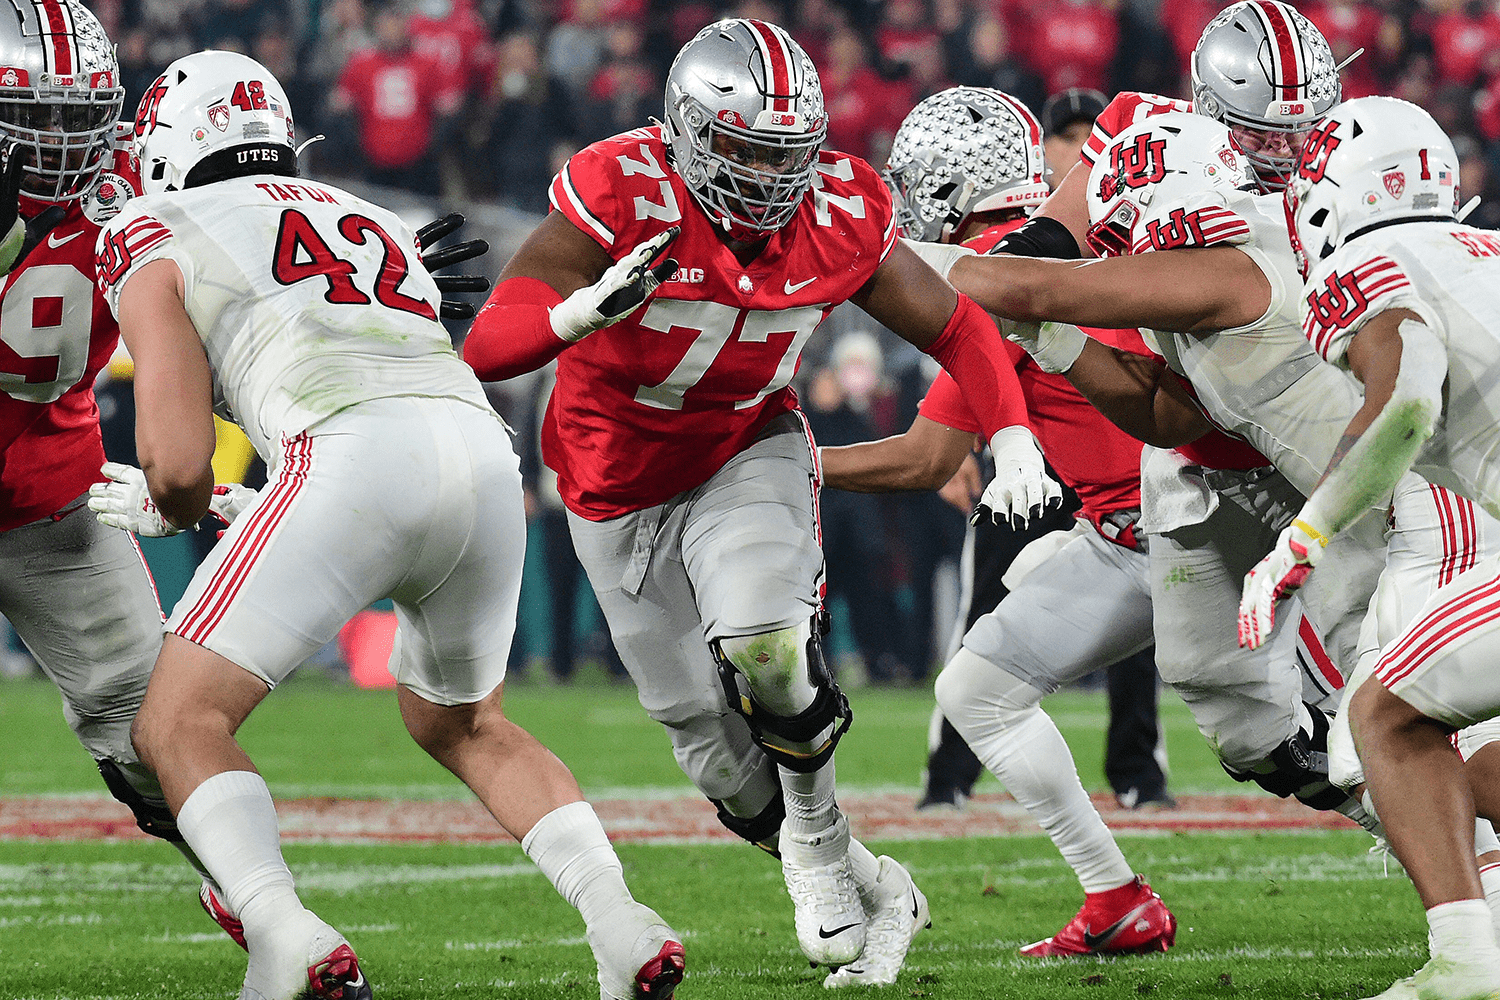
Three offensive linemen are projected as the top tier of potential draft picks in this upcoming draft: Peter Skoronski, Paris Johnson, and Broderick Jones. All three played left tackle, and all three performed well at the NFL combine. Broderick Jones ran the fastest 40 yards dash of all the offensive linemen at 4.97. Peter Skoronski had the second-highest vertical jump and broad jump at 34.5 and 115 respectively. And not necessarily a performance so to speak, but Paris Johnson measured in with wings for arms with the second longest arms. Barely losing out to teammate Dawand Jones.
Pressures & Sacks
One of the most important people in football is the stats keeper during games. Some stats are easy to calculate like yards gained, completion, and interceptions, but stats like tackles, receiver drops or pressures require more judgment. In high school, our statistician was the 10th-grade Biology teacher (S/O Mr Orme). He loved having me as a student, and anytime I was anywhere close to the pile on defense he would credit me with a tackle. That favoritism doesn’t exist as you rise up levels, but the judgment calls remain. And there are no incentives to be 100% accurate in recording things that happen, especially the bad. And remember, offensive linemen only are evaluated using negative stats! To avoid this, we use our tracking data to come up with a more quantitative look at pressures (and pressures allowed).
By using our distinctive line battles data, we can assess pressure on a play by considering three factors: the distance between the defensive player and the quarterback, the time elapsed since the snap, including the time spent at different distances from the quarterback, and whether the defensive player was being blocked. These three factors culminate in our new pressure metric, known as proximity pressures, which provides insights into the impact of a defensive player's rush and the effectiveness of the offensive lineman in protecting the quarterback.
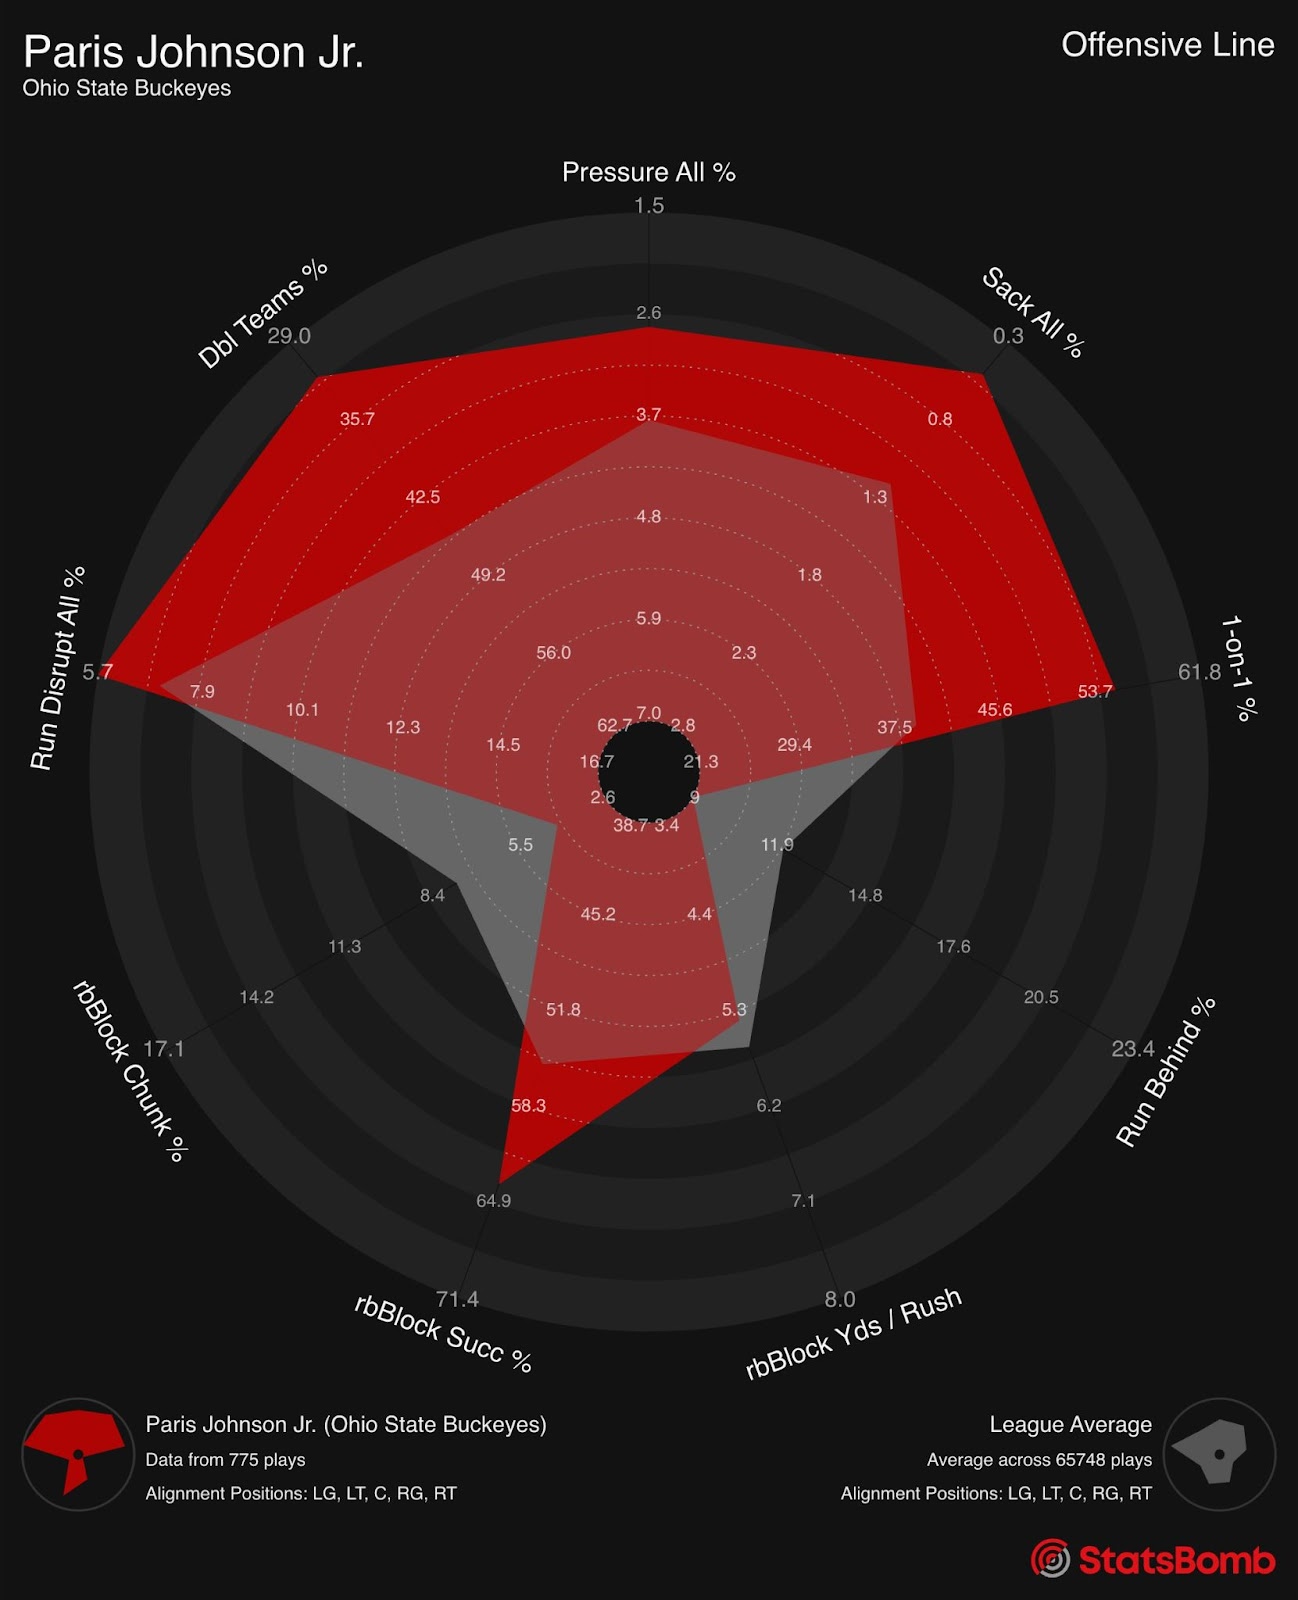
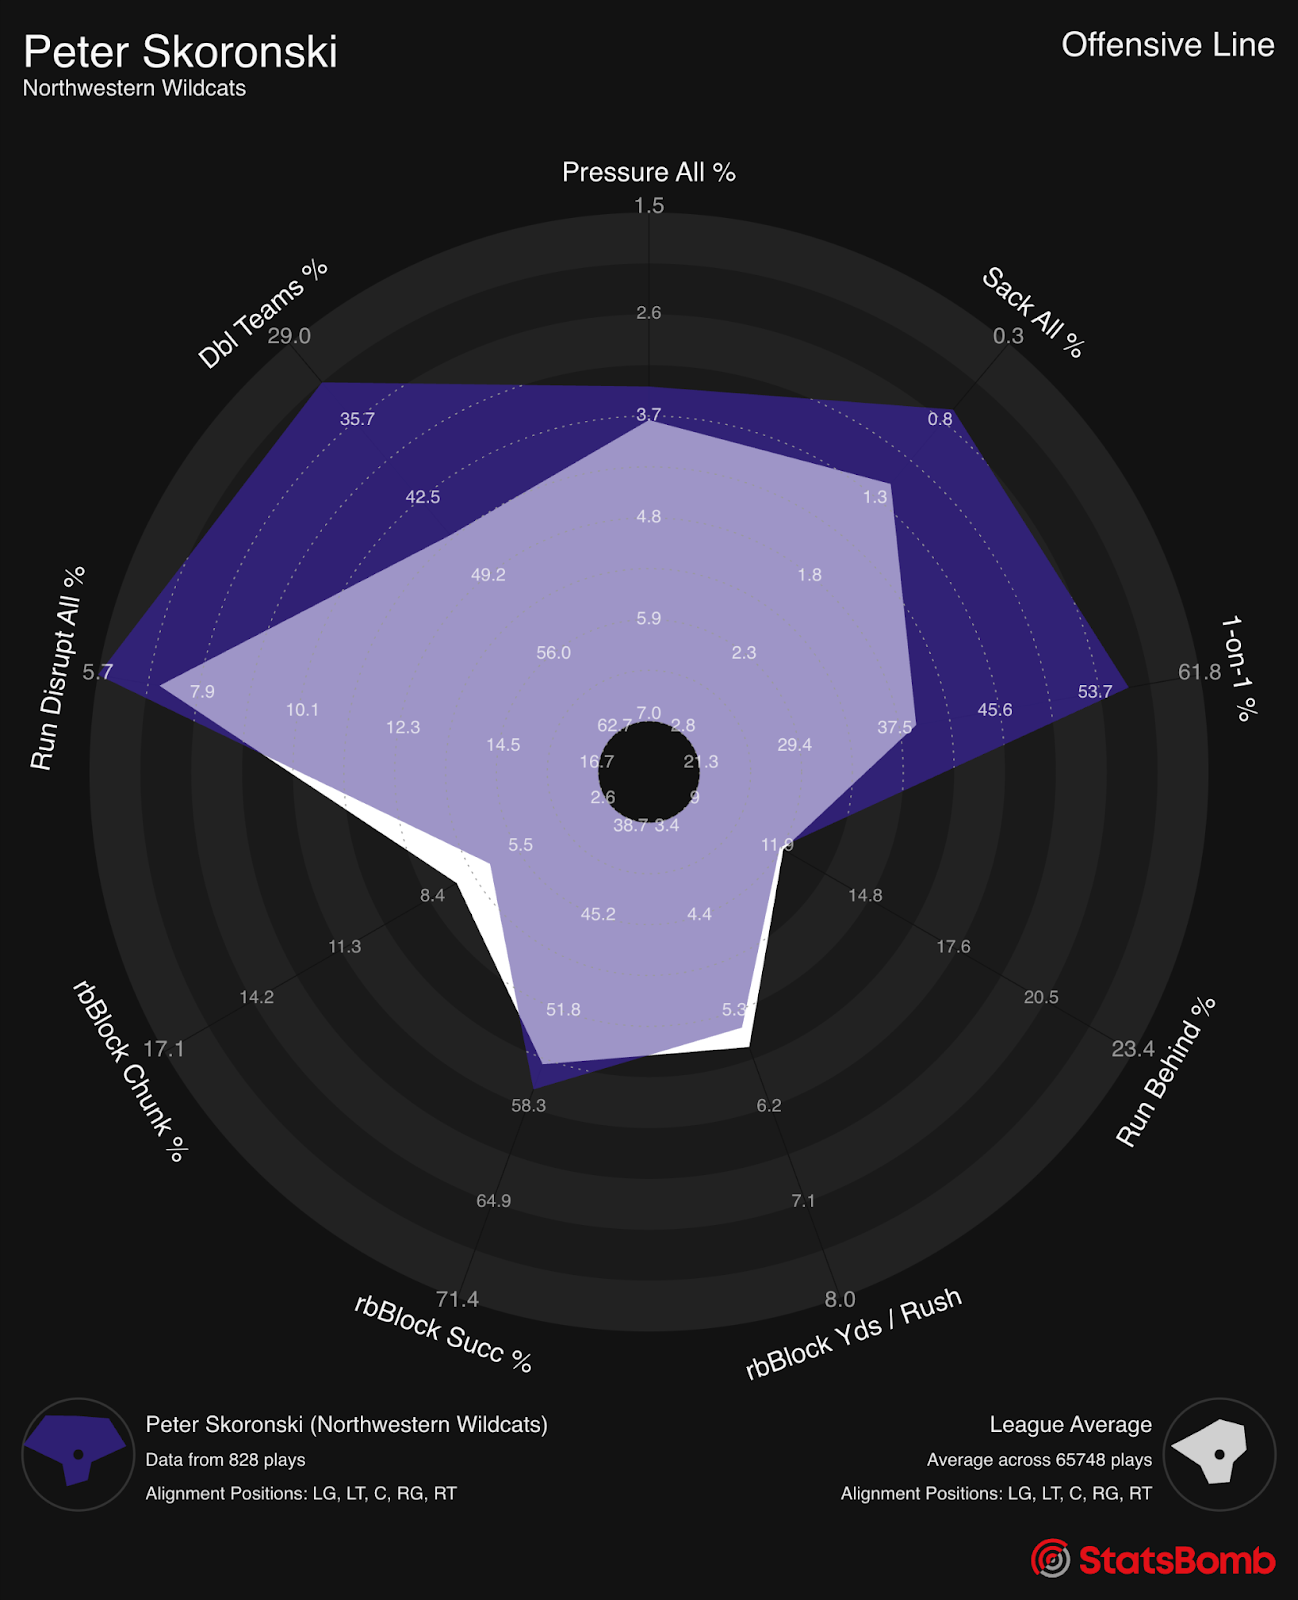
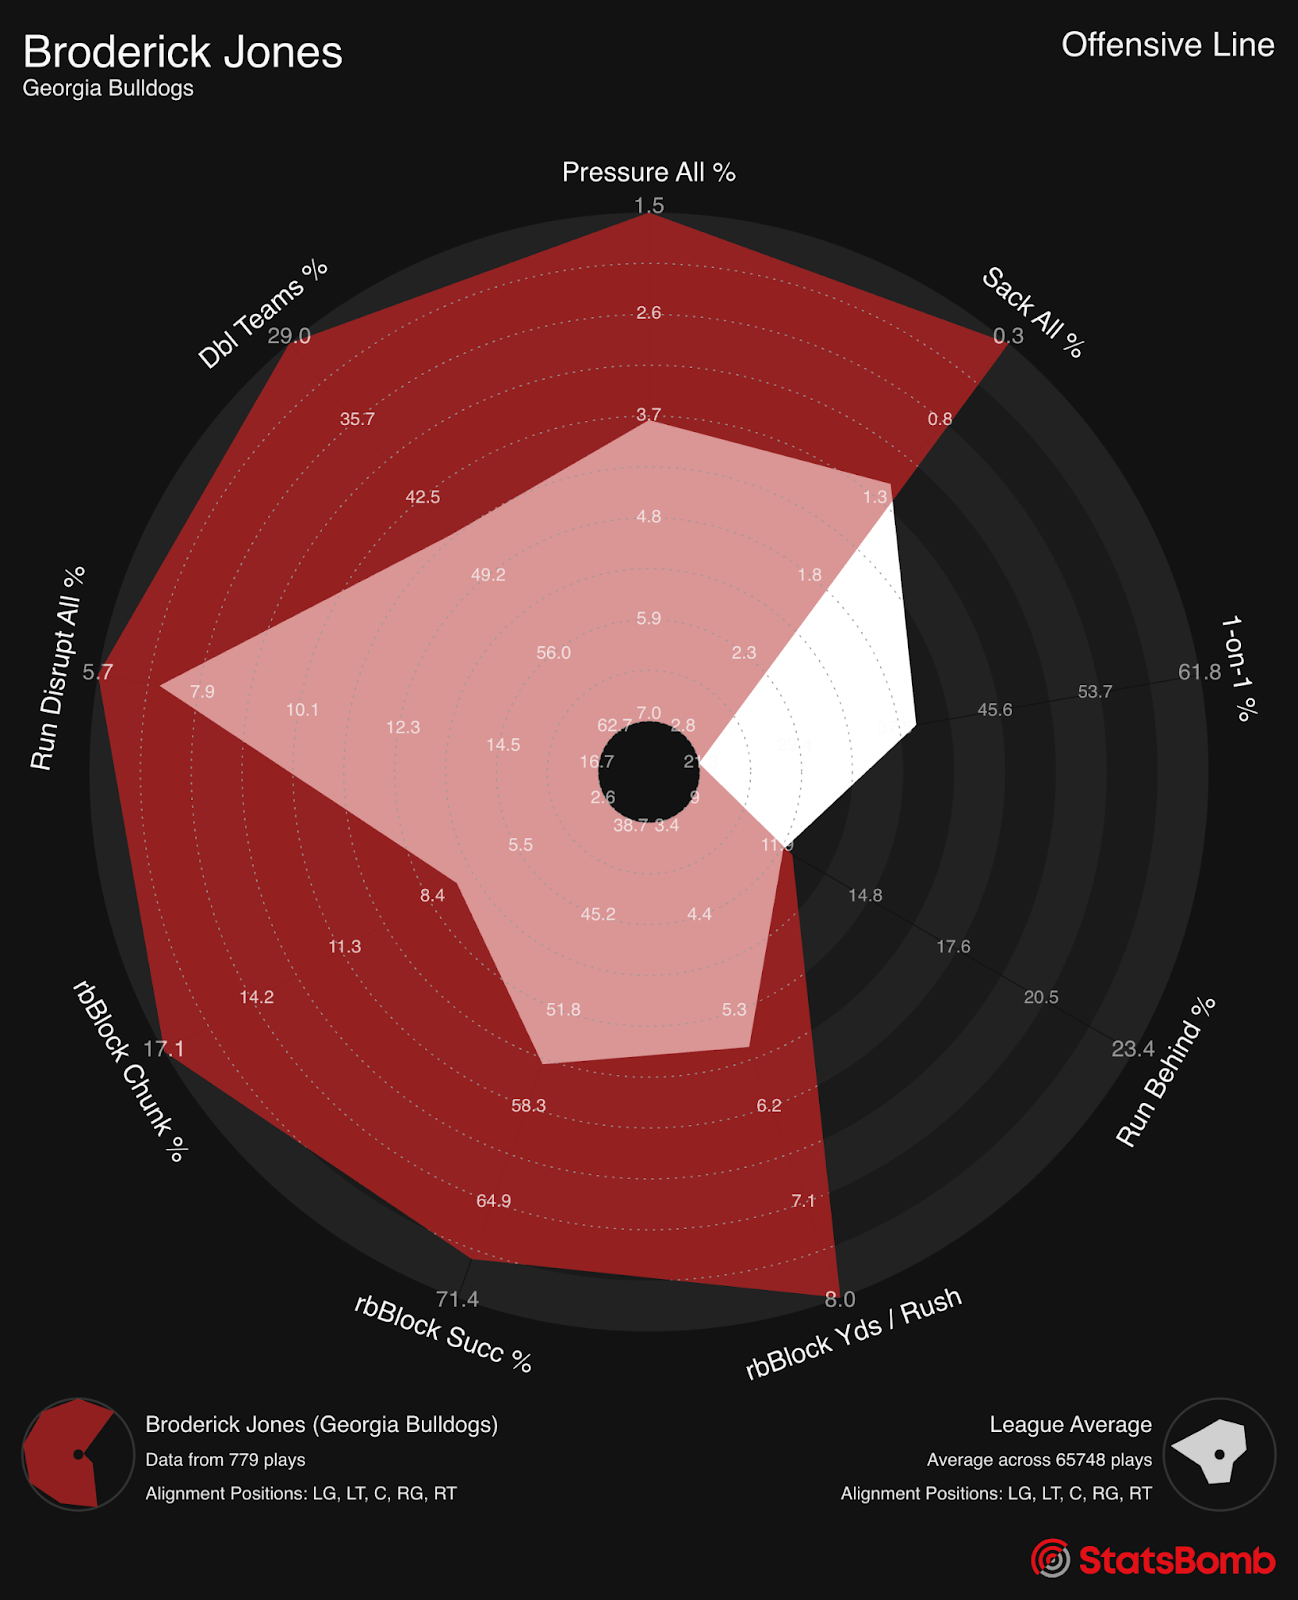
As you would expect, all three top tackle prospects are much better than average at not allowing sacks and pressures. Broderick Jones and Paris Johnson are much closer to the 95th% outer bound of the radars and were some of the very best in the country at protecting their respective quarterbacks.
1-on-1 & Double Team Blocks
Another example of Hudl IQ's line engagement data comes into play in looking at the rates of different blocking styles. A block is considered for the 1-on-1 % when an offensive lineman is the only blocker against a defensive player on a pass play. Double Team percentage looks at how often offensive linemen are included in double teams in the run game.
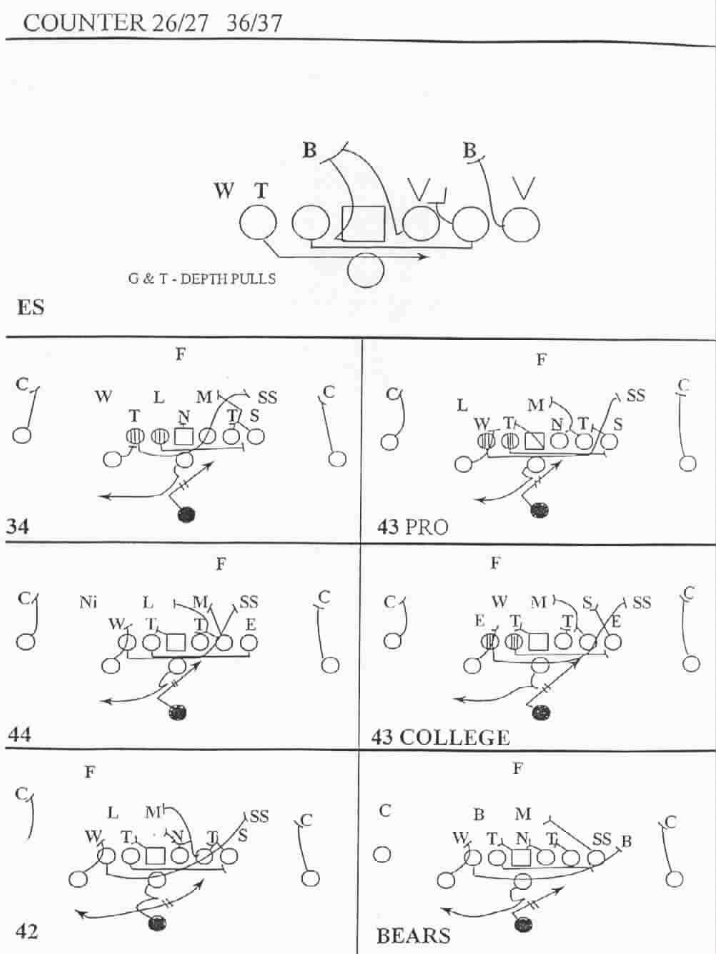
Offensive linemen have one of the most difficult jobs in football. It is both physically demanding and mentally challenging. On a counter-run scheme, for example, the quarterback just has to get to a point to hand the ball to the running back (he may have to read a defender, depending on the type of counter scheme). The running back has to get the ball from the quarterback, and does some reading of blocks, but has a specified area he is supposed to run to. Receivers might have some routes to run (if the run concept is tied to an RPO) or some easy, usually inconsequential blocks. But an offensive lineman has to keep his mind alert from the initial set-up all the way through the run-blocking scheme. He has to stay aware of the rules and responsibilities of all the linemen, so he can understand and anticipate all adjustments based on defensive alignment and movement. One running concept can eventually be blocked in MANY different ways, depending on how the defense plays against the run concept. In an effort to protect relationships with current coaches I won’t put any plays drawn up from current schemes, but here is a diagram of a run play from a BYU football playbook in the mid ’90s. This counter play has different blocking assignments for 7 different potential defensive fronts.
Offensive lineman playing in different schemes, against different defenses will be asked to do many different things. As with most statistics, using the double team rate as a stand-alone metric can only tell you so much. Using it in conjunction with the stats below can tell us more about an offensive lineman and how they affect the run game.
Run Behind
Offensive linemen live for pancakes, both the breakfast food and the aptly named event of flipping a defender onto their back and flattening them by landing on top of them. Sadly these are not officially collected stats and - even more sadly - there are no recognized individual run-blocking stats. Enter Hudl IQ.
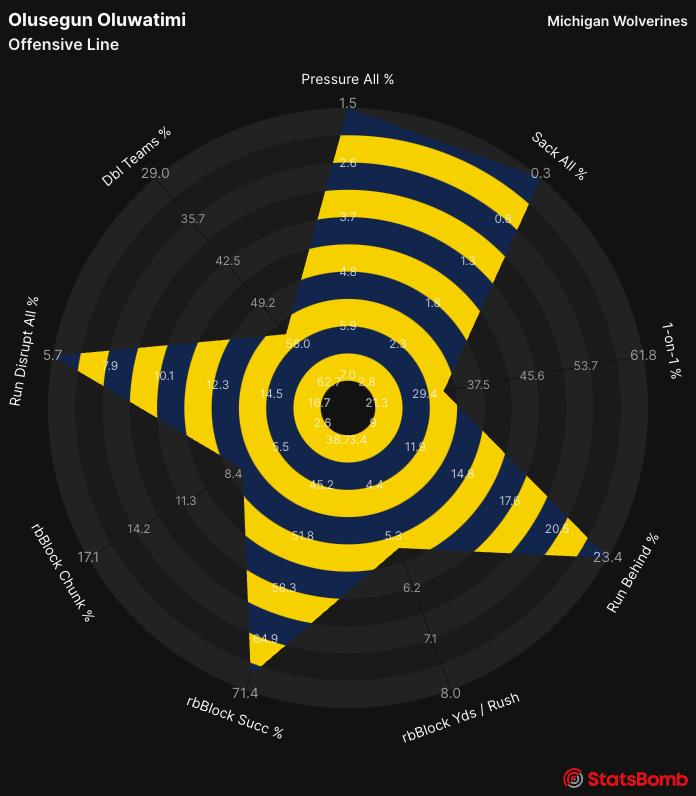
Using our line battles engagements data we are able to assign credit to the offensive lineman who are at the point of attack. They are credited with a “run behind” on a play where they, quite literally, run behind. One of the top available centers in the draft is Olu Oluwatimi from Michigan, a success story of the transfer portal if there ever was one. Out of high school had a few offers and ended up at Air Force, after one season Oluwatimi transferred to UVA. He started at UVA for three seasons before transferring to Michigan to finish his career. At Michigan, he won the Rimington Award and was part of the Joe Moore award-winning line. His radar says a lot about his ability and what led him to become so decorated for his final year. He allowed very few pressures and sacks, was the main OL in the run game a ton, and gave up very few run disruptions. Because he plays in the interior, he is always looking for work in pass protection, and helping his guards in the run game get to the next level, those specific metrics from his radar are low (again, take the whole picture into account). He is going to make whatever team drafts him very happy in a few weeks.
Run Disruptions
Continuing the run game focus at the end of our article we will finish with run disruptions. Think of run disruptions as the run game equivalent to pressures. And similar to our pressure metric, we take into account multiple factors as we quantify these.
- The defender’s distance from the runner at the time of the event
- The defender’s depth in the backfield
- Time since the snap
The main idea behind run disruptions is did a defender do something to disrupt the run in the backfield?
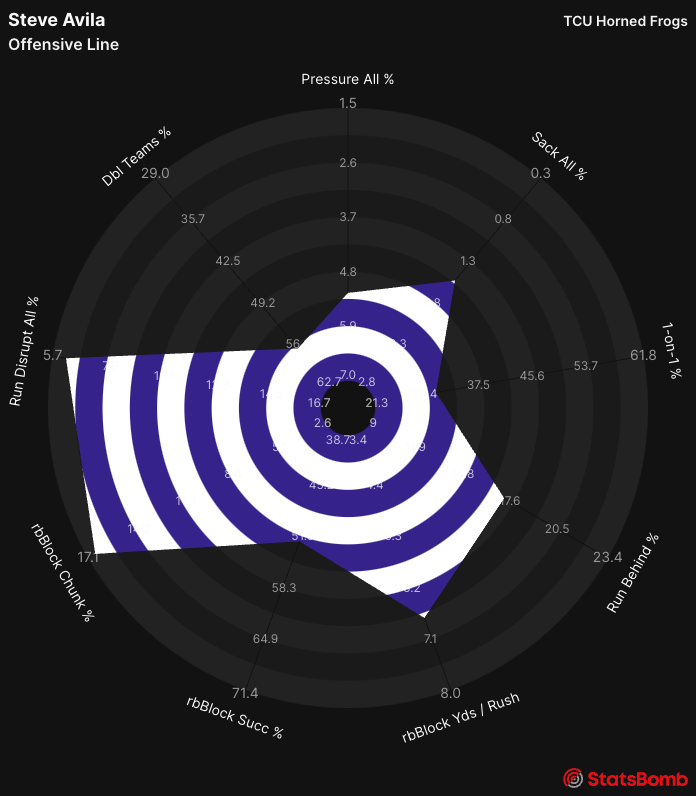
We can also evaluate offensive linemen by looking at the opposite of pressures. By using run-behind data along with run disruptions, we can determine how effective an offensive lineman is in run blocking. Steve Avila is a prime example of this. He is one of the most highly regarded interior offensive line prospects in the draft, and TCU frequently ran behind him. Despite this, he gave up very few run disruptions. Whenever he was at the point of attack, he consistently fulfilled his role, which enabled TCU to achieve success.
Conclusion
It is really exciting that the big guys up front are finally getting some visibility for the positive things they do. The future is almost unlimited as we grow with our understanding of the data and what it can tell us. Using this data we can start to answer questions like, how well do offensive linemen stay on blocks? How much push does an offensive lineman get in the run game? And, what kind of athleticism does an offensive lineman show in pass protection? Stay tuned as we continue to work with this rich dataset.
Matthew Edwards
Head of American Football Analysis
@thecoachedwards
