NOTE: Following Hudl’s acquisition of Statsbomb, its football platform is now called Hudl IQ. Learn more about the acquisition here.
One of my favorite articles that I’ve written while at Hudl Iq was an introduction of a new metric titled Randy. If you haven’t read the article yet, it’s worth taking the time to check it out. A quick recap of Randy to start would be helpful though.
Randy is a measure of the distance a receiver travels while the ball is in the air (in yards). For example, a receiver that runs a now or smoke screen and stands there while the QB throws the ball to him will have a Rrandy of 0. A receiver that runs a fade route and has to travel 10 yards while the ball is in the air will have a Randy of 10.
With that recap out of the way, it is time to jump into some Randy analysis.
Route Analysis
An easy way to help break down Randy is by looking at Randy by route concept. Deeper routes like fades, corners, posts, overs, and deep outs have the longest Randy. While routes that regularly require stopping and waiting for the ball from the QB (hitch, screen, comeback, curl) have the shortest Randy. Shorter routes like slants, quick ins and outs, and flat routes also tend to have shorter Randy as well.
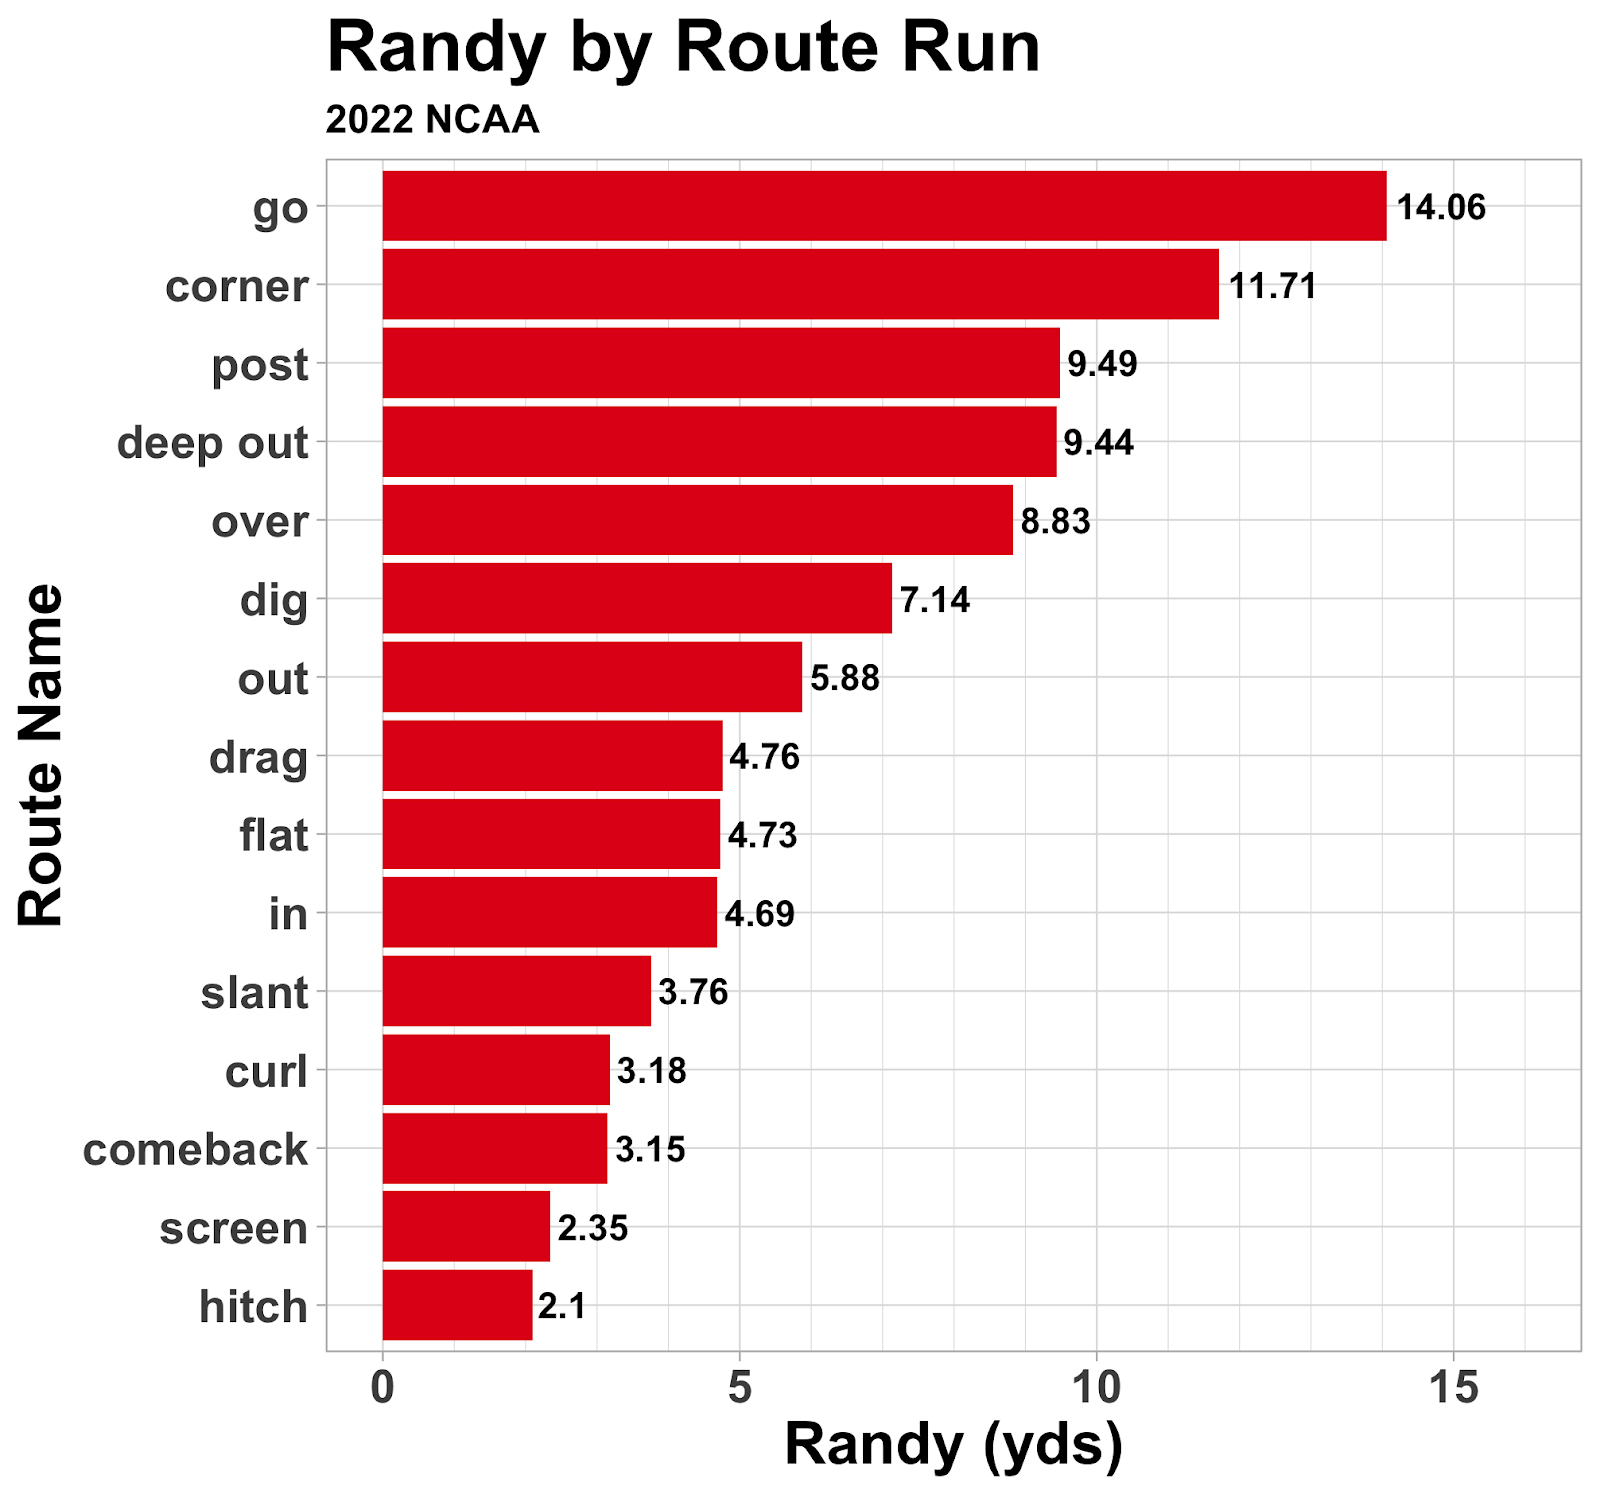
Another trend from this data is the difference between in-breaking routes (ins, digs, posts, slants) and out-breaking routes (outs, corners, flats). Each out-breaking route has a much higher randy than the corresponding in-breaking route. Corners and posts are similar routes, but the Randy is over 2 yards more for corners. Deep outs again are over 2 yards higher in Randy than digs. The difference is smaller for the shorter routes like ins and outs. The difference drops from 2 yards to 1, but the trend holds true. Add a shorter Randy to the list of reasons that teams should be throwing over the middle of the field more than to the outsides.
Randy vs Depth of Target
If I were running for some sort of statistical office, one of my platform items would be that average depth of target is not the same as pass distance. A 10 yard pass over the middle of the field is much different than a 10 yard out. The ball has to travel about three times as far!! Randy is another metric that shows that not all passes with the same depth of target are made the same.
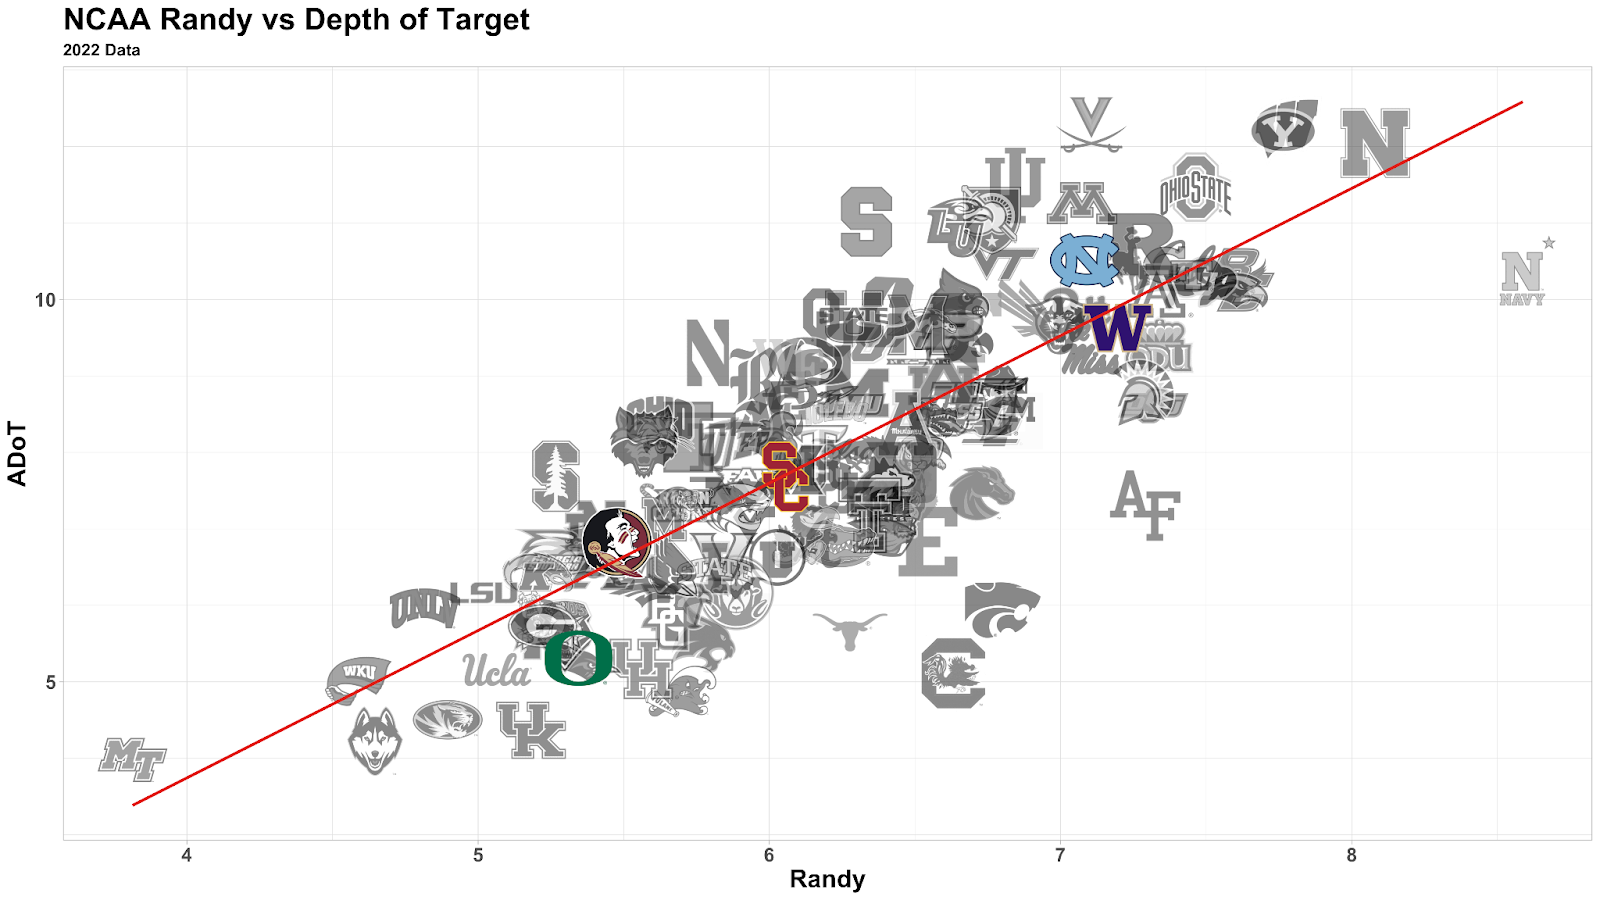
As mentioned above, in-breaking routes (and routes where the WR essentially stops to wait for the ball) have a much shorter Randy than out-breaking routes. In the chart above, if a team falls on the diagonal line, they have a roughly equal number of in-breaking and out-breaking routes. If they fall higher than the line they have more in-breaking routes. Below the line then, obviously shows the team throws more out-breaking routes. The highlighted teams are the teams with some of the top QB’s coming back next season. To use two of these QBs as examples, Drake Maye throws deep and more over the middle of the field, while Bo Nix throws short and more to the outside.
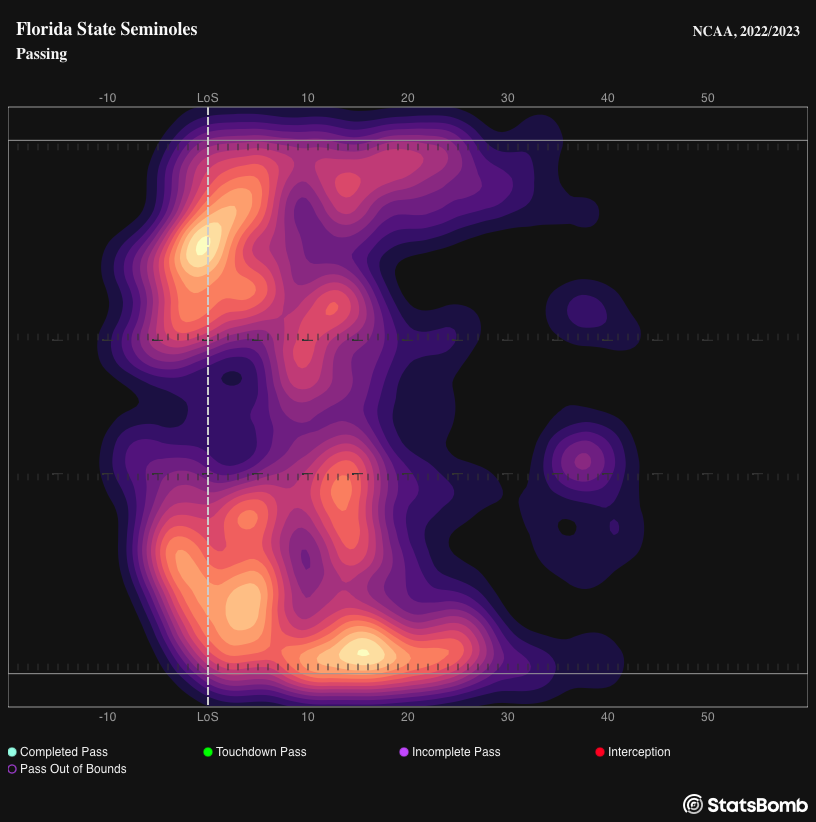
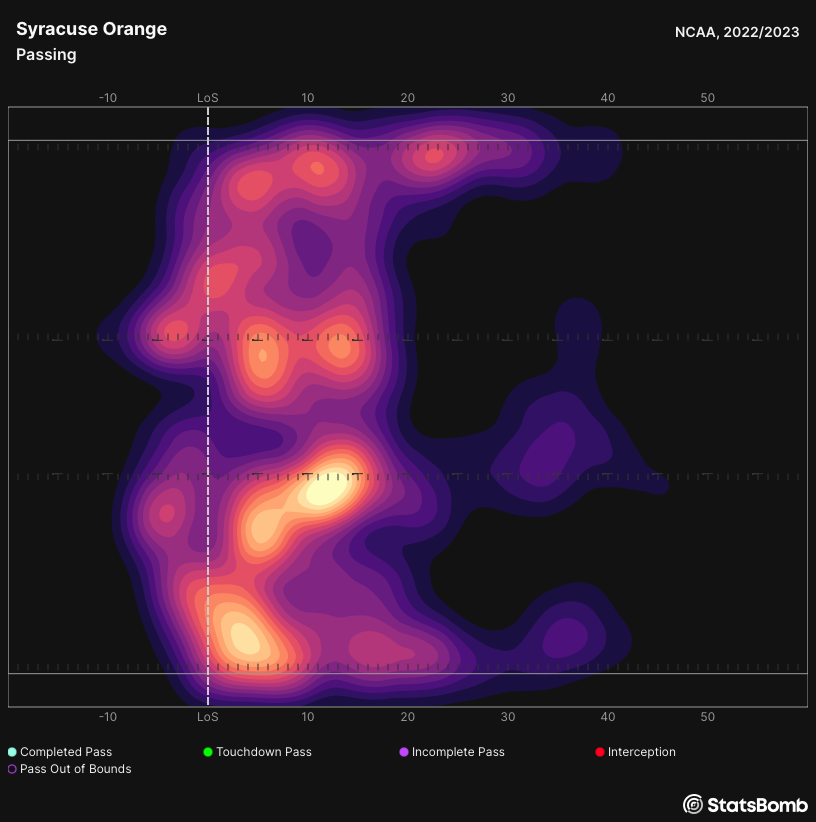
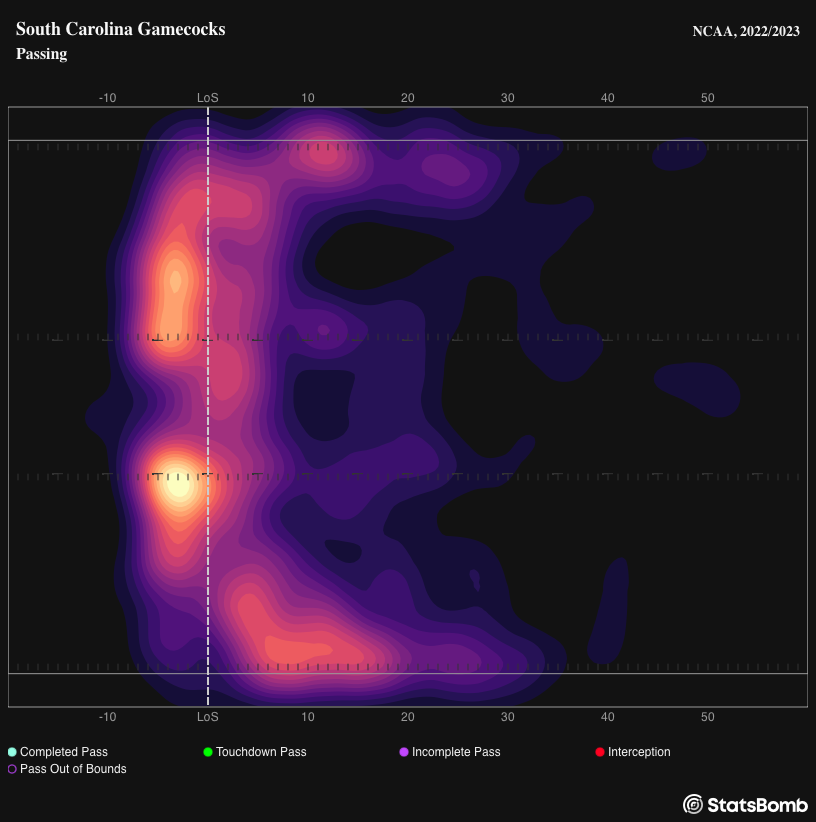
The three plots below show the heatmap of passes for Syracuse, South Carolina, and Florida State. Syracuse had the biggest variance from the average, and their plot shows a heavy tendency to throw over the middle of the field. South Carolina had high variance in the other direction, and their plot shows lots of outside targets. Florida State was right on the line and had a much more balanced target distribution across the width of the field.
Ohio State
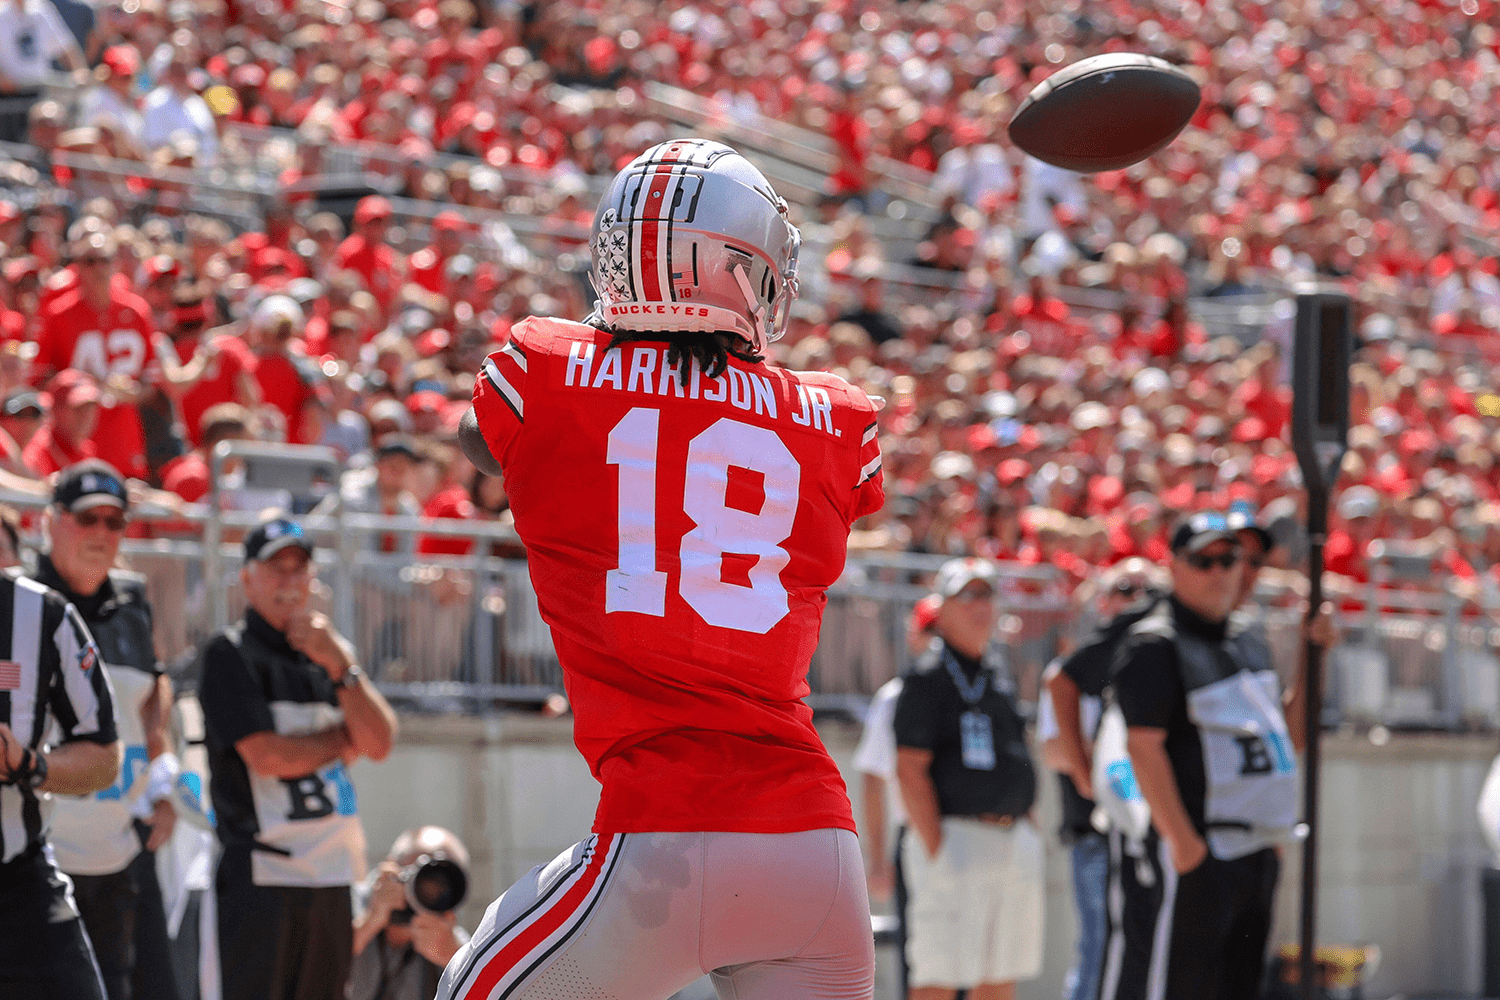
Ohio State has been churning out 1st round WR the past few seasons. Garrett Wilson, Chris Olave, and Jaxon Smith-Njigba all were 1st round selections. It is poised to continue the string of top draft picks next season with Marvin Harrison Jr, and potentially Emeka Egbuka. They have a strong argument to claim Wide Receiver U the past few seasons. Taking a look at Randy shows us how teams, in this case Ohio State, utilize their receivers in the pass game.
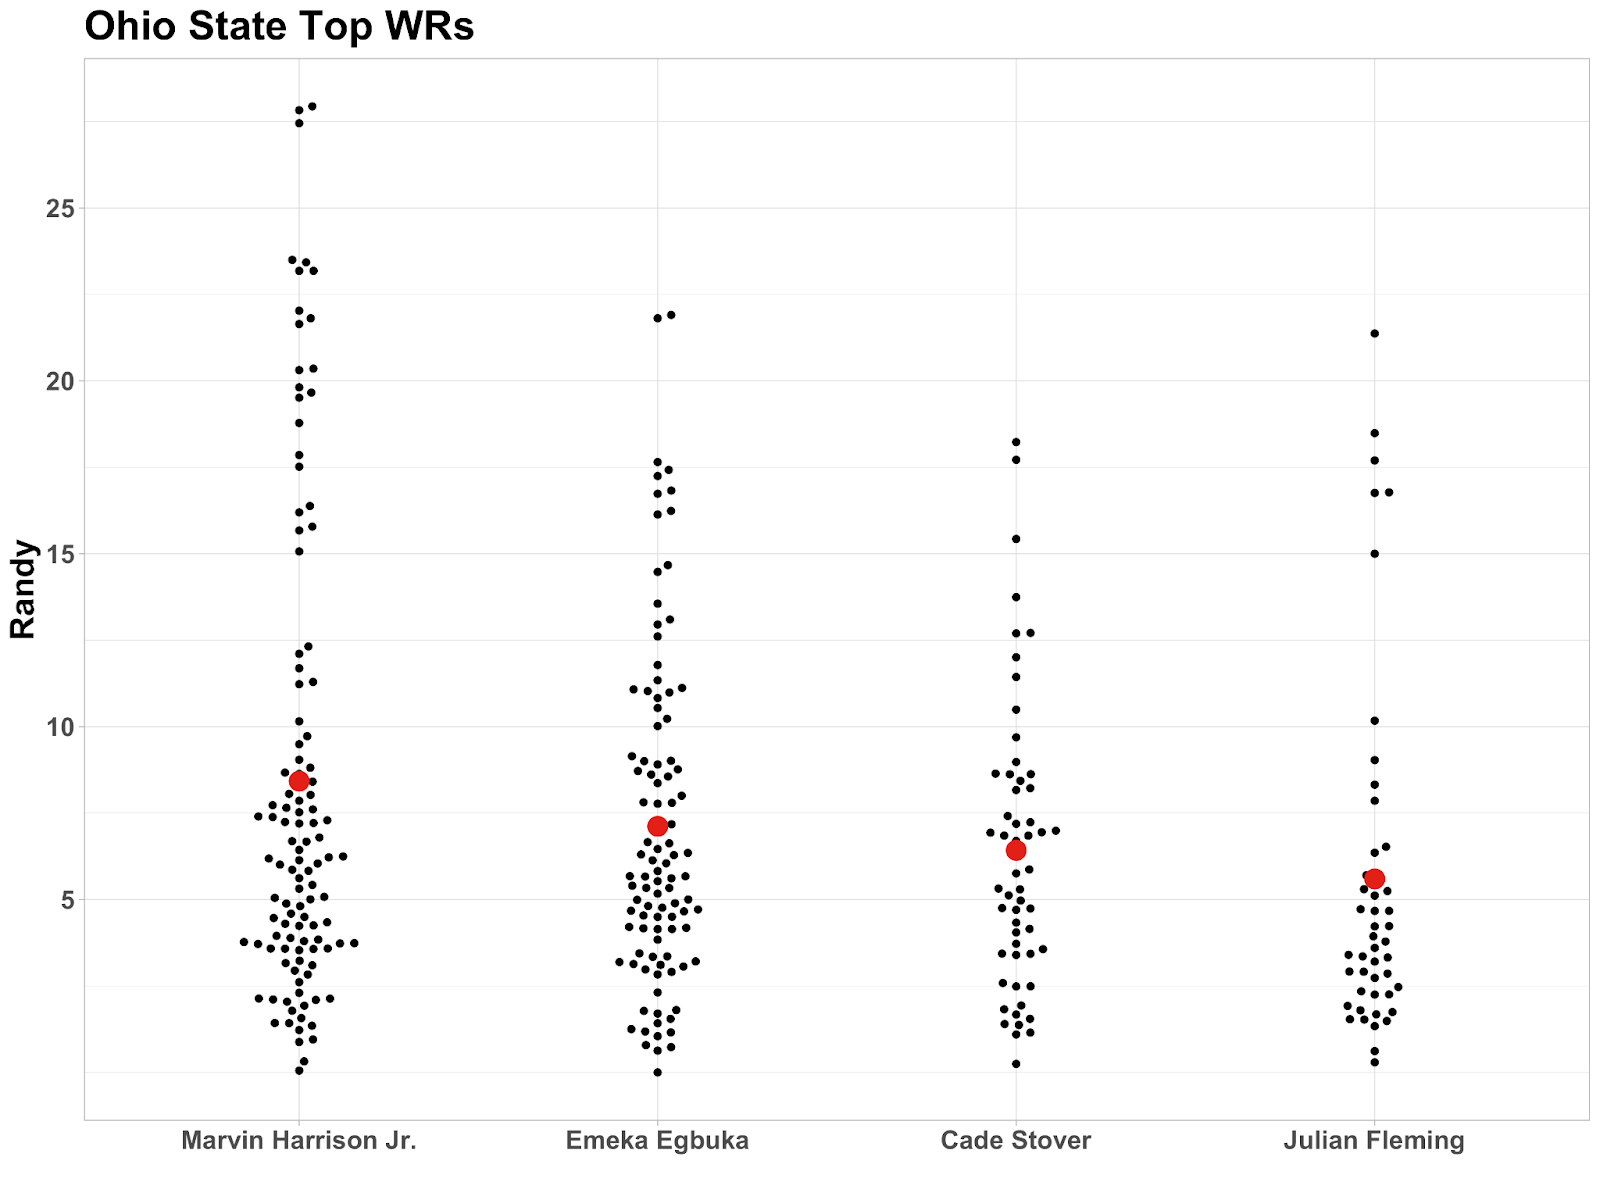
Marvin Harrison is Mr. Do-it-all for the Buckeyes. He has the highest average Randy on the team. However, he also is involved in many routes with low Randy. His chart is what you would like to see in a future top 5 pick, he can do everything. Emeka Egbuka is like a mini Marvin Harrison. Not quite as many deep balls as Harrison, but has a similar route tree with quite a few intermediate routes. Julian Fleming has the lowest Randy of the top WR’s. Lots of quick throws, not a lot of running while the ball is in the air.
CROE by Randy
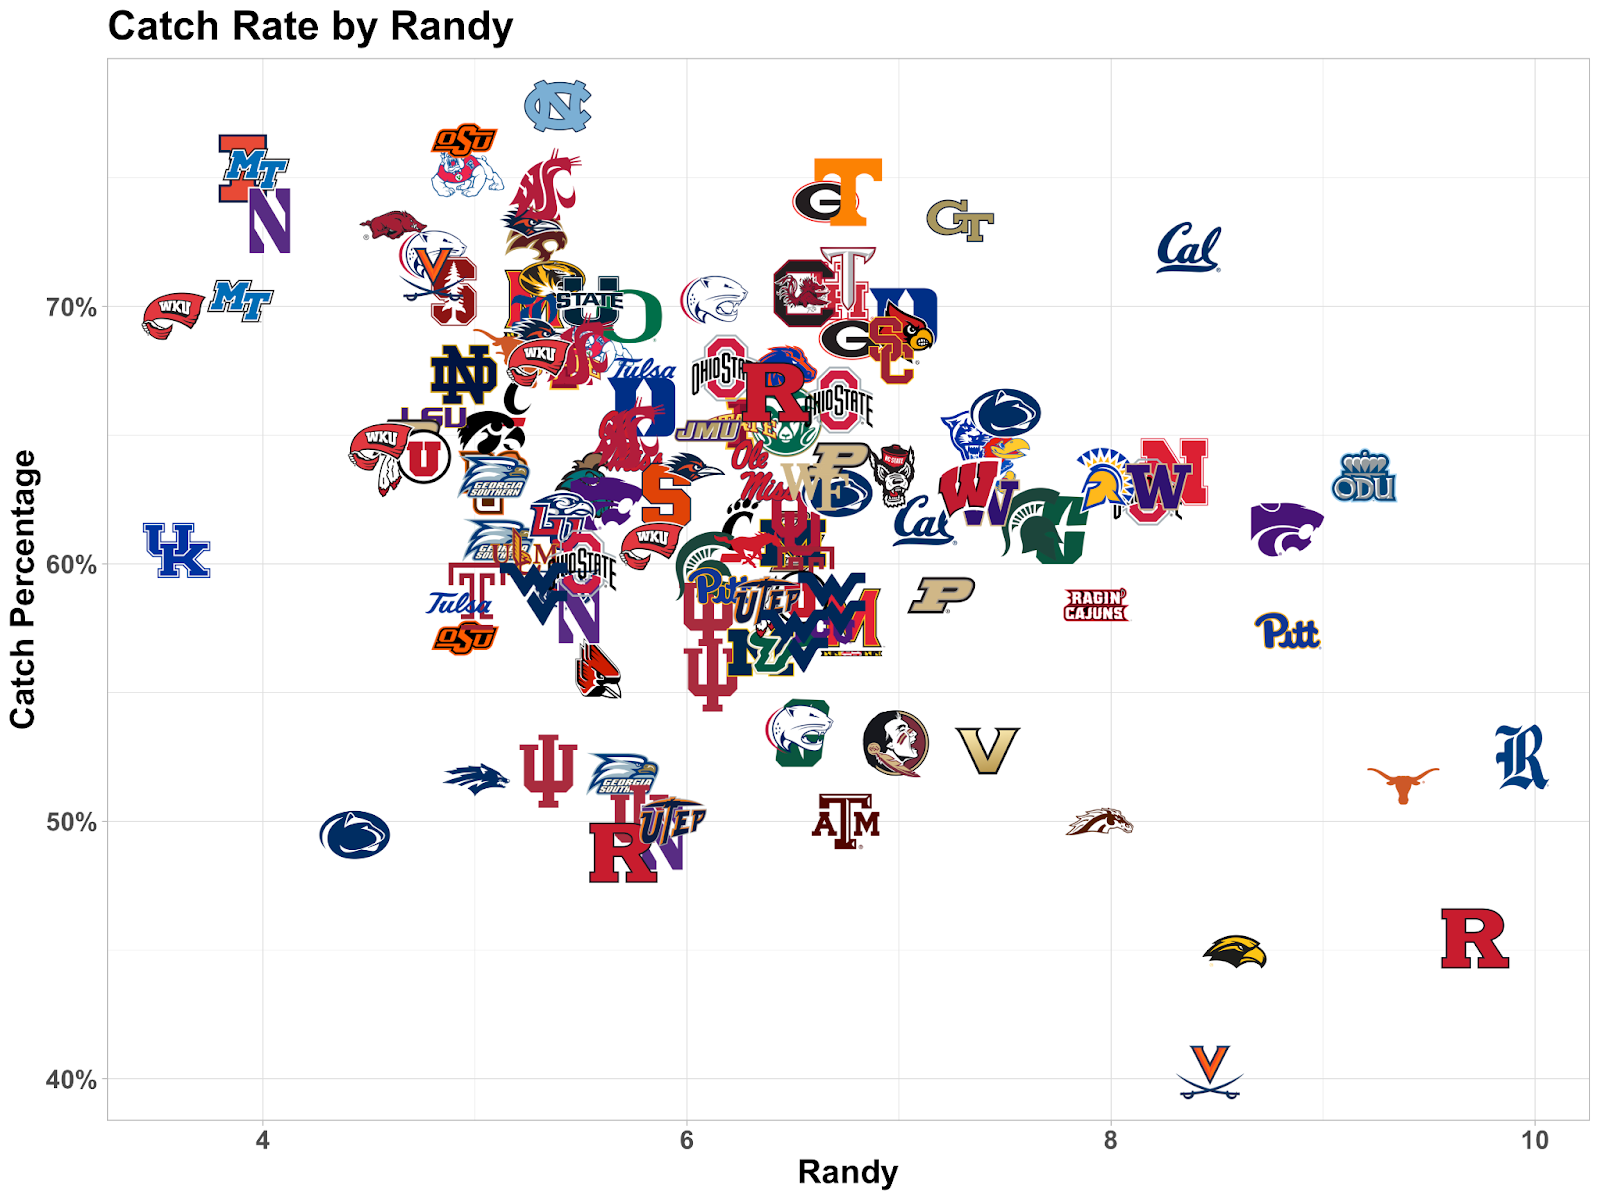
The last way we will utilize Randy is by looking at receiver catch rate. As you can see from the chart below, as Randy increases, catch rate decreases. Intuitively that makes sense, it is hard for receivers to run a long distance and continue to track the ball in flight as they are running. Taking into account things like Randy and depth of target, there are a few especially interesting outliers in expected catch percentage. The leader in CROE given Randy and depth of target was Tennessee’s vaunted deep threat Jalin Hyatt. Number two is someone to keep an eye on for this upcoming season, Jeremiah Hunter from Cal. With new OC Jake Spavital bringing in a fresh new offense, Hunter might be poised for a breakout season. Georgia Tight End Brock Bowers comes in fourth and is just a nightmare for opposing defenses.
Conclusion
Tracking data can be extremely overwhelming. Each play has 22 players, and with the locational data for every player 50 or so times a play it can feel like there is too much data (really, do we need over 1,000 data points per play?!). With tracking data, the possibilities for insightful information are endless, and Randy is an example of a simple metric that can tell an analyst a lot about a receiver, quarterback, and team. That information is invaluable as there has never been more uncertainty year to year in college football. Transfer portal, coaching changes, and teams changing conferences. 2023 has the makings of being a wild football season, and I can’t wait to keep an eye on some plays with big Randy!
Matthew Edwards
Head of American Football Analysis
@thecoachedwards

