StatsBomb’s dataspec was designed with a view to capture more of what happens on the football pitch. To that regard, passing was an area in which it was felt that improvements could be made from the perspectives of simply recording how the game is played right through to the functional utility of applying analytical processes on top of that data.
Pass footedness is one of the primary upgraded features of StatsBomb data and a useful indicator for player evaluation, but today we are going to look primarily at graded pass heights. Passes within StatsBomb Data can be either "High" (above shoulder height), "Low" (below shoulder height) or "Ground" (self explanatory). For some added clarity we will omit headers from the following charts. As you will see, team and league styles can be quite pronounced.

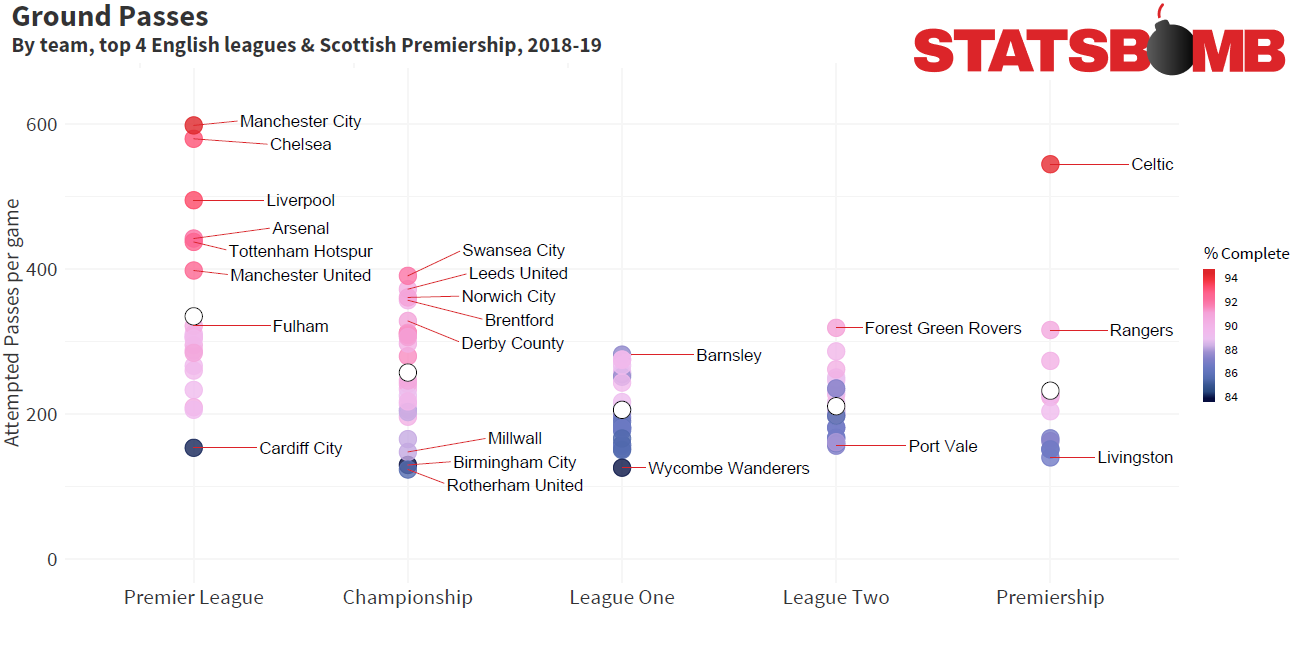
One of the benefits of collecting data across the entire 92 Premier League and Football League clubs, as well as the Scottish Premiership is to enable stylistic comparisons. We can see that at least in relation to the volume of ground passes. The big six Premier League clubs are in a league of their own--as are Celtic in Scotland. This is no surprise, but as we move elsewhere, there are further intriguing comparisons: Cardiff are complete stylistic outliers in the Premier League this season, and their completion rate here of 83.6% is third lowest of all 104 clubs in the sample.
That's a full six percent beneath the rates that Crystal Palace (89.7%) and Newcastle (89.9%) connect with their ground passes. Of course opportunity impacts volumes, but we see that the Championship possesses a clutch of teams that focus on a ground passing strategy: Graham Potter's Swansea, Marcelo Bielsa's Leeds United, Daniel Farke's Norwich City to name just three. One stylistic feature not shown here that emerged strongly from Leeds' overall profile was the high volume of low passes attempted; with over 48 per game, they try a full six more than any other team listed. With Bielsa ever interesting as a manager to study, this statistical quirk could well be worth further investigation. Far more compressed are Leagues One and Two.
They appear similar in general scope, but surprisingly, League One sees a slightly lower average volume and completion rate for both low and ground passes. Individual teams that stand out are Barnsley and Forest Green Rovers, both organisations that have forward thinking inputs, despite their relative positions in the league ladder. Discussions around the quality of the Scottish Premiership often yield arguments, but at least here, stylistically, the pass volumes and completion rates look more like the lower two leagues than the Championship, with Celtic a considerable outlier.

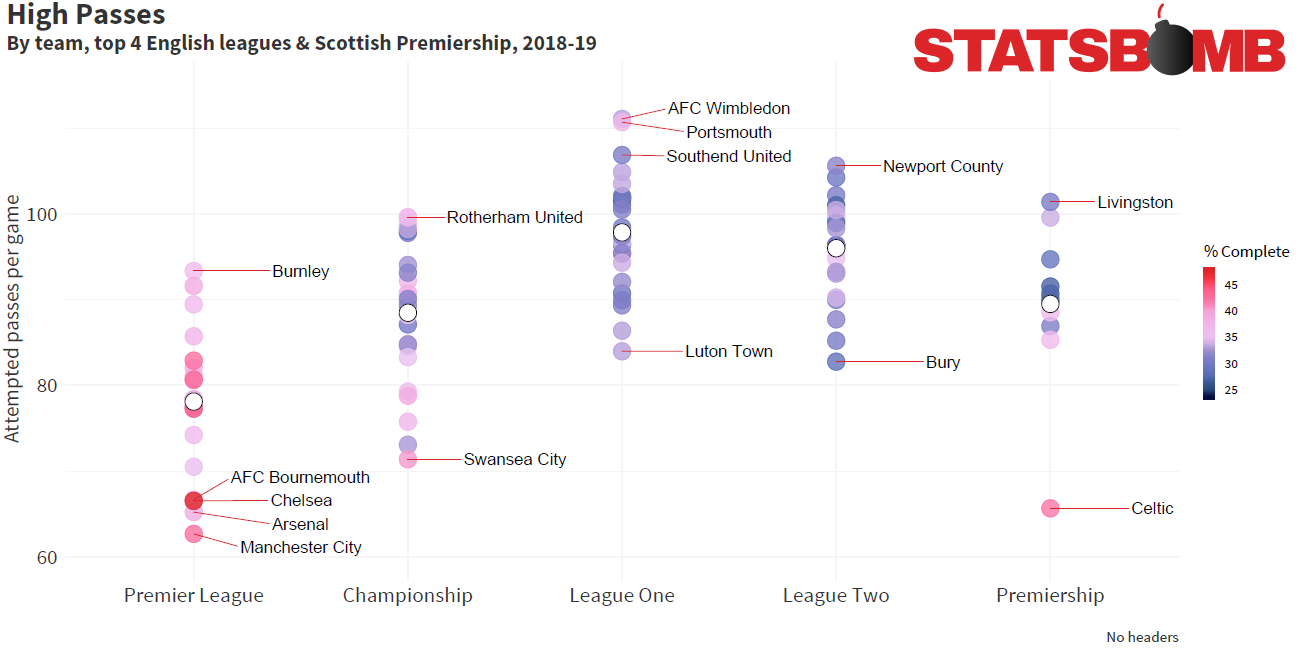
If we flip this to high passes, again clear distinctions between the leagues are apparent. Have Swansea refound the Swansea Way? The last two charts imply that they might have. Celtic once more look different to everyone else in Scotland and Leagues One and Two are again very similar in profile. One standout trend from this whole chart is the way that pass completion rates of high passes trend differently to ground passes.
In the last chart we saw a fairly simple and logical correlation between the volume of passes attempted and completion rate (r=0.84), here we see a weaker negative correlation (r=-0.50) but also what appears to be a skew towards completion rates for high passes at their highest in the Premier League. This offers ideas around player quality, both in passing ability and the ability to make space to attempt and receive such passes. Again logical, but nonetheless distinct.

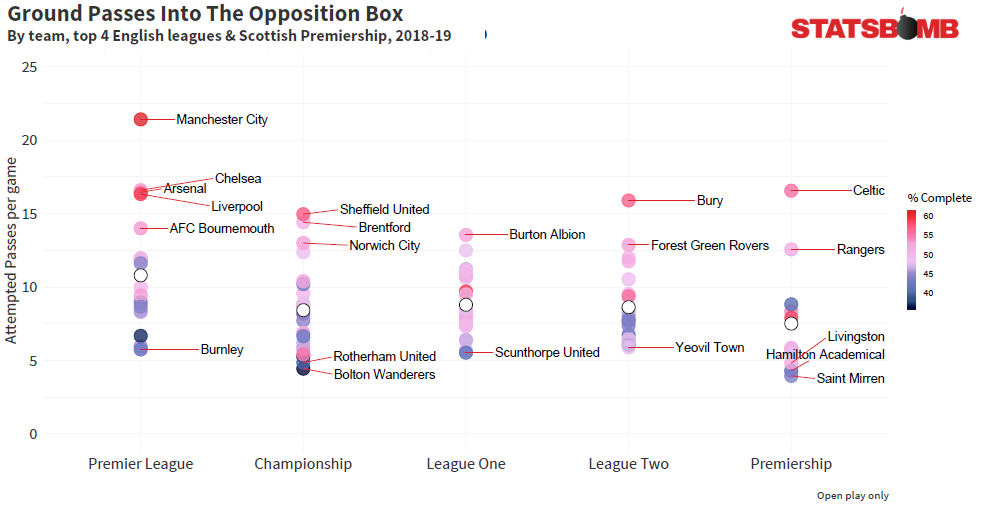
To get ideas around attacking intent we can extend our look into passes into the box from open play. General trends persist and once more most of the big Premier League clubs and Celtic stand out. But what of Bournemouth? Or Sheffield United, Burton or Bury? All clearly use a ground based philosophy when attacking their opponents' box and appear to have reasonable success.
At the other end, teams are attempting just a handful of such passes and completing barely any. These are teams that likely use the set-piece as a weapon or prioritise higher balls over low and ground passes. Overall trends we saw in general play appear weaker when filtered down to this level.

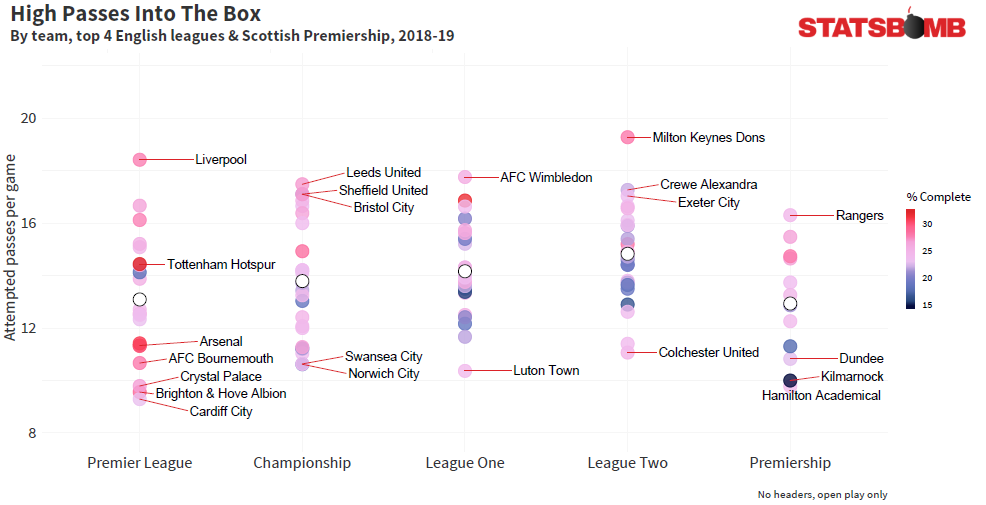
Now we see genuine stylistic curiosity--recall these are open play box entries via high passes. Would anyone expect that Liverpool would lead the Premier League numbers here? It's clear that they are well capable of attacking the box either on the deck or aerially and they show high volumes for both. Tottenham and Arsenal both show up less so for volume but for the rate in which they complete these type of passes.
Swansea are disinterested in this method as are Norwich, but Leeds--purveyors of high "ground pass" and "low pass" volume-- frequently put the ball in the air in the final third. Sheffield United, like Liverpool, show a varied and successful method of box entry. AFC Wimbledon and MK Dons top their respective divisions showing that regardless of which direction the club went, the old Wimbledon way looks to have persisted...
Hopefully this look at pass heights has offered some insight into how considering trends within the whole league pyramid can be informative. We've just scratched the surface, but when recruitment is so often local, it makes sense to understand the dynamics of teams across a whole market, and detailed data such as that collected by StatsBomb can help identify teams that play preferred styles for loan opportunities too. Look out for more of these charts on the twitter feed soon.