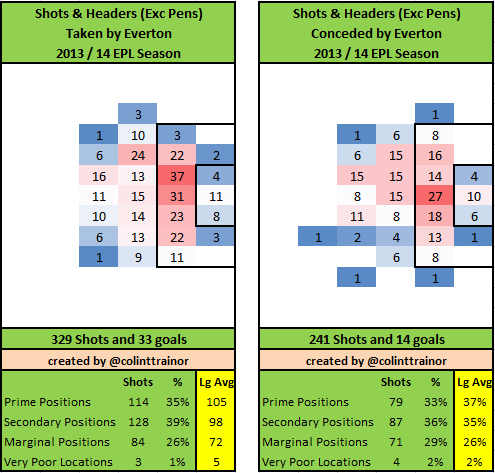
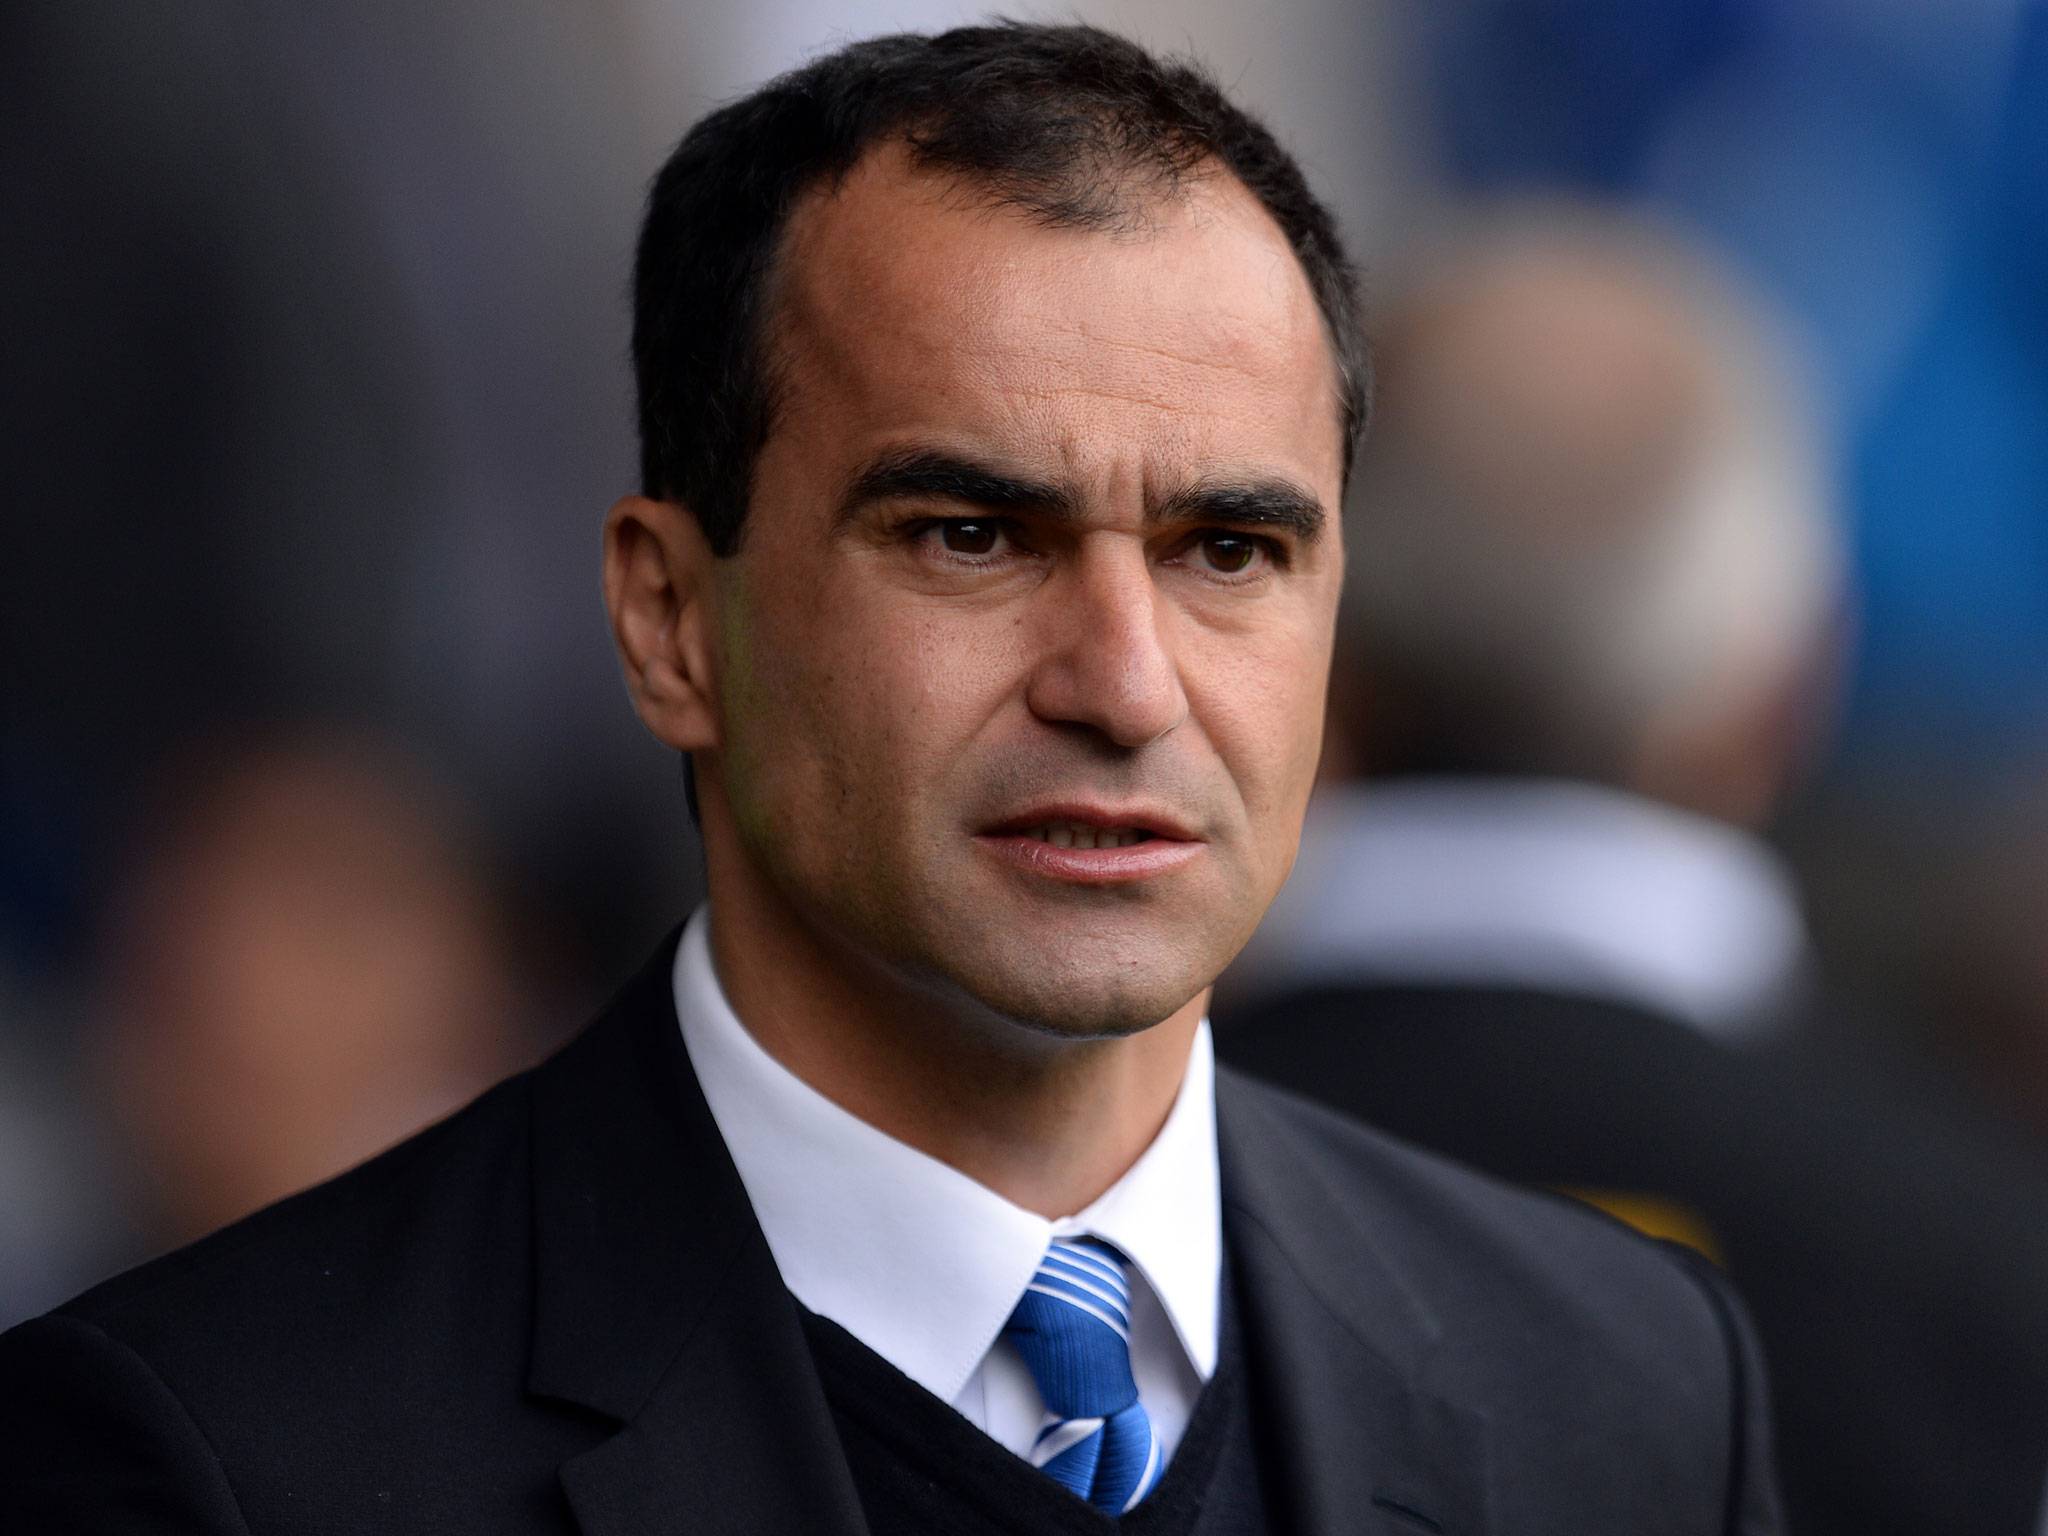
We are half way through the season and it is fair to say that Everton are performing above expectations as they sit in 5th position in the league. Roberto Martinez has brought his brand of attractive football with him from Wigan and, stylistically, they look an altogether different team than the one David Moyes left last spring. But what can their Shot Charts tell us about how they have performed?  If you require an explanation of the zones used in these images please scroll down to the bottom of this article. Everton Attack Everton have taken the 5th most shots in the league, but their average shot quality is worse than mid-table as they have taken just 35% of their shots from Prime positions, compared to a league average 37%. The Toffees make up for their shortfall in Prime Shots with an above average level of 39% of their shots coming from Secondary spots. All things taken into account, Everton have performed better than expectation as they have scored with 10% of their shots. Just the Top 4 plus Man United have scored with more than 10% of their non- penalty shots, and those five teams all have a considerably higher average shot quality than Everton. If I was forced to estimate the over performance I would suggest that they have scored about 2 goals more than their shots would have deserved. This is obviously not a significant over performance but it is notable that they are on the right side of the curve (from their point of view). Everton Defence A simple look at the league table tells us that Everton have excelled in defence this season. Through the concession of just 19 goals only Arsenal have conceded fewer goals (18) and the North London outfit have played one less game. However, according to my metrics Everton haven’t been as defensively solid as Arsenal and I think they owe a lot to the performance of Tim Howard for their low goals conceded tally. Maybe it's just what I read, but Howard has seemed to have operated under the radar this season. Their total of 241 non-penalty shots represents the 6th lowest number of shots conceded in the Premier League, and the quality of the shots they conceded is certainly lower than the league average with just 33% of their shots against coming from the Prime zone. The combination of these two effects results in the concession of 79 Prime zone shots, meaning that only Arsenal (63) and Man City (72) have allowed fewer shots from the Prime zone than Everton so far this campaign. The above numbers certainly suggest that Everton are defensively well organised, but in my eyes they don’t go quite far enough to explain why Everton’s defence have forced the lowest conversion rate in the league with just 5.8% of the opposition's non-penalty shots being scored. Arsenal are next, with 6.4% of non-penalty shots resulting in a goal, but Arsenal boast the lowest average shot quality allowed in the Premier League, and so all other things remaining equal we would expect Arsenal to have forced the lowest conversion rate. But this hasn't been the case. Tim Howard
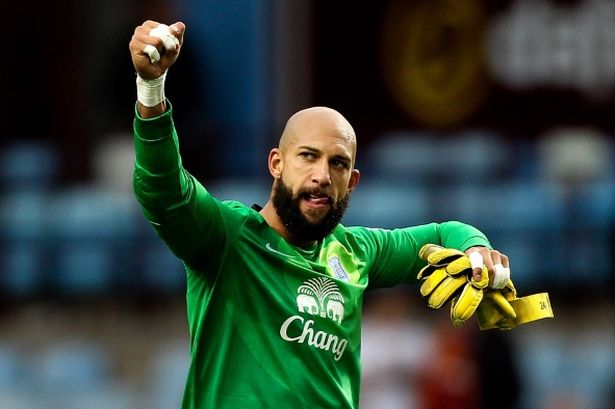
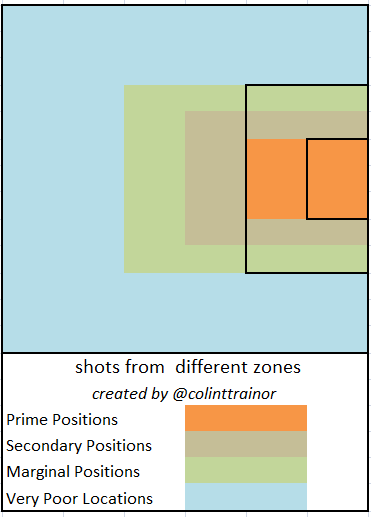
  As suggested above, I feel that Tim Howard has been a major reason why Everton have conceded so few goals this term. Regular readers of my articles will know that I use a version of our Expected Goal model (ExpG2) to rate goalkeeper save performances. This model takes into account both the details of the shot as well as looking at the actual shot placement, and on this metric I would content that Howard has probably been amongst the very best shot stopping goalkeepers in the league so far. Our figures would suggest that Howard has allowed 6 goals less than the shots (and placements) he has faced would suggest. One way of viewing Howard’s performance is to compare it with that of Chelsea’s keeper Petr Cech. Cech and Howard have both faced a similar amount of on target shots; the American has faced 69 on target shots and Cech 62. Yet despite facing more shots, Howard has only conceded 15 times to Cech’s 19. I’m not suggesting that Tim Howard is the only reason that Everton are hot on Liverpool’s tail for that all important 4th league position, but the performances of the unsung American are certainly part of the reason for why Martinez’s side are currently punching above their weight. Do I think Howard can continue posting the kind of save figures that he has during the first half of the season? No, I don't. His ExpG2 rating, along with Boruc and Mannone, is just in excess of what any Premier League goalkeeper has achieved over a full season (at least over the last few seasons that I have detailed stats for) and his current rating is substantially higher than he has personally posted over a complete season. In this regard I think Howard acts as a decent proxy for Everton's season. He has undoubtedly put in some really good performances but I don't think the results he has been achieving are sustainable and therefore I would expect a drop off over the second half of the season. Previous Mid Term Shot reports: Arsenal Man City Liverpool Man United Chelsea My Zones A reminder for any new readers of the zones that the summary box below the plots refer to:
  Each team plot has two images. The image on the left reflects the shots (excluding penalties) that the team has taken this season, while the image on the right sets out the shots they have allowed. The table underneath the image summarizes the shots by zone, and in order to aid comparison the numbers highlighted in yellow are the league averages.
2014
Everton's Shot Charts and Their Superb Defence
By Antonio
|
January 13, 2014
